
An official website of the United States government
An official website of the United States government
The .gov means it's official.
Federal government websites often end in .gov or .mil. Before sharing sensitive information,
make sure you're on a federal government site.
The site is secure.
The
https:// ensures that you are connecting to the official website and that any
information you provide is encrypted and transmitted securely.
The National Compensation Survey (NCS) publishes estimates of compensation costs and trends, as well as benefit coverage and provisions. Estimates are available by ownership (civilian, private industry, and state and local government), industry group, occupational group, and geographic areas.
The NCS excludes workers employed by the federal government, volunteers, unpaid workers, individuals receiving long-term disability compensation, overseas workers, workers who set their own pay (e.g., proprietors, owners, major stockholders, and partners in unincorporated firms), and the self-employed. Additional exclusions by industry, occupational group, and geographic areas are indicated in the respective sections below.
The sections below provide information on the use of the classification systems and availability of estimates by industry group, occupational group, and geographic areas. NCS product sections are collapsed by default. To expand or collapse all sections use the buttons below. Individual NCS product sections can be expanded or collapsed by clicking the arrow next to the section.
The North American Industry Classification System (NAICS) is the standard used by federal statistical agencies to classify establishments into industries for the purpose of collecting, analyzing, and publishing statistical data related to the U.S. economy. Prior to the implementation of NAICS, the NCS used the Standard Industry Classification (SIC) system to classify establishments. For information on the transition, see Change has come to the ECI and ECEC changes to NAICS and SOC. The NCS program adopted NAICS in 2004 for the Employer Costs for Employee Compensation and in 2006 for the Employment Cost Index. Currently, the NCS program uses NAICS 2022. There are several industry groups that are out of scope for the NCS including agriculture, forestry, farming, and hunting (sector 11), postal service (industry group 491), and private households (industry group 814).
The tables below contain the industries and industry groups published in the Employment Cost Index (ECI), Employer Costs for Employee Compensation (ECEC), and Employee Benefits in the Unites States are covered in this section. Estimates for some industries and industry groups are not available for all of the ownerships or NCS products. For example, estimates for schools (6111, 6112, and 6113) are available for state and local government workers in the ECI but are not available for ECEC and Employee Benefits in the United States.
Additionally, the tables provide the NAICS code and corresponding NCS industry code used in the mapping (text) files that accompany the public database estimates. The two-digit NAICS codes represent the sectors such as construction (sector 23) and more detailed NAICS codes represent industry groups such as credit intermediation and related activities (522) and industries elementary and secondary schools (6111). Dashes (-) indicate a span of sectors, industry groups, or industries. For example, retail trade includes store (sector 44) and nonstore (sector 45) retailers.
| Industry title | NAICS code | NCS industry code (1) |
|---|---|---|
|
All workers |
21-92 | 000000 |
|
Goods-producing industries |
21, 23, 31-33 | G00000 |
|
Construction (2) |
23 | 230000 |
|
Manufacturing (3) |
31-33 | 300000 |
|
Aircraft manufacturing (2) |
336411 | 336411 |
|
Service-providing industries |
22, 42-92 | S00000 |
|
Trade, transportation, and utilities (2) |
42, 44-45, 48-49, 22 | 400000 |
|
Utilities (3) |
22 | 220000 |
|
Wholesale trade (2) |
42 | 420000 |
|
Retail trade (2) |
44-45 | 412000 |
|
Transportation and warehousing (2) |
48-49 | 430000 |
|
Information (2) |
51 | 510000 |
|
Financial activities (2) |
52-53 | 520A00 |
|
Finance and insurance (2) |
52 | 520000 |
|
Credit intermediation and related activities (2) |
522 | 522000 |
|
Insurance carriers and related activities (2) |
524 | 524000 |
|
Real estate and rental and leasing (2) |
53 | 530000 |
|
Professional and business services (2) |
54-56 | 540A00 |
|
Professional, scientific, and technical services (2) |
54 | 540000 |
|
Administrative and support and waste management and remediation |
56 | 560000 |
|
Education and health services |
61-62 | 600000 |
|
Educational services |
61 | 610000 |
|
Schools (4) |
6111-6113 | 610500 |
|
Elementary and secondary schools (5) |
6111 | 611100 |
|
Junior colleges, colleges, universities, and professional schools (3) |
6112-6113 | 612000 |
|
Healthcare and social assistance |
62 | 620000 |
|
Hospitals |
622 | 622000 |
|
Nursing and residential care facilities (3) |
623 | 623000 |
|
Nursing care facilities (2) |
6231 | 623100 |
|
Leisure and hospitality (2) |
71-72 | 700000 |
|
Accommodation and food services (2) |
72 | 720000 |
|
Other services (except Public administration) (2) |
81 | 810000 |
|
Public administration (5) |
92 | 920000 |
|
Footnotes: |
||
|
Source: U.S. Bureau of Labor Statistics, National Compensation Survey and the North American Industry Classification System |
||
| Industry title | NAICS code | NCS industry code (1) |
|---|---|---|
|
All workers |
21-92 | 000000 |
|
Goods-producing industries (2) |
21, 23, 31-33 | G00000 |
|
Construction (3) |
23 | 230000 |
|
Manufacturing (3) |
31-33 | 300000 |
|
Aircraft manufacturing (3) |
336411 | 336411 |
|
Service-providing industries |
22, 42-92 | S00000 |
|
Trade, transportation, and utilities (3) |
42, 44-45, 48-49, 22 | 400000 |
|
Utilities (3) |
22 | 220000 |
|
Wholesale trade (3) |
42 | 420000 |
|
Retail trade (3) |
44-45 | 412000 |
|
Transportation and warehousing (3) |
48-49 | 430000 |
|
Information (3) |
51 | 510000 |
|
Financial activities (3) |
52-53 | 520A00 |
|
Finance and insurance (3) |
52 | 520000 |
|
Credit intermediation and related activities (3) |
522 | 522000 |
|
Insurance carriers and related activities (3) |
524 | 524000 |
|
Real estate and rental and leasing (3) |
53 | 530000 |
|
Professional and business services (3) |
54-56 | 540A00 |
|
Professional, scientific, and technical services (3) |
54 | 540000 |
|
Administrative and support and waste management and remediation |
56 | 560000 |
|
Education and health services |
61-62 | 600000 |
|
Educational services |
61 | 610000 |
|
Elementary and secondary schools (4) |
6111 | 611100 |
|
Junior colleges, colleges, universities, and professional schools |
6112-6113 | 612000 |
|
Healthcare and social assistance |
62 | 620000 |
|
Hospitals |
622 | 622000 |
|
Nursing and residential care facilities (3) |
623 | 623000 |
|
Nursing care facilities (3) |
6231 | 623100 |
|
Leisure and hospitality (3) |
71-72 | 700000 |
|
Accommodation and food services (3) |
72 | 720000 |
|
Other services (except Public administration) (3) |
81 | 810000 |
|
Public administration (5) |
92 | 920000 |
|
Footnotes: |
||
|
Source: U.S. Bureau of Labor Statistics, National Compensation Survey and the North American Industry Classification System |
||
| Industry title | NAICS code | NCS industry code (1) |
|---|---|---|
|
All workers |
21-92 | 000000 |
|
Goods-producing industries (2) |
21, 23, 31-33 | G00000 |
|
Construction (3) |
23 | 230000 |
|
Manufacturing (3) |
31-33 | 300000 |
|
Service-providing industries |
22, 42-92 | S00000 |
|
Trade, transportation, and utilities (3) |
42, 44-45, 48-49, 22 | 400000 |
|
Utilities (3) |
22 | 220000 |
|
Wholesale trade (3) |
42 | 420000 |
|
Retail trade (3) |
44-45 | 412000 |
|
Transportation and warehousing (3) |
48, 49 | 430000 |
|
Information (3) |
51 | 510000 |
|
Financial activities (3) |
52-53 | 520A00 |
|
Finance and insurance (3) |
52 | 520000 |
|
Credit intermediation and related activities (3) |
522 | 522000 |
|
Insurance carriers and related activities (3) |
524 | 524000 |
|
Real estate and rental and leasing (3) |
53 | 530000 |
|
Professional and business services (3) |
54-56 | 540A00 |
|
Professional, scientific, and technical services (3) |
54 | 540000 |
|
Administrative and support and waste management and remediation services (3) |
56 | 560000 |
|
Education and health services |
61-62 | 600000 |
|
Educational services |
61 | 610000 |
|
Elementary and secondary schools (4) |
6111 | 611100 |
|
Junior colleges, colleges, universities, and professional schools |
6112, 6113 | 612000 |
|
Healthcare and social assistance |
62 | 620000 |
|
Hospitals (4) |
622 | 622000 |
|
Leisure and hospitality (3) |
71-72 | 700000 |
|
Accommodation and food services (3) |
72 | 720000 |
|
Other services (except Public administration) (3) |
81 | 810000 |
|
Public administration (3) |
92 | 920000 |
|
Footnotes: |
||
|
Source: U.S. Bureau of Labor Statistics, National Compensation Survey and the North American Industry Classification System |
||
The Standard Occupational Classification (SOC) system is the standard used by federal statistical agencies to classify workers into occupations for the purpose of collecting, analyzing, and publishing statistical data related to the U.S. economy. In the SOC, occupations are classified into 23 major groups; however, military specific occupations (55-0000) are out of scope for the NCS program.
In order to reflect the most up to date occupations in the economy, the classification system is periodically updated. The NCS is currently sampling and collecting occupational data based on SOC 2022. For a history of reweights and classification updates in the ECI, see the Reweighting and Recoding in the ECI factsheet.
The tables below contain the occupations and occupational groups published in the Employment Cost Index (ECI), Employer Costs for Employee Compensation (ECEC), and Employee Benefits in the Unites States. Estimates for some occupations and occupational groups are not available for all of the ownerships or NCS products. For example, estimates for teachers (25-1000) are available for civilian workers in the ECEC and benefits publications but not for the ECI. Additionally, the tables below provide the SOC code and corresponding occupational code used by the NCS in the mapping files for use with the public database.
| Occupational groups | SOC code | Occupation code (1) |
|---|---|---|
|
All workers |
11-53 | 000000 |
|
Management, professional, and related |
11-29 | 112900 |
|
Management, business, and financial (2) |
11-13 | 111300 |
|
Professional and related |
15-29 | 152900 |
|
Service occupations |
31-39 | 313900 |
|
Sales and office |
41-43 | 414300 |
|
Sales and related |
41 | 410000 |
|
Office and administrative support |
43 | 430000 |
|
Natural resources, construction, and maintenance (2) |
45-49 | 454900 |
|
Construction and extraction, farming, fishing, and forestry (2) |
45-47 | 454700 |
|
Installation, maintenance, and repair (2) |
49 | 490000 |
|
Production, transportation, and material moving (2) |
51-53 | 515300 |
|
Production occupations (2) |
51 | 510000 |
|
Transportation and material moving (2) |
53 | 530000 |
|
Footnotes: |
||
|
Source: U.S. Bureau of Labor Statistics, National Compensation Survey and the Standard Occupational Classification |
||
| Occupational groups | SOC code | Occupation code (1) |
|---|---|---|
|
All workers |
11-53 | 000000 |
|
Management, professional, and related |
11-29 | 112900 |
|
Management, business, and financial (2) |
11-13 | 111300 |
|
Professional and related |
15-29 | 152900 |
|
Teachers (3) |
251-253 | 250001 |
|
Primary, secondary, and special education teachers (3) |
252 | 252000 |
|
Registered nurses (2) |
29114 | 291111 |
|
Service |
31-39 | 313900 |
|
Sales and office |
41-43 | 414300 |
|
Sales and related (2) |
41 | 410000 |
|
Office and administrative support |
43 | 430000 |
|
Natural resources, construction, and maintenance (2) |
45-49 | 454900 |
|
Construction and extraction, farming, fishing, and forestry (2) |
45-47 | 454700 |
|
Installation, maintenance, and repair (2) |
49 | 490000 |
|
Production, transportation, and material moving (2) |
51-53 | 515300 |
|
Production occupations (2) |
51 | 510000 |
|
Transportation and material moving (2) |
53 | 530000 |
|
Footnotes: |
||
|
Source: U.S. Bureau of Labor Statistics, National Compensation Survey and the Standard Occupational Classification |
||
| Occupational groups | SOC code | Occupation code (1) |
|---|---|---|
|
All workers |
11-53 | 000000 |
|
Management, professional, and related |
11-29 | 112900 |
|
Management, business, and financial (2) |
11-13 | 111300 |
|
Professional and related |
15-29 | 152900 |
|
Teachers (3) |
251-253 | 250001 |
|
Primary, secondary, and special education teachers (3) |
252 | 252000 |
|
Registered nurses (4) |
29114 | 291111 |
|
Service |
31-39 | 313900 |
|
Protective service |
33 | 330000 |
|
Sales and office |
41-43 | 414300 |
|
Sales and related (2) |
41 | 410000 |
|
Office and administrative support |
43 | 430000 |
|
Natural resources, construction, and maintenance |
45-49 | 454900 |
|
Construction and extraction, farming, fishing, and forestry (2) |
45-47 | 454700 |
|
Installation, maintenance, and repair (2) |
49 | 490000 |
|
Production, transportation, and material moving |
51-53 | 515300 |
|
Production occupations (2) |
51 | 510000 |
|
Transportation and material moving (2) |
53 | 530000 |
|
Footnotes: |
||
|
Source: U.S. Bureau of Labor Statistics, National Compensation Survey and the Standard Occupational Classification |
||
The NCS adopted the SOC system in 2006. For information on the transition from the Occupational Classification System (OCS) to SOC, see Change has come to the ECI and ECEC changes to NAICS and SOC.
The white collar and blue collar occupational series were discontinued in 2007. The white collar category consists of occupations (such as accountants and cashiers) with disparate wage and compensation rates. The table below provides the occupations and corresponding Major Occupational Groups (MOGs) from the SOC and OCS that composed each of the discontinued series. Many detailed occupations differ between the SOC and OCS and thus the occupational groups may not be comparable. For more information on series continuity, see Comparing Current and Former Industry and Occupation ECEC Series and Introducing 2002 weights for the Employment Cost Index.
| OCS Occupational groups | OCS Major Occupational Groups (MOGs) | SOC Major Occupational Groups (MOGs) |
|---|---|---|
|
All workers(1) |
A, B, C, D, E, F, G, H, K | 11-53 |
|
White collar |
A, B, C, D | 11-29, 41-43 |
|
Professional, technical, and related (1) |
A | 15-29 |
|
Executive, administrative, and managerial (1) |
B | 11-13 |
|
Sales (1) |
C | 41 |
|
Administrative support (1) |
D | 43 |
|
Blue collar |
E, F, G, H | 45-53 |
|
Precision production, craft, and repair |
E | 47-49 |
|
Machine operators, assemblers, and inspectors |
F | 51 |
|
Transportation and material moving |
G | 53 |
|
Handlers, equipment cleaners, helpers, and laborers (2) |
H | 45 |
|
Service (1) |
K | 31-39 |
|
Footnotes: |
||
|
Source: U.S. Bureau of Labor Statistics, National Compensation Survey, the Occupational Classification System, and the Standard Occupational Classification |
||
The NCS uses a sample design based on 24 geographic areas that consist of the 15 largest Metropolitan Statistical Areas (MSAs) and Combined Statistical Areas (CSAs) based on total employment and the balance (rest) of the 9 census divisions. The balance (rest) of census divisions are the remaining portions of each of the divisions excluding the 15 largest MSAs and CSAs. Establishments from all 50 states and the District of Columbia are eligible for selection. In 2006, the NCS expanded the published geographic detail by adding the nine census divisions which compose the four census regions. In 2009, compensation costs and changes were added for the 15 largest MSAs and CSAs see BLS introduces New Employer Costs for Employee Compensation Data for Private Industry Workers in 15 Metropolitan Areas and BLS introduces new Employment Cost Indexes for 14 metropolitan areas.
There are four census regions comprised of states and the District of Columbia. Each census region can be further disaggregated to smaller areas, which are referred to as census divisions.
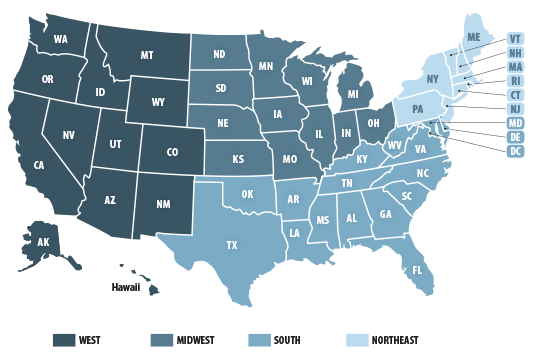
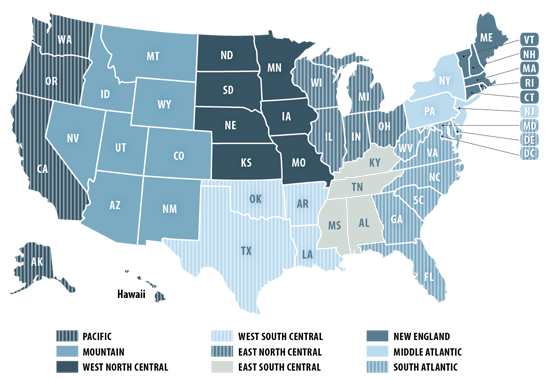
The nine census divisions are groupings of the fifty states as well as the District of Columbia which compose the four census regions.
| Region: | Northeast | South | Midwest | West | |||||
|---|---|---|---|---|---|---|---|---|---|
| Division: | New England | Middle Atlantic | South Atlantic | East South Central | West South Central | East North Central | West North Central | Mountain | Pacific |
| States: | Connecticut, Maine, Massachusetts, New Hampshire, Rhode Island, Vermont | New Jersey, New York, Pennsylvania | Delaware, District of Columbia, Florida, Georgia, Maryland, North Carolina, South Carolina, Virginia, West Virginia | Alabama, Kentucky, Mississippi, Tennessee | Arkansas, Louisiana, Oklahoma, Texas | Illinois, Indiana, Michigan, Ohio, Wisconsin | Iowa, Kansas, Minnesota, Missouri, Nebraska, North Dakota, South Dakota | Arizona, Colorado, Idaho, Montana, Nevada, New Mexico, Utah, Wyoming | Alaska, California, Hawaii, Oregon, Washington |
|
Source: U.S. Bureau of Labor Statistics, National Compensation Survey, U.S. Census, and Office of Management and Budget |
|||||||||
Beginning with the June 2025 ECI news release, area definitions were updated based on the Office of Management and Budget Bulletin No. 23-01, dated July 21, 2023. For a list of the counties and planning regions included in each MSA/CSA, see the Metro Area - County spreadsheet.
For more information on metropolitan area definitions and the history of area definition updates in the ECI, see the Tracking Wage Growth in American Cities factsheet.
| Census Region | Metropolitan Statistical Area / Combined Statistical Area | |||||
|---|---|---|---|---|---|---|
|
Northeast |
Boston-Worcester-Providence, MA-RI-NH CSA | |||||
| New York-Newark, NY-NJ-CT-PA CSA | ||||||
| Philadelphia-Reading-Camden, PA-NJ-DE-MD CSA | ||||||
|
South |
Atlanta-Athens-Clarke County-Sandy Springs, GA-AL CSA | |||||
| Dallas-Fort Worth, TX-OK CSA | ||||||
| Houston-Pasadena, TX CSA | ||||||
| Miami-Port St. Lucie-Fort Lauderdale, FL CSA | ||||||
| Washington-Baltimore-Arlington, DC-MD-VA-WV-PA CSA | ||||||
|
Midwest |
Chicago-Naperville, IL-IN-WI CSA | |||||
| Detroit-Warren-Ann Arbor, MI CSA | ||||||
| Minneapolis-St. Paul, MN-WI CSA | ||||||
|
West |
Los Angeles-Long Beach, CA CSA | |||||
| Phoenix-Mesa, AZ CSA | ||||||
| San Jose-San Francisco-Oakland, CA CSA | ||||||
| Seattle-Tacoma, WA CSA | ||||||
|
Source: U.S. Bureau of Labor Statistics, National Compensation Survey, U.S. Census, and Office of Management and Budget |
||||||
For technical information on survey methods, see the Handbook of Methods for the ECI, ECEC, and Benefits. For more information on transition from SIC to NAICS and OCS to SOC, see Employment Cost Index publication plans and Transitional Employment Cost Indexes for seasonal adjustment.
Last Modified Date: March 4, 2026