
An official website of the United States government
An official website of the United States government
The .gov means it's official.
Federal government websites often end in .gov or .mil. Before sharing sensitive information,
make sure you're on a federal government site.
The site is secure.
The
https:// ensures that you are connecting to the official website and that any
information you provide is encrypted and transmitted securely.
The Employment Cost Index (ECI) measures the change in hourly labor costs to employers, free from influence of employment shifts among industries and occupations. These labor costs represent the pay period that includes the 12th of March, June, September and December and measures total compensation, including wages and benefits.
ECI estimates are available as index numbers and percent changes. This factsheet will go into the formulas and concepts behind those numbers.
The ECI measures the cost an employer pays to compensate an employee. But the ECI publishes an index number, not a dollar amount.1 An index number shows the change in compensation costs over time relative to a base period which is set to 100.0. Base periods can change periodically when the values of indexes become significantly large, there are additions of new index series, or significant changes exist in the index series.2
Movements of the index from one date to another can be interpreted as percent changes. Beginning from a base period at 100.0, an index of 110.0 means there has been a 10-percent increase; similarly, an index of 90 means there has been a 10-percent decrease.
For example:
In December 2005, the ECI index for wages and salaries was based in at 100.0, and in December 2022 that index had grown to 155.2. An employer who paid $20.00 for wages in 2005 wants to know if their current costs for wages and salaries is matching the movement seen in the ECI. The index numbers suggest that the cost for wages in December 2022 should be 55.2 percent higher, or $31.04.
$20 * 1.552 = $31.04
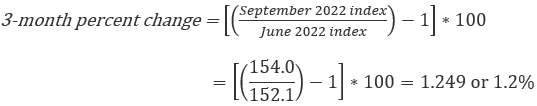
When comparing an ECI index value over time, percent changes are typically used to describe the movement from one reference period to another. Percent changes show relative changes that would not be impacted by the index size in relation to its base period. Because the ECI is released four times a year, comparing two consecutive reference periods is referred to as a 3-month percent change.
The 3-month percent change is calculated by selecting an ending month index, representing the latter month, and a beginning month index, representing the previous reference month. The formula below shows how to use the beginning and end index numbers to calculate the 3-month percent change.

For example, to find the 3-month percent change for total compensation for civilian workers in September 2022, we take the index value for both June 2022 and September 2022. The seasonally adjusted current dollar index for civilian workers’ total compensation among all occupations and industries in June and September 2022 was 152.1 and 154.0, respectively. The formula below calculates a percent change of 1.2 percent between these two periods.
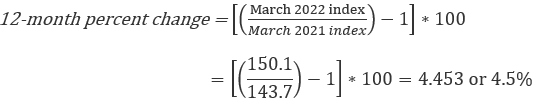
A 12-month percent change represents the employment cost changes over a 12-month period. This comparison does not look at an annual average movement; it only compares one reference period against the reference period a year ago. These two periods must always represent the same month and must have the same base period.
For example, the seasonally adjusted current dollar index for civilian workers’ total compensation among all occupations and industries between March 2021 and March 2022 was 143.7 and 150.1, respectively. The formula below calculates a 12-month percent change of 4.5 percent.
Seasonal adjustment removes the effects of seasonal events that typically follow a regular pattern each year. These patterns are either contractions or expansions of economic activity that occur during the year and impact wages and benefits. For example, state and local government wage and benefit adjustments, especially in schools, tend to occur in the September period. As seen in Chart 2 below, the not seasonally adjusted index tends to peak in September. The seasonally adjusted index anticipates this movement and results in a flatter trend line. Seasonal indexes still can show large movements, like in December 2022, where the increase in the not seasonally adjusted index was larger than expected.
At the beginning of each calendar year, seasonal factors are calculated for the coming year and revisions of historical seasonally adjusted data are made for the most recent 5 years. In some cases, series that no longer show seasonality are dropped and are retained in the historical tables. On the other hand, series are added when they show seasonality. Seasonally adjusted data is available as an index number and 3-month percent change. Seasonally adjusted data is often best utilized by economists and other researchers in order to observe cyclical and long-term changes in different sectors of the economy. See the Annual seasonal adjustment process factsheet for additional information on seasonal and non-seasonal adjustments.
Constant (real) dollar estimates are current (nominal) dollar estimates that have been adjusted by the change in consumer prices to show the real compensation cost changes. Inflation can make current wages worth less as time goes on because those same wages can buy fewer goods and less services over time. The constant dollar indexes help demonstrate a change in purchasing power.
The ECI uses the Consumer Price Index for All Urban Consumers (CPI-U), which is converted to the same index base period as the ECI. The converted (re-based) CPI-U is calculated by dividing each period's CPI-U index number by the CPI-U index number for December 2005. In this example, the CPI-U is rebased using the March 2022 estimate.
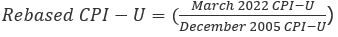
The converted CPI-U indexes for each period are then divided into the respective period's current ECI index to derive the constant dollar ECI index. For more information, see the Measuring Real Change in the ECI: Constant dollar estimates factsheet.

ECI series may occasionally be discontinued due to coding changes arising from updates to occupational and industry classification definitions. The implementation of Standard Occupational Classification (SOC) from the Occupational Classification System, and North American Industry Classification System (NAICS) from the Standard Industrial Classification (SIC) system resulted in a few discontinuous series, including blue- and white-collar occupations. For a history of classification changes, see the Reweighting and recoding factsheet.
Conversion to other base periods is used when index values from a reference base are no longer published. Converting to another base period may be required when adjusting a contract which was written to use an index with a discontinued historical base period or making a graph which shows the index values of series which have different base periods.
The ECI was rebased to 100 in December 2005. To rebase an index to December 2020, for example, simply divide the index values by the December 2020 index value.
| Reference period | Index value (December 2005 = 100) | Rebasing calculation | Index value (December 2020 = 100) |
|---|---|---|---|
|
September 2020 |
140.7 | =100 * (140.7/141.6) | 99.4 |
|
December 2020 |
141.6 | =100 * (141.6/141.6) | 100.0 |
|
March 2021 |
143.3 | =100 * (143.3/141.6) | 101.2 |
|
June 2021 |
144.4 | =100 * (144.4/141.6) | 102.0 |
For more information on the rebase to December 2005, see Changes affecting the Employment Cost Index: an overview.
The ECI uses fixed weights that account for occupation and industry among civilian, private industry and state and local government workers. Fixed weights are employment counts that remain the same over time and change when a reweight occurs. Although compensation cost information is collected for bargaining status (union/nonunion), census region and division and metropolitan areas, and series excluding incentive paid occupations, they could not be included in the sample design. Since fixed weights are not available for these series, they can’t be compared directly against aggregate industry and occupational series.
The ECI publishes data on total compensation, wages and salaries, and benefits for civilian workers, private industry workers, and state and local government workers by worker characteristics (union/nonunion or time-based pay). Geographic series are available at the national level, the fifteen largest metropolitan areas, and Census regions and divisions. Information about the industries, occupations and geographies included can be found among the North American Industry Classification System (NAICS), Standard Occupational Classification (SOC) and Classifications systems used by the National Compensation Survey pages.
To determine the appropriate index to use, consider the purpose, whether it is for contract escalation or research purposes, and identify the ownership, industry and occupation of interest.
Additional information about the ECI and the estimates produced can be found in the Handbook of Methods or Pay Measure Comparison chart.
Data can be retrieved through the database or tables for historical, seasonal revision, discontinued and News Release tables. Additional information on the ECI can be found in the ECI Publications, Monthly Labor Review, Videos and the questions and answers page.
1 For a dollar amount, visit the Employer Cost for Employee Compensation (ECEC) that produces the average cost per hour worked. See Changes affecting the Employment Cost Index: an overview for more information on why base periods change.