
An official website of the United States government
An official website of the United States government
The .gov means it's official.
Federal government websites often end in .gov or .mil. Before sharing sensitive information,
make sure you're on a federal government site.
The site is secure.
The
https:// ensures that you are connecting to the official website and that any
information you provide is encrypted and transmitted securely.
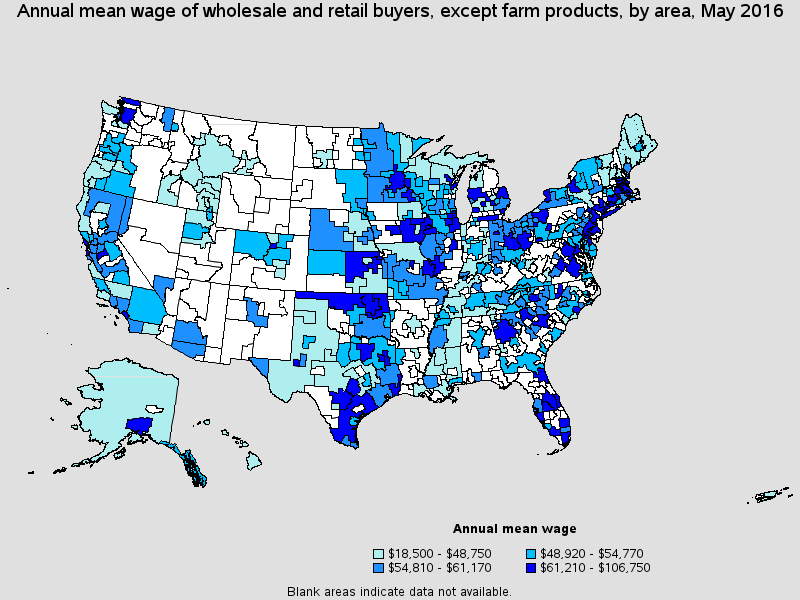
Buy merchandise or commodities, other than farm products, for resale to consumers at the wholesale or retail level, including both durable and nondurable goods. Analyze past buying trends, sales records, price, and quality of merchandise to determine value and yield. Select, order, and authorize payment for merchandise according to contractual agreements. May conduct meetings with sales personnel and introduce new products. Includes assistant wholesale and retail buyers of nonfarm products.
Employment estimate and mean wage estimates for this occupation:
| Employment (1) | Employment RSE (3) |
Mean hourly wage |
Mean annual wage (2) |
Wage RSE (3) |
|---|---|---|---|---|
| 109,440 | 1.8 % | $28.87 | $60,040 | 0.8 % |
Percentile wage estimates for this occupation:
| Percentile | 10% | 25% | 50% (Median) |
75% | 90% |
|---|---|---|---|---|---|
| Hourly Wage | $14.48 | $18.99 | $25.65 | $34.82 | $47.03 |
| Annual Wage (2) | $30,110 | $39,510 | $53,340 | $72,430 | $97,830 |
Industries with the highest published employment and wages for this occupation are provided. For a list of all industries with employment in this occupation, see the Create Customized Tables function.
Industries with the highest levels of employment in this occupation:
| Industry | Employment (1) | Percent of industry employment | Hourly mean wage | Annual mean wage (2) |
|---|---|---|---|---|
| Management of Companies and Enterprises | 18,380 | 0.80 | $33.41 | $69,500 |
| Grocery and Related Product Merchant Wholesalers | 5,510 | 0.74 | $28.16 | $58,570 |
| Wholesale Electronic Markets and Agents and Brokers | 5,350 | 0.60 | $28.90 | $60,120 |
| Electronic Shopping and Mail-Order Houses | 5,170 | 1.42 | $27.89 | $58,010 |
| Grocery Stores | 5,080 | 0.19 | $22.85 | $47,520 |
Industries with the highest concentration of employment in this occupation:
| Industry | Employment (1) | Percent of industry employment | Hourly mean wage | Annual mean wage (2) |
|---|---|---|---|---|
| Electronic Shopping and Mail-Order Houses | 5,170 | 1.42 | $27.89 | $58,010 |
| Book Stores and News Dealers | 1,050 | 1.19 | $21.46 | $44,630 |
| Paper and Paper Product Merchant Wholesalers | 1,410 | 1.18 | $29.05 | $60,430 |
| Apparel, Piece Goods, and Notions Merchant Wholesalers | 1,650 | 1.10 | $38.05 | $79,150 |
| Hardware, and Plumbing and Heating Equipment and Supplies Merchant Wholesalers | 2,410 | 0.98 | $29.33 | $61,010 |
Top paying industries for this occupation:
| Industry | Employment (1) | Percent of industry employment | Hourly mean wage | Annual mean wage (2) |
|---|---|---|---|---|
| Computer and Peripheral Equipment Manufacturing | 130 | 0.08 | $46.77 | $97,270 |
| Oil and Gas Extraction | 40 | 0.02 | $43.20 | $89,860 |
| Utility System Construction | 30 | 0.01 | $43.11 | $89,660 |
| Ship and Boat Building | 60 | 0.04 | $40.69 | $84,630 |
| Commercial and Industrial Machinery and Equipment Rental and Leasing | 70 | 0.05 | $40.59 | $84,420 |
States and areas with the highest published employment, location quotients, and wages for this occupation are provided. For a list of all areas with employment in this occupation, see the Create Customized Tables function.

States with the highest employment level in this occupation:
| State | Employment (1) | Employment per thousand jobs | Location quotient (9) | Hourly mean wage | Annual mean wage (2) |
|---|---|---|---|---|---|
| California | 18,330 | 1.15 | 1.47 | $28.51 | $59,300 |
| Texas | 9,290 | 0.79 | 1.01 | $28.33 | $58,920 |
| New York | 8,130 | 0.89 | 1.15 | $34.65 | $72,070 |
| Ohio | 4,340 | 0.81 | 1.04 | $29.03 | $60,390 |
| Illinois | 4,010 | 0.68 | 0.87 | $31.11 | $64,700 |
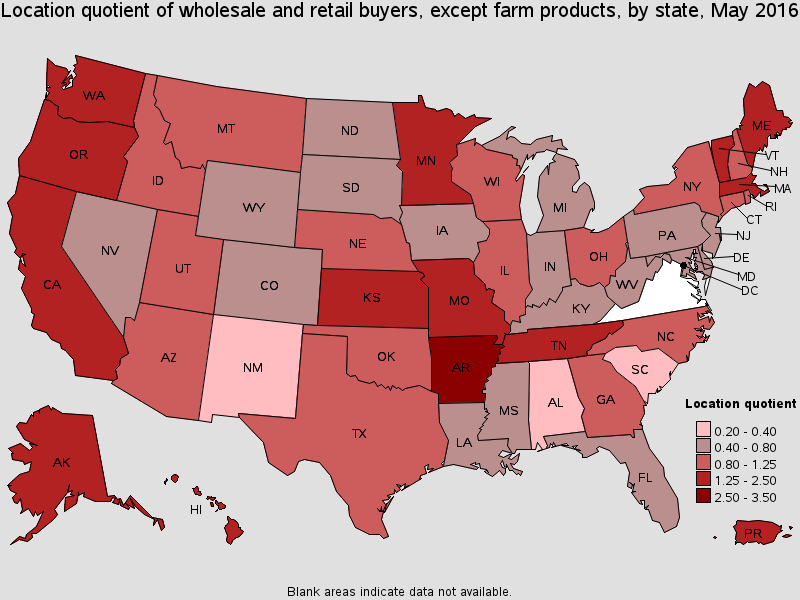
States with the highest concentration of jobs and location quotients in this occupation:
| State | Employment (1) | Employment per thousand jobs | Location quotient (9) | Hourly mean wage | Annual mean wage (2) |
|---|---|---|---|---|---|
| Arkansas | 3,080 | 2.58 | 3.31 | (8) | (8) |
| Maine | 840 | 1.41 | 1.80 | $26.25 | $54,600 |
| Oregon | 2,410 | 1.35 | 1.73 | $24.93 | $51,850 |
| Vermont | 400 | 1.32 | 1.69 | $21.73 | $45,200 |
| Minnesota | 3,650 | 1.30 | 1.66 | $31.83 | $66,200 |
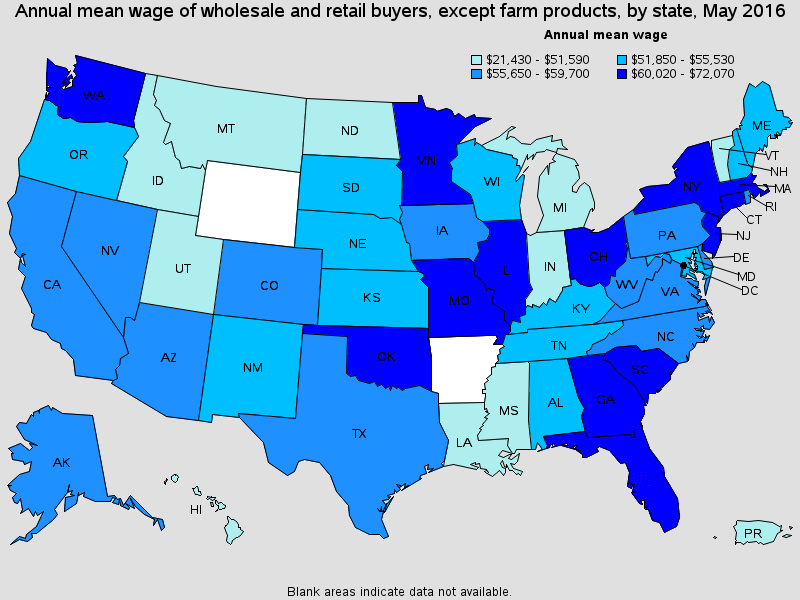
Top paying States for this occupation:
| State | Employment (1) | Employment per thousand jobs | Location quotient (9) | Hourly mean wage | Annual mean wage (2) |
|---|---|---|---|---|---|
| New York | 8,130 | 0.89 | 1.15 | $34.65 | $72,070 |
| New Jersey | 2,120 | 0.54 | 0.69 | $33.17 | $69,000 |
| Minnesota | 3,650 | 1.30 | 1.66 | $31.83 | $66,200 |
| Connecticut | 1,150 | 0.69 | 0.89 | $31.78 | $66,110 |
| Massachusetts | 3,550 | 1.03 | 1.32 | $31.72 | $65,990 |
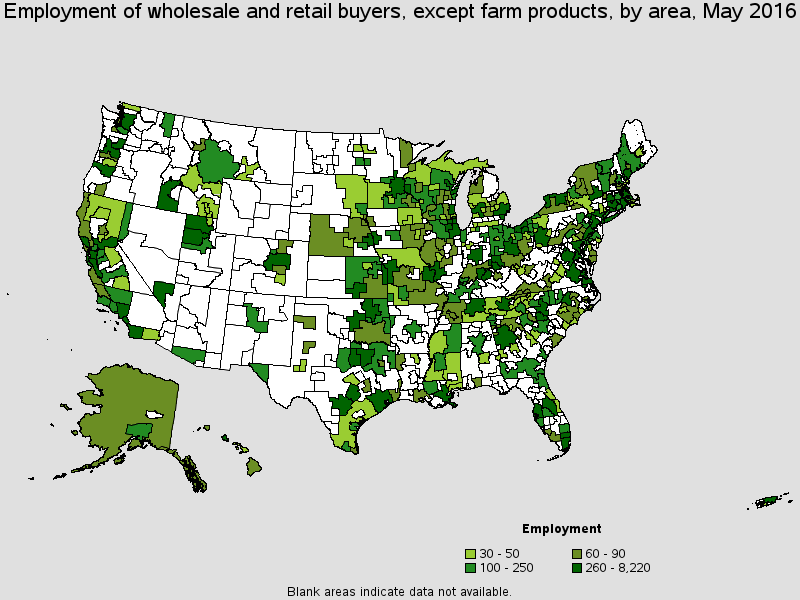
Metropolitan areas with the highest employment level in this occupation:
| Metropolitan area | Employment (1) | Employment per thousand jobs | Location quotient (9) | Hourly mean wage | Annual mean wage (2) |
|---|---|---|---|---|---|
| Los Angeles-Long Beach-Glendale, CA Metropolitan Division | 6,440 | 1.53 | 1.96 | $27.92 | $58,070 |
| New York-Jersey City-White Plains, NY-NJ Metropolitan Division | 6,210 | 0.94 | 1.21 | $36.98 | $76,910 |
| Minneapolis-St. Paul-Bloomington, MN-WI | 2,960 | 1.55 | 1.99 | $32.84 | $68,310 |
| Chicago-Naperville-Arlington Heights, IL Metropolitan Division | 2,560 | 0.70 | 0.90 | $32.30 | $67,170 |
| Seattle-Bellevue-Everett, WA Metropolitan Division | 2,540 | 1.60 | 2.05 | $31.04 | $64,570 |
| Houston-The Woodlands-Sugar Land, TX | 2,510 | 0.85 | 1.10 | $28.02 | $58,280 |
| Dallas-Plano-Irving, TX Metropolitan Division | 2,450 | 1.01 | 1.30 | $29.74 | $61,850 |
| Atlanta-Sandy Springs-Roswell, GA | 1,920 | 0.75 | 0.97 | $33.15 | $68,960 |
| Portland-Vancouver-Hillsboro, OR-WA | 1,830 | 1.61 | 2.07 | $26.00 | $54,080 |
| Anaheim-Santa Ana-Irvine, CA Metropolitan Division | 1,780 | 1.14 | 1.46 | $35.22 | $73,260 |
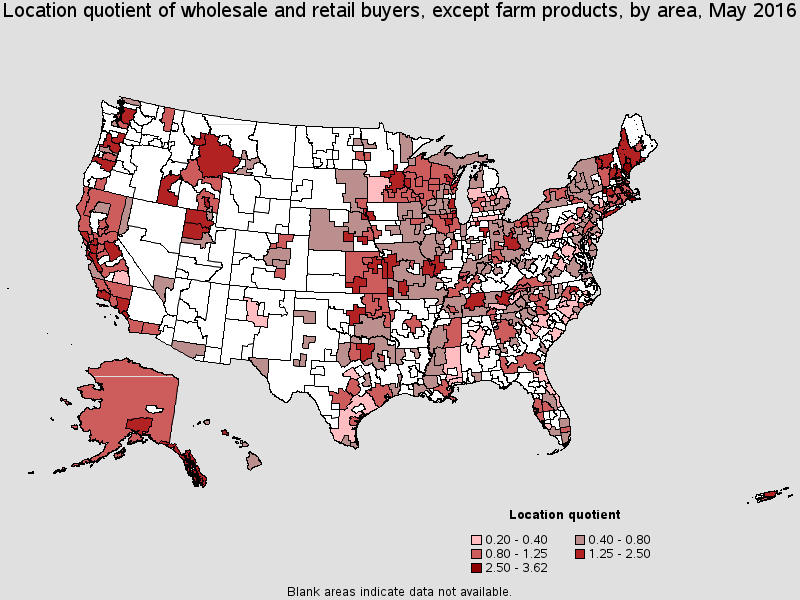
Metropolitan areas with the highest concentration of jobs and location quotients in this occupation:
| Metropolitan area | Employment (1) | Employment per thousand jobs | Location quotient (9) | Hourly mean wage | Annual mean wage (2) |
|---|---|---|---|---|---|
| Joplin, MO | 210 | 2.77 | 3.55 | $18.72 | $38,930 |
| Portland-South Portland, ME | 500 | 2.50 | 3.21 | $29.24 | $60,820 |
| Framingham, MA NECTA Division | 370 | 2.14 | 2.74 | $31.29 | $65,090 |
| Pittsfield, MA | 90 | 2.13 | 2.73 | $26.23 | $54,550 |
| Taunton-Middleborough-Norton, MA NECTA Division | 110 | 1.97 | 2.52 | $33.63 | $69,950 |
| Eugene, OR | 270 | 1.84 | 2.36 | $22.84 | $47,510 |
| Green Bay, WI | 300 | 1.73 | 2.23 | $30.89 | $64,240 |
| Knoxville, TN | 640 | 1.67 | 2.14 | $26.98 | $56,120 |
| Santa Rosa, CA | 310 | 1.62 | 2.07 | $24.63 | $51,230 |
| Portland-Vancouver-Hillsboro, OR-WA | 1,830 | 1.61 | 2.07 | $26.00 | $54,080 |
Top paying metropolitan areas for this occupation:
| Metropolitan area | Employment (1) | Employment per thousand jobs | Location quotient (9) | Hourly mean wage | Annual mean wage (2) |
|---|---|---|---|---|---|
| Dutchess County-Putnam County, NY Metropolitan Division | 30 | 0.22 | 0.28 | $51.32 | $106,750 |
| Odessa, TX | 30 | 0.46 | 0.59 | $41.42 | $86,150 |
| Peabody-Salem-Beverly, MA NECTA Division | 70 | 0.73 | 0.93 | $41.33 | $85,970 |
| Boulder, CO | 160 | 0.89 | 1.14 | $40.59 | $84,420 |
| Miami-Miami Beach-Kendall, FL Metropolitan Division | 510 | 0.45 | 0.58 | $39.78 | $82,740 |
| Lakeland-Winter Haven, FL | 160 | 0.77 | 0.99 | $37.43 | $77,850 |
| New York-Jersey City-White Plains, NY-NJ Metropolitan Division | 6,210 | 0.94 | 1.21 | $36.98 | $76,910 |
| West Palm Beach-Boca Raton-Delray Beach, FL Metropolitan Division | 250 | 0.42 | 0.54 | $36.44 | $75,800 |
| Trenton, NJ | (8) | (8) | (8) | $35.96 | $74,800 |
| North Port-Sarasota-Bradenton, FL | 200 | 0.72 | 0.92 | $35.83 | $74,530 |
Nonmetropolitan areas with the highest employment in this occupation:
| Nonmetropolitan area | Employment (1) | Employment per thousand jobs | Location quotient (9) | Hourly mean wage | Annual mean wage (2) |
|---|---|---|---|---|---|
| Southwest Maine nonmetropolitan area | 200 | 1.05 | 1.35 | $22.28 | $46,330 |
| Northeast Mississippi nonmetropolitan area | 160 | 0.68 | 0.87 | $23.21 | $48,280 |
| North Northeastern Ohio non-metropolitan area (non-contiguous) | 140 | 0.43 | 0.55 | $27.46 | $57,110 |
| Southwest Montana nonmetropolitan area | 140 | 1.05 | 1.34 | $23.30 | $48,470 |
| South Georgia nonmetropolitan area | 140 | 0.74 | 0.95 | $25.19 | $52,390 |
Nonmetropolitan areas with the highest concentration of jobs and location quotients in this occupation:
| Nonmetropolitan area | Employment (1) | Employment per thousand jobs | Location quotient (9) | Hourly mean wage | Annual mean wage (2) |
|---|---|---|---|---|---|
| Nantucket Island and Martha's Vineyard nonmetropolitan area | 50 | 2.83 | 3.62 | $26.67 | $55,480 |
| Southeast Alaska nonmetropolitan area | 70 | 1.93 | 2.48 | $25.81 | $53,690 |
| Northern Vermont nonmetropolitan area | 120 | 1.65 | 2.12 | $19.75 | $41,080 |
| Central New Hampshire nonmetropolitan area | 130 | 1.37 | 1.75 | $21.59 | $44,900 |
| Mother Lode Region of California nonmetropolitan area | 50 | 1.33 | 1.70 | $24.79 | $51,570 |
Top paying nonmetropolitan areas for this occupation:
| Nonmetropolitan area | Employment (1) | Employment per thousand jobs | Location quotient (9) | Hourly mean wage | Annual mean wage (2) |
|---|---|---|---|---|---|
| Northwest Oklahoma nonmetropolitan area | (8) | (8) | (8) | $40.94 | $85,160 |
| Southeast Iowa nonmetropolitan area | 70 | 0.32 | 0.41 | $35.01 | $72,820 |
| Western Pennsylvania nonmetropolitan area | 50 | 0.34 | 0.43 | $32.15 | $66,870 |
| Northeast Kansas nonmetropolitan area | 120 | 0.84 | 1.07 | $30.93 | $64,330 |
| Northeast Oklahoma nonmetropolitan area | 100 | 0.84 | 1.08 | $30.43 | $63,290 |
These estimates are calculated with data collected from employers in all industry sectors, all metropolitan and nonmetropolitan areas, and all states and the District of Columbia. The top employment and wage figures are provided above. The complete list is available in the downloadable XLS files.
The percentile wage estimate is the value of a wage below which a certain percent of workers fall. The median wage is the 50th percentile wage estimate--50 percent of workers earn less than the median and 50 percent of workers earn more than the median. More about percentile wages.
(1) Estimates for detailed occupations do not sum to the totals because the totals include occupations not shown separately. Estimates do not include self-employed workers.
(2) Annual wages have been calculated by multiplying the hourly mean wage by a "year-round, full-time" hours figure of 2,080 hours; for those occupations where there is not an hourly wage published, the annual wage has been directly calculated from the reported survey data.
(3) The relative standard error (RSE) is a measure of the reliability of a survey statistic. The smaller the relative standard error, the more precise the estimate.
(8) Estimate not released.
(9) The location quotient is the ratio of the area concentration of occupational employment to the national average concentration. A location quotient greater than one indicates the occupation has a higher share of employment than average, and a location quotient less than one indicates the occupation is less prevalent in the area than average.
Other OES estimates and related information:
May 2016 National Occupational Employment and Wage Estimates
May 2016 State Occupational Employment and Wage Estimates
May 2016 Metropolitan and Nonmetropolitan Area Occupational Employment and Wage Estimates
May 2016 National Industry-Specific Occupational Employment and Wage Estimates
Last Modified Date: March 31, 2017