
An official website of the United States government
An official website of the United States government
The .gov means it's official.
Federal government websites often end in .gov or .mil. Before sharing sensitive information,
make sure you're on a federal government site.
The site is secure.
The
https:// ensures that you are connecting to the official website and that any
information you provide is encrypted and transmitted securely.
Coordinate activities of staff, convention personnel, or clients to make arrangements for group meetings, events, or conventions.
Employment estimate and mean wage estimates for this occupation:
| Employment (1) | Employment RSE (3) |
Mean hourly wage |
Mean annual wage (2) |
Wage RSE (3) |
|---|---|---|---|---|
| 95,850 | 1.5 % | $25.01 | $52,020 | 0.9 % |
Percentile wage estimates for this occupation:
| Percentile | 10% | 25% | 50% (Median) |
75% | 90% |
|---|---|---|---|---|---|
| Hourly Wage | $12.34 | $16.72 | $22.76 | $30.36 | $39.92 |
| Annual Wage (2) | $25,670 | $34,790 | $47,350 | $63,140 | $83,030 |
Industries with the highest published employment and wages for this occupation are provided. For a list of all industries with employment in this occupation, see the Create Customized Tables function.
Industries with the highest levels of employment in this occupation:
| Industry | Employment (1) | Percent of industry employment | Hourly mean wage | Annual mean wage (2) |
|---|---|---|---|---|
| Business, Professional, Labor, Political, and Similar Organizations | 9,230 | 2.15 | $28.31 | $58,880 |
| Traveler Accommodation | 9,210 | 0.48 | $23.65 | $49,190 |
| Other Support Services | 7,370 | 2.41 | $27.16 | $56,490 |
| Colleges, Universities, and Professional Schools | 5,730 | 0.19 | $24.54 | $51,050 |
| Promoters of Performing Arts, Sports, and Similar Events | 5,380 | 4.11 | $22.38 | $46,560 |
Industries with the highest concentration of employment in this occupation:
| Industry | Employment (1) | Percent of industry employment | Hourly mean wage | Annual mean wage (2) |
|---|---|---|---|---|
| Promoters of Performing Arts, Sports, and Similar Events | 5,380 | 4.11 | $22.38 | $46,560 |
| Other Support Services | 7,370 | 2.41 | $27.16 | $56,490 |
| Business, Professional, Labor, Political, and Similar Organizations | 9,230 | 2.15 | $28.31 | $58,880 |
| Grantmaking and Giving Services | 2,200 | 1.58 | $26.04 | $54,150 |
| Museums, Historical Sites, and Similar Institutions | 2,190 | 1.40 | $20.99 | $43,660 |
Top paying industries for this occupation:
| Industry | Employment (1) | Percent of industry employment | Hourly mean wage | Annual mean wage (2) |
|---|---|---|---|---|
| Aerospace Product and Parts Manufacturing | 130 | 0.03 | $39.80 | $82,770 |
| Semiconductor and Other Electronic Component Manufacturing | 30 | 0.01 | $38.24 | $79,530 |
| Securities and Commodity Contracts Intermediation and Brokerage | 340 | 0.08 | $36.46 | $75,840 |
| Activities Related to Credit Intermediation | 70 | 0.02 | $35.57 | $73,990 |
| Navigational, Measuring, Electromedical, and Control Instruments Manufacturing | 160 | 0.04 | $34.97 | $72,740 |
States and areas with the highest published employment, location quotients, and wages for this occupation are provided. For a list of all areas with employment in this occupation, see the Create Customized Tables function.
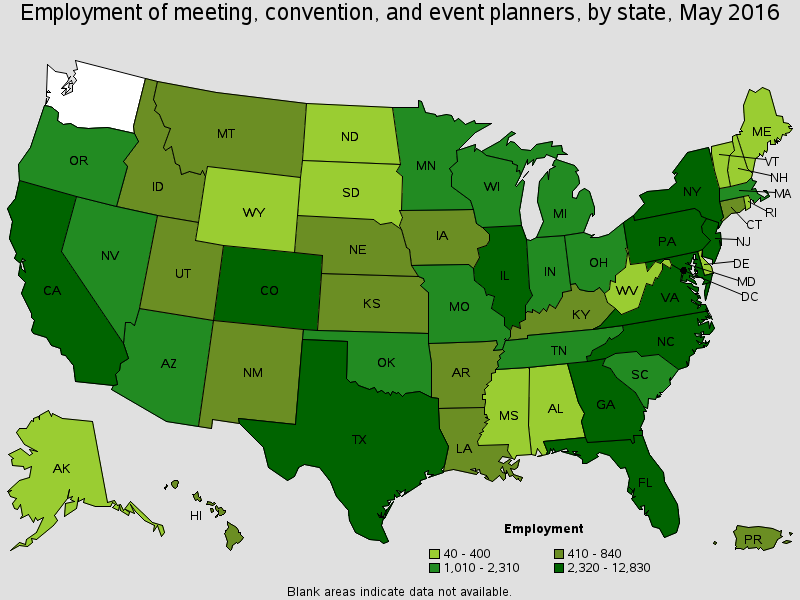
States with the highest employment level in this occupation:
| State | Employment (1) | Employment per thousand jobs | Location quotient (9) | Hourly mean wage | Annual mean wage (2) |
|---|---|---|---|---|---|
| California | 12,830 | 0.80 | 1.18 | $26.64 | $55,400 |
| New York | 9,160 | 1.01 | 1.47 | $30.95 | $64,370 |
| Texas | 7,000 | 0.60 | 0.87 | $26.28 | $54,660 |
| Florida | 6,470 | 0.79 | 1.15 | $22.24 | $46,260 |
| Illinois | 4,220 | 0.71 | 1.05 | $25.09 | $52,180 |
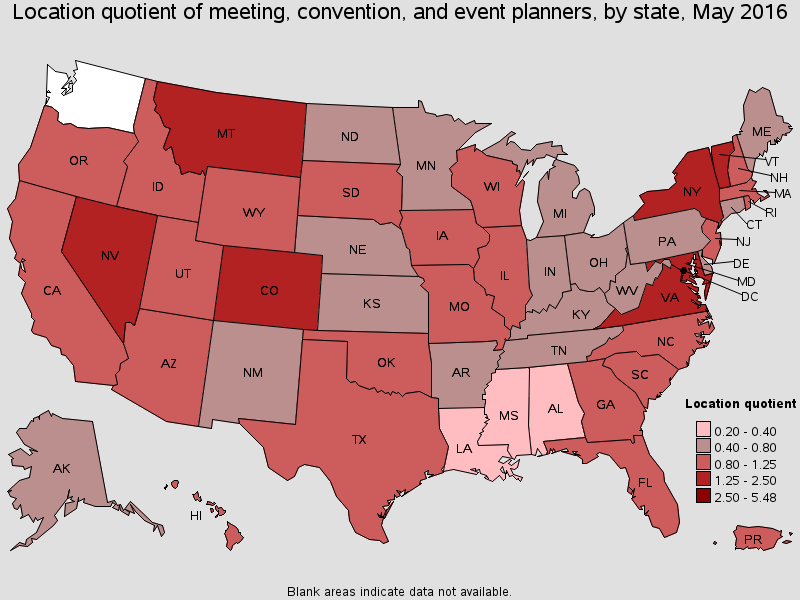
States with the highest concentration of jobs and location quotients in this occupation:
| State | Employment (1) | Employment per thousand jobs | Location quotient (9) | Hourly mean wage | Annual mean wage (2) |
|---|---|---|---|---|---|
| District of Columbia | 2,630 | 3.74 | 5.48 | $33.61 | $69,910 |
| Colorado | 2,880 | 1.15 | 1.68 | $21.59 | $44,910 |
| Maryland | 2,850 | 1.08 | 1.58 | $26.26 | $54,620 |
| Virginia | 3,900 | 1.04 | 1.52 | $28.25 | $58,760 |
| New York | 9,160 | 1.01 | 1.47 | $30.95 | $64,370 |
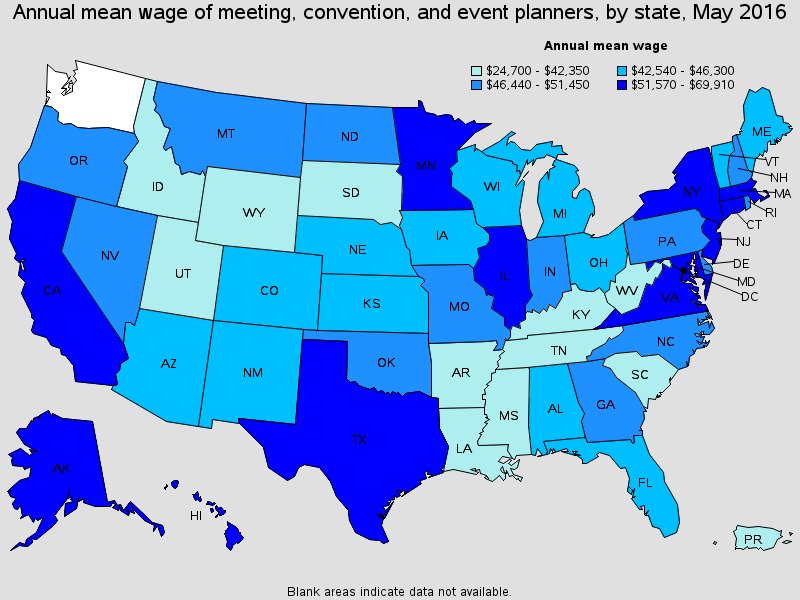
Top paying States for this occupation:
| State | Employment (1) | Employment per thousand jobs | Location quotient (9) | Hourly mean wage | Annual mean wage (2) |
|---|---|---|---|---|---|
| District of Columbia | 2,630 | 3.74 | 5.48 | $33.61 | $69,910 |
| New York | 9,160 | 1.01 | 1.47 | $30.95 | $64,370 |
| Connecticut | 700 | 0.42 | 0.61 | $29.94 | $62,270 |
| New Jersey | 2,760 | 0.70 | 1.02 | $29.73 | $61,830 |
| Massachusetts | 2,310 | 0.67 | 0.98 | $29.01 | $60,340 |
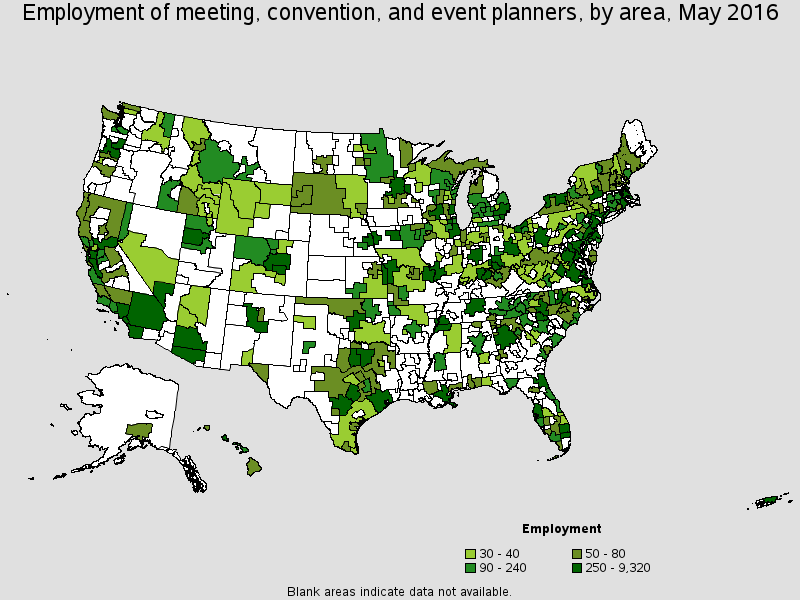
Metropolitan areas with the highest employment level in this occupation:
| Metropolitan area | Employment (1) | Employment per thousand jobs | Location quotient (9) | Hourly mean wage | Annual mean wage (2) |
|---|---|---|---|---|---|
| New York-Jersey City-White Plains, NY-NJ Metropolitan Division | 7,650 | 1.16 | 1.70 | $32.69 | $68,000 |
| Washington-Arlington-Alexandria, DC-VA-MD-WV Metropolitan Division | 5,280 | 2.12 | 3.11 | $32.26 | $67,110 |
| Los Angeles-Long Beach-Glendale, CA Metropolitan Division | 3,590 | 0.85 | 1.25 | $24.54 | $51,040 |
| Chicago-Naperville-Arlington Heights, IL Metropolitan Division | 3,100 | 0.85 | 1.25 | $26.35 | $54,810 |
| Dallas-Plano-Irving, TX Metropolitan Division | 1,960 | 0.81 | 1.18 | $32.52 | $67,640 |
| Denver-Aurora-Lakewood, CO | 1,890 | 1.34 | 1.96 | $21.12 | $43,920 |
| Atlanta-Sandy Springs-Roswell, GA | 1,880 | 0.73 | 1.08 | $24.76 | $51,510 |
| Anaheim-Santa Ana-Irvine, CA Metropolitan Division | 1,780 | 1.14 | 1.67 | $26.27 | $54,640 |
| Houston-The Woodlands-Sugar Land, TX | 1,720 | 0.59 | 0.86 | $23.67 | $49,240 |
| San Francisco-Redwood City-South San Francisco, CA Metropolitan Division | 1,630 | 1.53 | 2.24 | $33.84 | $70,390 |
Metropolitan areas with the highest concentration of jobs and location quotients in this occupation:
| Metropolitan area | Employment (1) | Employment per thousand jobs | Location quotient (9) | Hourly mean wage | Annual mean wage (2) |
|---|---|---|---|---|---|
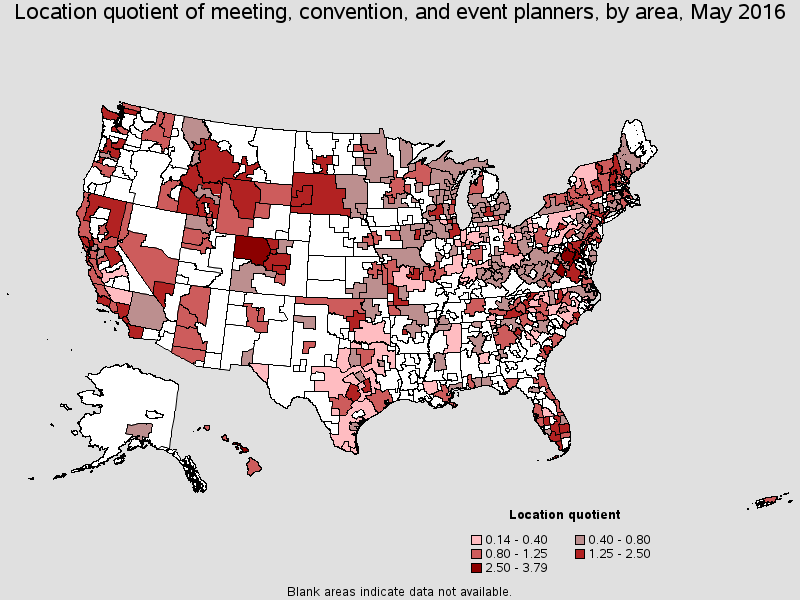
| Napa, CA | 180 | 2.58 | 3.79 | $27.38 | $56,940 |
| Charlottesville, VA | 260 | 2.41 | 3.54 | $22.63 | $47,060 |
| Washington-Arlington-Alexandria, DC-VA-MD-WV Metropolitan Division | 5,280 | 2.12 | 3.11 | $32.26 | $67,110 |
| Kahului-Wailuku-Lahaina, HI | 140 | 1.98 | 2.90 | $26.54 | $55,200 |
| State College, PA | 110 | 1.62 | 2.38 | $24.87 | $51,730 |
| San Francisco-Redwood City-South San Francisco, CA Metropolitan Division | 1,630 | 1.53 | 2.24 | $33.84 | $70,390 |
| Silver Spring-Frederick-Rockville, MD Metropolitan Division | 880 | 1.52 | 2.23 | $28.52 | $59,320 |
| Iowa City, IA | 130 | 1.45 | 2.12 | $19.36 | $40,280 |
| Atlantic City-Hammonton, NJ | 170 | 1.35 | 1.98 | $25.10 | $52,220 |
| Denver-Aurora-Lakewood, CO | 1,890 | 1.34 | 1.96 | $21.12 | $43,920 |
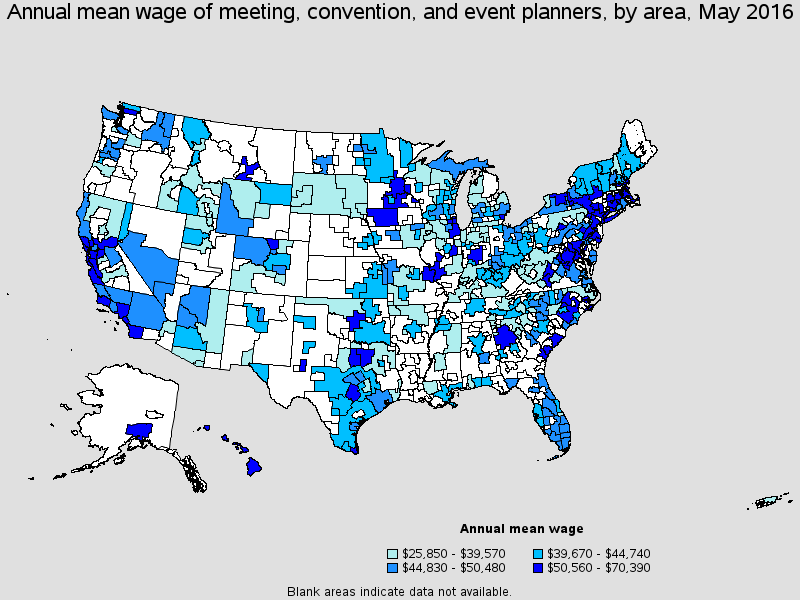
Top paying metropolitan areas for this occupation:
| Metropolitan area | Employment (1) | Employment per thousand jobs | Location quotient (9) | Hourly mean wage | Annual mean wage (2) |
|---|---|---|---|---|---|
| San Francisco-Redwood City-South San Francisco, CA Metropolitan Division | 1,630 | 1.53 | 2.24 | $33.84 | $70,390 |
| Bridgeport-Stamford-Norwalk, CT | 230 | 0.55 | 0.80 | $33.69 | $70,070 |
| Newark, NJ-PA Metropolitan Division | 650 | 0.56 | 0.82 | $33.05 | $68,740 |
| New York-Jersey City-White Plains, NY-NJ Metropolitan Division | 7,650 | 1.16 | 1.70 | $32.69 | $68,000 |
| Dallas-Plano-Irving, TX Metropolitan Division | 1,960 | 0.81 | 1.18 | $32.52 | $67,640 |
| San Jose-Sunnyvale-Santa Clara, CA | 610 | 0.59 | 0.86 | $32.38 | $67,350 |
| Washington-Arlington-Alexandria, DC-VA-MD-WV Metropolitan Division | 5,280 | 2.12 | 3.11 | $32.26 | $67,110 |
| Dutchess County-Putnam County, NY Metropolitan Division | 70 | 0.47 | 0.69 | $32.06 | $66,690 |
| San Rafael, CA Metropolitan Division | 80 | 0.74 | 1.09 | $31.95 | $66,460 |
| Framingham, MA NECTA Division | 100 | 0.56 | 0.82 | $31.74 | $66,020 |
Nonmetropolitan areas with the highest employment in this occupation:
| Nonmetropolitan area | Employment (1) | Employment per thousand jobs | Location quotient (9) | Hourly mean wage | Annual mean wage (2) |
|---|---|---|---|---|---|
| Northwest Colorado nonmetropolitan area | 200 | 1.74 | 2.55 | $22.26 | $46,300 |
| Southwest Montana nonmetropolitan area | 160 | 1.23 | 1.81 | (8) | (8) |
| Mountain North Carolina nonmetropolitan area | 160 | 1.27 | 1.87 | $21.35 | $44,410 |
| Southeast Iowa nonmetropolitan area | 110 | 0.47 | 0.68 | $16.73 | $34,790 |
| Northeastern Wisconsin nonmetropolitan area | 100 | 0.49 | 0.71 | $16.31 | $33,920 |
Nonmetropolitan areas with the highest concentration of jobs and location quotients in this occupation:
| Nonmetropolitan area | Employment (1) | Employment per thousand jobs | Location quotient (9) | Hourly mean wage | Annual mean wage (2) |
|---|---|---|---|---|---|
| Northwest Colorado nonmetropolitan area | 200 | 1.74 | 2.55 | $22.26 | $46,300 |
| Southwest New Hampshire nonmetropolitan area | 50 | 1.31 | 1.92 | $18.99 | $39,500 |
| Mother Lode Region of California nonmetropolitan area | 50 | 1.29 | 1.89 | $22.74 | $47,310 |
| Mountain North Carolina nonmetropolitan area | 160 | 1.27 | 1.87 | $21.35 | $44,410 |
| Northern Mountains Region of California nonmetropolitan area | 80 | 1.23 | 1.80 | $17.01 | $35,380 |
Top paying nonmetropolitan areas for this occupation:
| Nonmetropolitan area | Employment (1) | Employment per thousand jobs | Location quotient (9) | Hourly mean wage | Annual mean wage (2) |
|---|---|---|---|---|---|
| Northwest Virginia nonmetropolitan area | 30 | 0.51 | 0.75 | $28.01 | $58,260 |
| Central New York nonmetropolitan area | 80 | 0.63 | 0.92 | $26.81 | $55,760 |
| Northwest Iowa nonmetropolitan area | (8) | (8) | (8) | $26.18 | $54,440 |
| Hawaii / Kauai nonmetropolitan area | 80 | 0.78 | 1.15 | $26.02 | $54,130 |
| Southeast Coastal North Carolina nonmetropolitan area | 60 | 0.22 | 0.33 | $25.29 | $52,600 |
These estimates are calculated with data collected from employers in all industry sectors, all metropolitan and nonmetropolitan areas, and all states and the District of Columbia. The top employment and wage figures are provided above. The complete list is available in the downloadable XLS files.
The percentile wage estimate is the value of a wage below which a certain percent of workers fall. The median wage is the 50th percentile wage estimate--50 percent of workers earn less than the median and 50 percent of workers earn more than the median. More about percentile wages.
(1) Estimates for detailed occupations do not sum to the totals because the totals include occupations not shown separately. Estimates do not include self-employed workers.
(2) Annual wages have been calculated by multiplying the hourly mean wage by a "year-round, full-time" hours figure of 2,080 hours; for those occupations where there is not an hourly wage published, the annual wage has been directly calculated from the reported survey data.
(3) The relative standard error (RSE) is a measure of the reliability of a survey statistic. The smaller the relative standard error, the more precise the estimate.
(8) Estimate not released.
(9) The location quotient is the ratio of the area concentration of occupational employment to the national average concentration. A location quotient greater than one indicates the occupation has a higher share of employment than average, and a location quotient less than one indicates the occupation is less prevalent in the area than average.
Other OES estimates and related information:
May 2016 National Occupational Employment and Wage Estimates
May 2016 State Occupational Employment and Wage Estimates
May 2016 Metropolitan and Nonmetropolitan Area Occupational Employment and Wage Estimates
May 2016 National Industry-Specific Occupational Employment and Wage Estimates
Last Modified Date: March 31, 2017