
An official website of the United States government
An official website of the United States government
The .gov means it's official.
Federal government websites often end in .gov or .mil. Before sharing sensitive information,
make sure you're on a federal government site.
The site is secure.
The
https:// ensures that you are connecting to the official website and that any
information you provide is encrypted and transmitted securely.
Prepare detailed drawings of architectural and structural features of buildings or drawings and topographical relief maps used in civil engineering projects, such as highways, bridges, and public works. Use knowledge of building materials, engineering practices, and mathematics to complete drawings.
Employment estimate and mean wage estimates for this occupation:
| Employment (1) | Employment RSE (3) |
Mean hourly wage |
Mean annual wage (2) |
Wage RSE (3) |
|---|---|---|---|---|
| 96,810 | 1.6 % | $26.10 | $54,290 | 0.5 % |
Percentile wage estimates for this occupation:
| Percentile | 10% | 25% | 50% (Median) |
75% | 90% |
|---|---|---|---|---|---|
| Hourly Wage | $16.14 | $19.89 | $24.83 | $30.52 | $37.87 |
| Annual Wage (2) | $33,570 | $41,370 | $51,640 | $63,480 | $78,770 |
Industries with the highest published employment and wages for this occupation are provided. For a list of all industries with employment in this occupation, see the Create Customized Tables function.
Industries with the highest levels of employment in this occupation:
| Industry | Employment (1) | Percent of industry employment | Hourly mean wage | Annual mean wage (2) |
|---|---|---|---|---|
| Architectural, Engineering, and Related Services | 71,830 | 5.13 | $25.81 | $53,680 |
| Residential Building Construction | 3,010 | 0.42 | $24.85 | $51,690 |
| Nonresidential Building Construction | 2,650 | 0.35 | $28.17 | $58,580 |
| Local Government (OES Designation) | 1,880 | 0.03 | $29.70 | $61,770 |
| Architectural and Structural Metals Manufacturing | 1,640 | 0.44 | $25.63 | $53,300 |
Industries with the highest concentration of employment in this occupation:
| Industry | Employment (1) | Percent of industry employment | Hourly mean wage | Annual mean wage (2) |
|---|---|---|---|---|
| Architectural, Engineering, and Related Services | 71,830 | 5.13 | $25.81 | $53,680 |
| Veneer, Plywood, and Engineered Wood Product Manufacturing | 960 | 1.27 | $23.15 | $48,150 |
| Specialized Design Services | 680 | 0.49 | $25.61 | $53,260 |
| Office Furniture (including Fixtures) Manufacturing | 490 | 0.45 | $25.78 | $53,620 |
| Architectural and Structural Metals Manufacturing | 1,640 | 0.44 | $25.63 | $53,300 |
Top paying industries for this occupation:
| Industry | Employment (1) | Percent of industry employment | Hourly mean wage | Annual mean wage (2) |
|---|---|---|---|---|
| Other Electrical Equipment and Component Manufacturing | 40 | 0.03 | $36.80 | $76,550 |
| Electric Power Generation, Transmission and Distribution | 190 | 0.05 | $31.32 | $65,150 |
| Natural Gas Distribution | 200 | 0.18 | $31.16 | $64,810 |
| Other Professional, Scientific, and Technical Services | 80 | 0.01 | $30.38 | $63,200 |
| Local Government (OES Designation) | 1,880 | 0.03 | $29.70 | $61,770 |
States and areas with the highest published employment, location quotients, and wages for this occupation are provided. For a list of all areas with employment in this occupation, see the Create Customized Tables function.
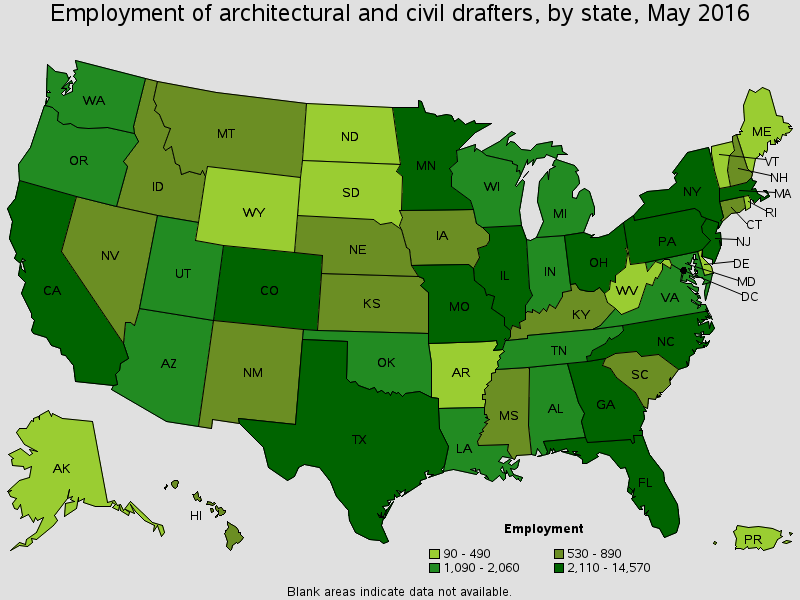
States with the highest employment level in this occupation:
| State | Employment (1) | Employment per thousand jobs | Location quotient (9) | Hourly mean wage | Annual mean wage (2) |
|---|---|---|---|---|---|
| California | 14,570 | 0.91 | 1.32 | $28.66 | $59,610 |
| Texas | 11,700 | 1.00 | 1.44 | $28.09 | $58,420 |
| New York | 6,210 | 0.68 | 0.99 | $27.21 | $56,600 |
| Florida | 6,160 | 0.75 | 1.09 | $23.77 | $49,440 |
| Pennsylvania | 4,910 | 0.85 | 1.24 | $25.62 | $53,290 |
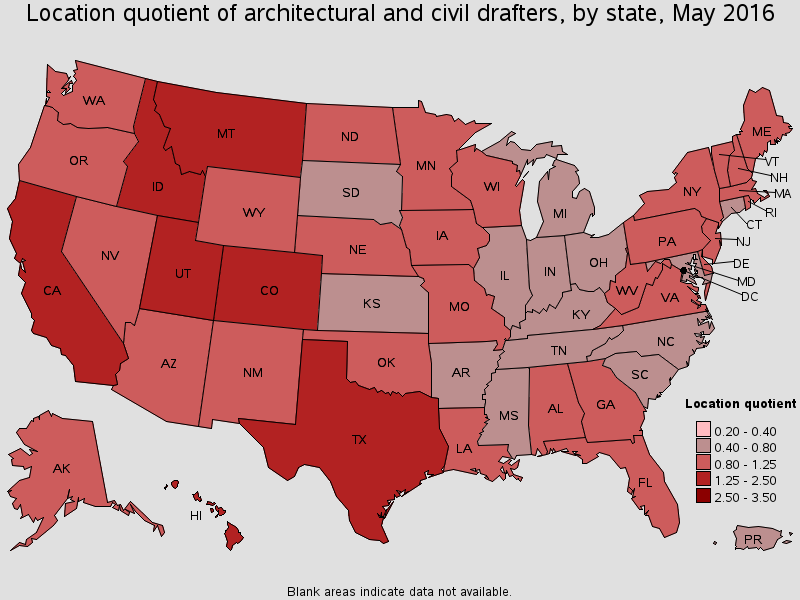
States with the highest concentration of jobs and location quotients in this occupation:
| State | Employment (1) | Employment per thousand jobs | Location quotient (9) | Hourly mean wage | Annual mean wage (2) |
|---|---|---|---|---|---|
| Montana | 600 | 1.32 | 1.92 | $22.24 | $46,260 |
| Utah | 1,710 | 1.24 | 1.80 | $24.61 | $51,200 |
| Texas | 11,700 | 1.00 | 1.44 | $28.09 | $58,420 |
| Idaho | 660 | 1.00 | 1.45 | $22.87 | $47,580 |
| Colorado | 2,400 | 0.96 | 1.39 | $26.16 | $54,410 |
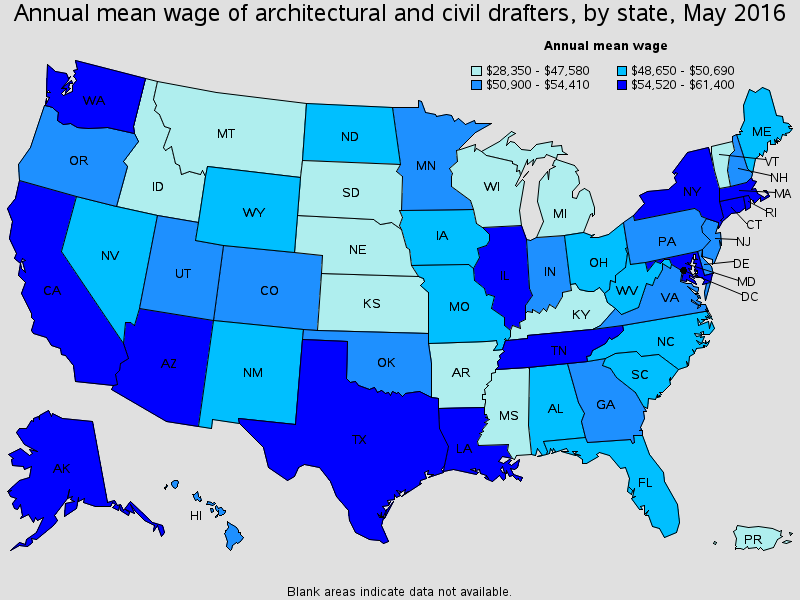
Top paying States for this occupation:
| State | Employment (1) | Employment per thousand jobs | Location quotient (9) | Hourly mean wage | Annual mean wage (2) |
|---|---|---|---|---|---|
| Connecticut | 850 | 0.51 | 0.74 | $29.52 | $61,400 |
| Alaska | 200 | 0.63 | 0.91 | $29.45 | $61,250 |
| Maryland | 1,110 | 0.42 | 0.61 | $28.89 | $60,080 |
| California | 14,570 | 0.91 | 1.32 | $28.66 | $59,610 |
| Louisiana | 1,150 | 0.60 | 0.86 | $28.37 | $59,000 |
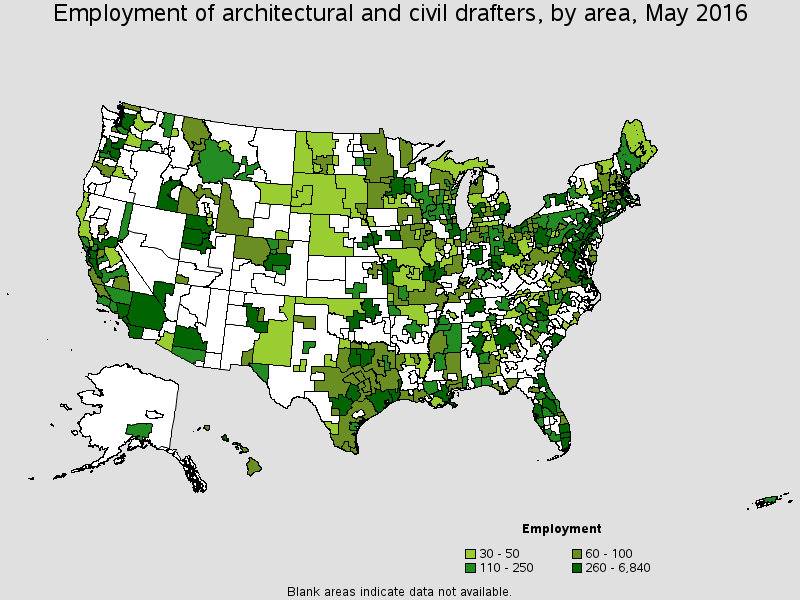
Metropolitan areas with the highest employment level in this occupation:
| Metropolitan area | Employment (1) | Employment per thousand jobs | Location quotient (9) | Hourly mean wage | Annual mean wage (2) |
|---|---|---|---|---|---|
| New York-Jersey City-White Plains, NY-NJ Metropolitan Division | 4,900 | 0.74 | 1.08 | $27.77 | $57,750 |
| Houston-The Woodlands-Sugar Land, TX | 4,320 | 1.47 | 2.14 | $32.39 | $67,370 |
| Los Angeles-Long Beach-Glendale, CA Metropolitan Division | 3,810 | 0.90 | 1.31 | $29.67 | $61,720 |
| Dallas-Plano-Irving, TX Metropolitan Division | 2,240 | 0.92 | 1.34 | $26.82 | $55,780 |
| Atlanta-Sandy Springs-Roswell, GA | 2,160 | 0.85 | 1.23 | $26.19 | $54,480 |
| Chicago-Naperville-Arlington Heights, IL Metropolitan Division | 1,910 | 0.53 | 0.76 | $27.19 | $56,560 |
| Minneapolis-St. Paul-Bloomington, MN-WI | 1,820 | 0.95 | 1.38 | $26.05 | $54,190 |
| Anaheim-Santa Ana-Irvine, CA Metropolitan Division | 1,770 | 1.13 | 1.64 | $28.87 | $60,050 |
| Boston-Cambridge-Newton, MA NECTA Division | 1,700 | 0.94 | 1.36 | $27.81 | $57,840 |
| Denver-Aurora-Lakewood, CO | 1,610 | 1.14 | 1.65 | $26.46 | $55,050 |
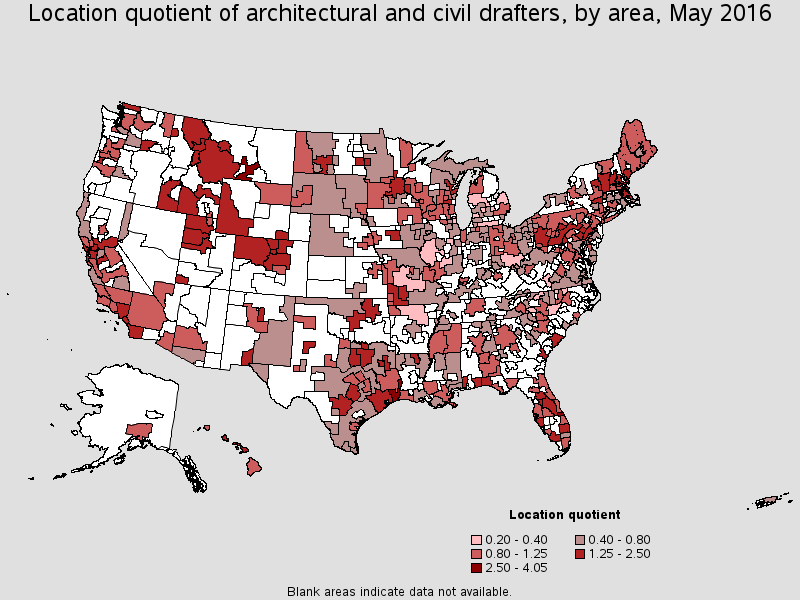
Metropolitan areas with the highest concentration of jobs and location quotients in this occupation:
| Metropolitan area | Employment (1) | Employment per thousand jobs | Location quotient (9) | Hourly mean wage | Annual mean wage (2) |
|---|---|---|---|---|---|
| Beaumont-Port Arthur, TX | 450 | 2.80 | 4.05 | $38.13 | $79,310 |
| Billings, MT | 200 | 2.28 | 3.31 | $23.98 | $49,870 |
| Sebastian-Vero Beach, FL | 90 | 1.93 | 2.81 | $22.72 | $47,260 |
| Chambersburg-Waynesboro, PA | 100 | 1.67 | 2.42 | $24.02 | $49,950 |
| San Rafael, CA Metropolitan Division | 180 | 1.58 | 2.29 | $24.86 | $51,700 |
| Santa Fe, NM | 90 | 1.53 | 2.22 | $26.76 | $55,660 |
| San Francisco-Redwood City-South San Francisco, CA Metropolitan Division | 1,580 | 1.48 | 2.14 | $31.04 | $64,560 |
| Houston-The Woodlands-Sugar Land, TX | 4,320 | 1.47 | 2.14 | $32.39 | $67,370 |
| Salt Lake City, UT | 970 | 1.43 | 2.07 | $25.83 | $53,720 |
| Ocala, FL | 140 | 1.41 | 2.04 | $17.67 | $36,760 |
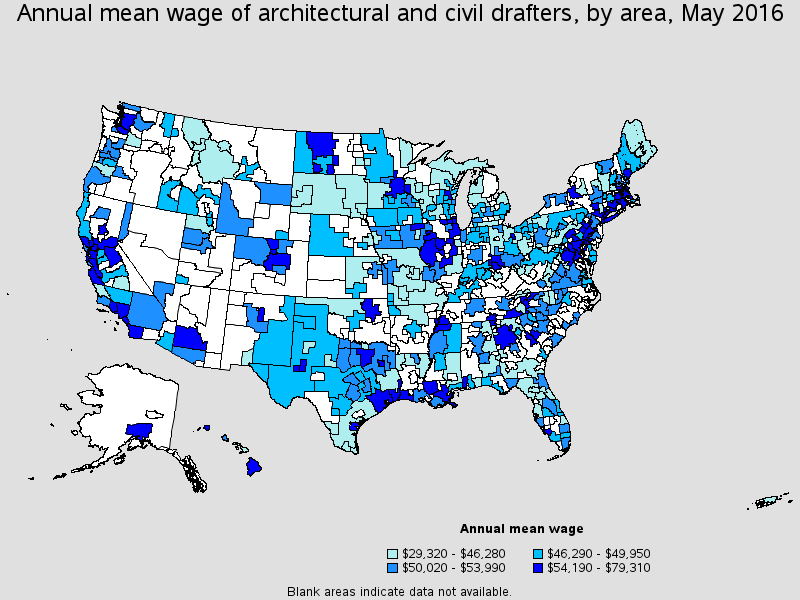
Top paying metropolitan areas for this occupation:
| Metropolitan area | Employment (1) | Employment per thousand jobs | Location quotient (9) | Hourly mean wage | Annual mean wage (2) |
|---|---|---|---|---|---|
| Beaumont-Port Arthur, TX | 450 | 2.80 | 4.05 | $38.13 | $79,310 |
| Framingham, MA NECTA Division | 160 | 0.92 | 1.34 | $34.68 | $72,140 |
| Davenport-Moline-Rock Island, IA-IL | 60 | 0.32 | 0.47 | $33.21 | $69,070 |
| Houston-The Woodlands-Sugar Land, TX | 4,320 | 1.47 | 2.14 | $32.39 | $67,370 |
| Trenton, NJ | 210 | 0.95 | 1.37 | $32.39 | $67,360 |
| Santa Rosa, CA | 120 | 0.59 | 0.86 | $31.92 | $66,380 |
| Napa, CA | 50 | 0.74 | 1.07 | $31.57 | $65,680 |
| Midland, TX | 50 | 0.54 | 0.79 | $31.10 | $64,680 |
| San Francisco-Redwood City-South San Francisco, CA Metropolitan Division | 1,580 | 1.48 | 2.14 | $31.04 | $64,560 |
| Baton Rouge, LA | 250 | 0.64 | 0.92 | $31.01 | $64,490 |
Nonmetropolitan areas with the highest employment in this occupation:
| Nonmetropolitan area | Employment (1) | Employment per thousand jobs | Location quotient (9) | Hourly mean wage | Annual mean wage (2) |
|---|---|---|---|---|---|
| Southern Pennsylvania nonmetropolitan area | 210 | 1.14 | 1.65 | $22.21 | $46,200 |
| Southwest Montana nonmetropolitan area | 190 | 1.46 | 2.11 | $21.82 | $45,380 |
| Southwest Maine nonmetropolitan area | 150 | 0.77 | 1.12 | $22.44 | $46,680 |
| Northeast Mississippi nonmetropolitan area | 150 | 0.63 | 0.92 | $23.54 | $48,970 |
| West Northwestern Ohio nonmetropolitan area | 140 | 0.55 | 0.80 | $22.10 | $45,960 |
Nonmetropolitan areas with the highest concentration of jobs and location quotients in this occupation:
| Nonmetropolitan area | Employment (1) | Employment per thousand jobs | Location quotient (9) | Hourly mean wage | Annual mean wage (2) |
|---|---|---|---|---|---|
| Southwest Montana nonmetropolitan area | 190 | 1.46 | 2.11 | $21.82 | $45,380 |
| Southern Pennsylvania nonmetropolitan area | 210 | 1.14 | 1.65 | $22.21 | $46,200 |
| West Montana nonmetropolitan area | 80 | 1.05 | 1.53 | $19.03 | $39,590 |
| Southwest Missouri nonmetropolitan area | 70 | 1.02 | 1.48 | $21.88 | $45,500 |
| Southwest Wyoming nonmetropolitan area | 60 | 0.97 | 1.41 | $25.04 | $52,090 |
Top paying nonmetropolitan areas for this occupation:
| Nonmetropolitan area | Employment (1) | Employment per thousand jobs | Location quotient (9) | Hourly mean wage | Annual mean wage (2) |
|---|---|---|---|---|---|
| Mountain North Carolina nonmetropolitan area | 40 | 0.33 | 0.48 | $30.73 | $63,930 |
| West Central Illinois nonmetropolitan area | 30 | 0.17 | 0.25 | $30.67 | $63,780 |
| Mother Lode Region of California nonmetropolitan area | 30 | 0.78 | 1.13 | $29.05 | $60,420 |
| West Central North Dakota nonmetropolitan area | 30 | 0.53 | 0.78 | $27.40 | $56,990 |
| Hawaii / Kauai nonmetropolitan area | 60 | 0.60 | 0.87 | $26.05 | $54,190 |
These estimates are calculated with data collected from employers in all industry sectors, all metropolitan and nonmetropolitan areas, and all states and the District of Columbia. The top employment and wage figures are provided above. The complete list is available in the downloadable XLS files.
The percentile wage estimate is the value of a wage below which a certain percent of workers fall. The median wage is the 50th percentile wage estimate--50 percent of workers earn less than the median and 50 percent of workers earn more than the median. More about percentile wages.
(1) Estimates for detailed occupations do not sum to the totals because the totals include occupations not shown separately. Estimates do not include self-employed workers.
(2) Annual wages have been calculated by multiplying the hourly mean wage by a "year-round, full-time" hours figure of 2,080 hours; for those occupations where there is not an hourly wage published, the annual wage has been directly calculated from the reported survey data.
(3) The relative standard error (RSE) is a measure of the reliability of a survey statistic. The smaller the relative standard error, the more precise the estimate.
(9) The location quotient is the ratio of the area concentration of occupational employment to the national average concentration. A location quotient greater than one indicates the occupation has a higher share of employment than average, and a location quotient less than one indicates the occupation is less prevalent in the area than average.
Other OES estimates and related information:
May 2016 National Occupational Employment and Wage Estimates
May 2016 State Occupational Employment and Wage Estimates
May 2016 Metropolitan and Nonmetropolitan Area Occupational Employment and Wage Estimates
May 2016 National Industry-Specific Occupational Employment and Wage Estimates
Last Modified Date: March 31, 2017