
An official website of the United States government
An official website of the United States government
The .gov means it's official.
Federal government websites often end in .gov or .mil. Before sharing sensitive information,
make sure you're on a federal government site.
The site is secure.
The
https:// ensures that you are connecting to the official website and that any
information you provide is encrypted and transmitted securely.
This major group comprises the following occupations: Lawyers ; Judicial Law Clerks ; Administrative Law Judges, Adjudicators, and Hearing Officers ; Arbitrators, Mediators, and Conciliators ; Judges, Magistrate Judges, and Magistrates ; Paralegals and Legal Assistants ; Court Reporters ; Title Examiners, Abstractors, and Searchers ; Legal Support Workers, All Other
Employment estimate and mean wage estimates for this major group:
| Employment (1) | Employment RSE (3) |
Mean hourly wage |
Mean annual wage (2) |
Wage RSE (3) |
|---|---|---|---|---|
| 1,075,520 | 0.5 % | $50.95 | $105,980 | 0.6 % |
Percentile wage estimates for this major group:
| Percentile | 10% | 25% | 50% (Median) |
75% | 90% |
|---|---|---|---|---|---|
| Hourly Wage | $17.62 | $24.78 | $38.30 | $66.46 | (5) |
| Annual Wage (2) | $36,650 | $51,530 | $79,650 | $138,240 | (5) |
Industries with the highest published employment and wages for this occupation are provided. For a list of all industries with employment in this occupation, see the Create Customized Tables function.
Industries with the highest levels of employment in this occupation:
| Industry | Employment (1) | Percent of industry employment | Hourly mean wage | Annual mean wage (2) |
|---|---|---|---|---|
| Legal Services | 630,400 | 56.14 | $52.08 | $108,320 |
| Local Government (OES Designation) | 101,550 | 1.89 | $40.77 | $84,810 |
| State Government (OES Designation) | 90,690 | 4.15 | $42.10 | $87,560 |
| Federal Executive Branch (OES Designation) | 71,560 | 3.54 | $53.23 | $110,720 |
| Insurance Carriers | 29,170 | 2.50 | $42.62 | $88,640 |
Industries with the highest concentration of employment in this occupation:
| Industry | Employment (1) | Percent of industry employment | Hourly mean wage | Annual mean wage (2) |
|---|---|---|---|---|
| Legal Services | 630,400 | 56.14 | $52.08 | $108,320 |
| State Government (OES Designation) | 90,690 | 4.15 | $42.10 | $87,560 |
| Federal Executive Branch (OES Designation) | 71,560 | 3.54 | $53.23 | $110,720 |
| Oil and Gas Extraction | 5,700 | 3.14 | $58.07 | $120,790 |
| Insurance Carriers | 29,170 | 2.50 | $42.62 | $88,640 |
Top paying industries for this occupation:
| Industry | Employment (1) | Percent of industry employment | Hourly mean wage | Annual mean wage (2) |
|---|---|---|---|---|
| Securities and Commodity Exchanges | 110 | 2.41 | $88.07 | $183,190 |
| Scheduled Air Transportation | 130 | 0.03 | $85.21 | $177,230 |
| Waste Treatment and Disposal | 60 | 0.06 | $84.45 | $175,660 |
| Beer, Wine, and Distilled Alcoholic Beverage Merchant Wholesalers | 60 | 0.03 | $84.11 | $174,950 |
| Semiconductor and Other Electronic Component Manufacturing | 720 | 0.19 | $83.33 | $173,330 |
States and areas with the highest published employment, location quotients, and wages for this occupation are provided. For a list of all areas with employment in this occupation, see the Create Customized Tables function.
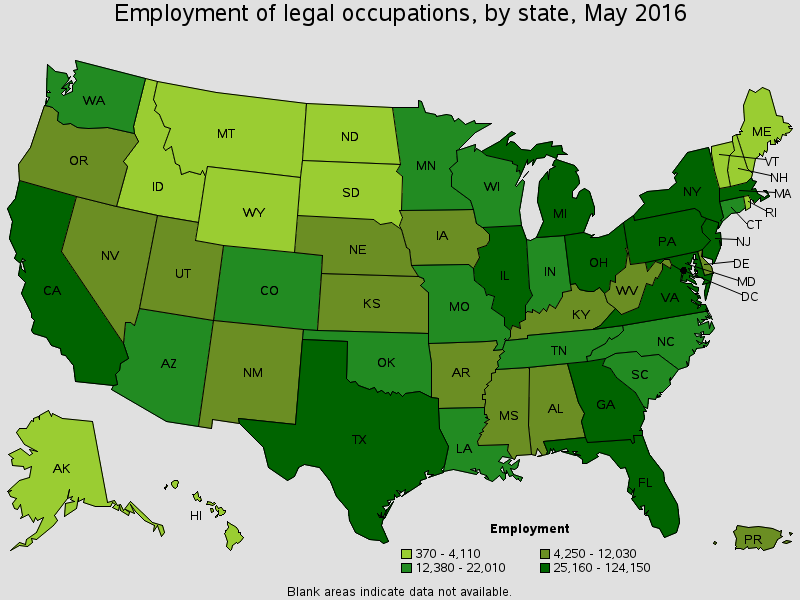
States with the highest employment level in this occupation:
| State | Employment (1) | Employment per thousand jobs | Location quotient (9) | Hourly mean wage | Annual mean wage (2) |
|---|---|---|---|---|---|
| California | 124,150 | 7.78 | 1.02 | $60.17 | $125,150 |
| New York | 108,300 | 11.90 | 1.55 | $63.35 | $131,770 |
| Florida | 84,040 | 10.22 | 1.33 | $46.82 | $97,390 |
| Texas | 83,070 | 7.07 | 0.92 | $51.78 | $107,700 |
| Illinois | 44,870 | 7.60 | 0.99 | $50.57 | $105,180 |
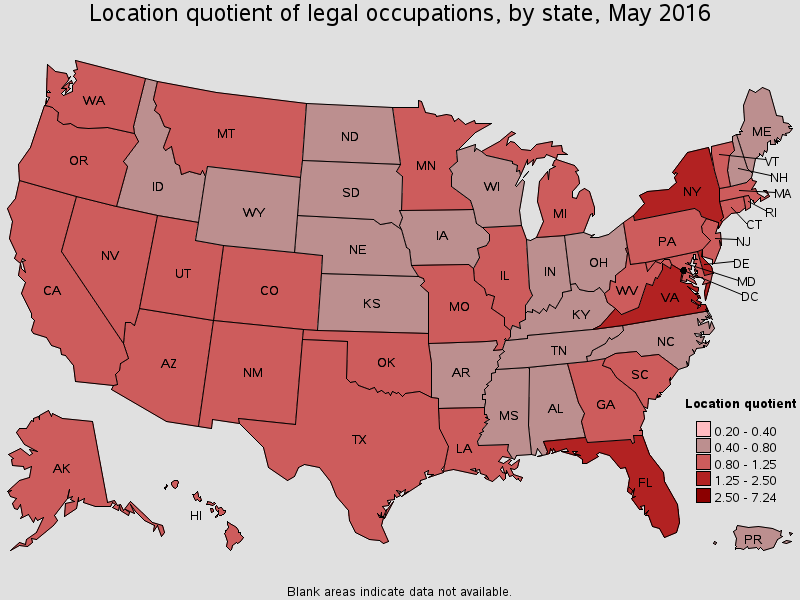
States with the highest concentration of jobs and location quotients in this occupation:
| State | Employment (1) | Employment per thousand jobs | Location quotient (9) | Hourly mean wage | Annual mean wage (2) |
|---|---|---|---|---|---|
| District of Columbia | 38,960 | 55.46 | 7.24 | $78.23 | $162,710 |
| New York | 108,300 | 11.90 | 1.55 | $63.35 | $131,770 |
| Delaware | 4,950 | 11.23 | 1.47 | $52.94 | $110,120 |
| Florida | 84,040 | 10.22 | 1.33 | $46.82 | $97,390 |
| Virginia | 36,160 | 9.62 | 1.26 | $50.88 | $105,840 |
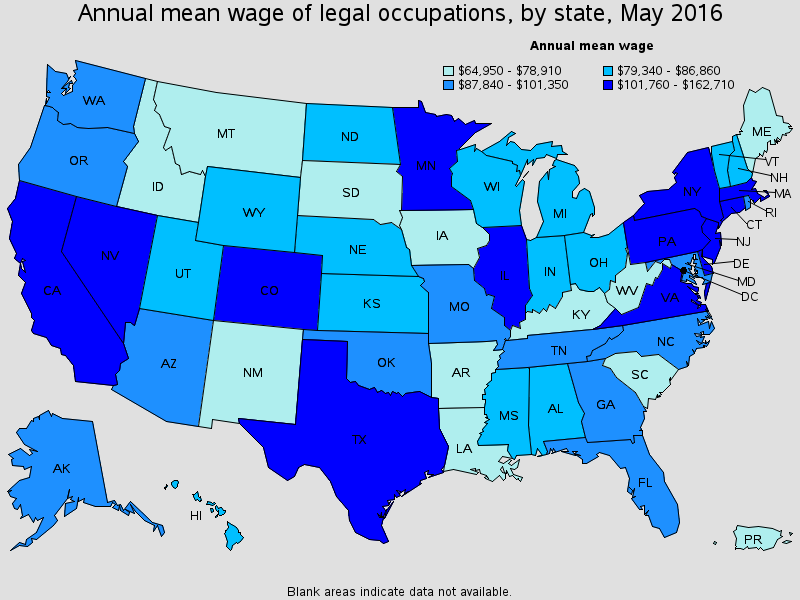
Top paying States for this occupation:
| State | Employment (1) | Employment per thousand jobs | Location quotient (9) | Hourly mean wage | Annual mean wage (2) |
|---|---|---|---|---|---|
| District of Columbia | 38,960 | 55.46 | 7.24 | $78.23 | $162,710 |
| New York | 108,300 | 11.90 | 1.55 | $63.35 | $131,770 |
| California | 124,150 | 7.78 | 1.02 | $60.17 | $125,150 |
| Massachusetts | 29,200 | 8.44 | 1.10 | $58.81 | $122,330 |
| New Jersey | 32,290 | 8.16 | 1.07 | $54.85 | $114,100 |
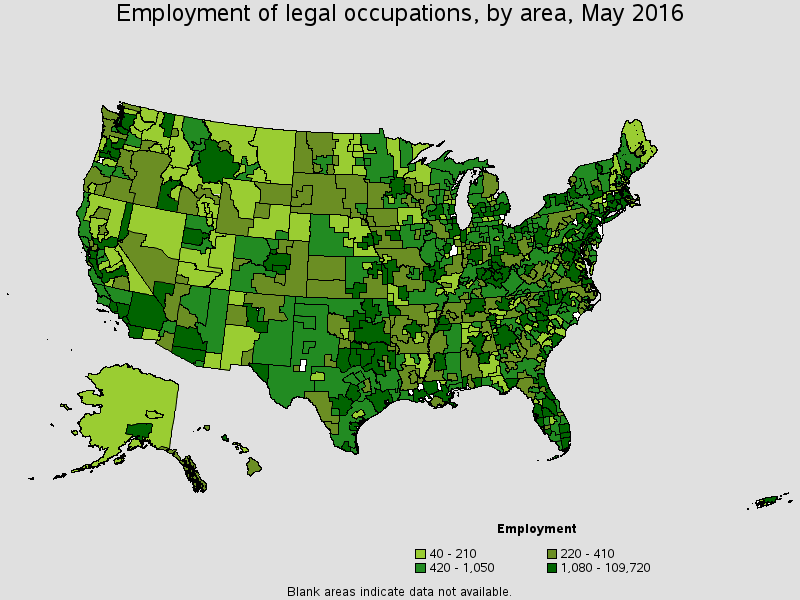
Metropolitan areas with the highest employment level in this occupation:
| Metropolitan area | Employment (1) | Employment per thousand jobs | Location quotient (9) | Hourly mean wage | Annual mean wage (2) |
|---|---|---|---|---|---|
| New York-Jersey City-White Plains, NY-NJ Metropolitan Division | 82,860 | 12.58 | 1.64 | $69.42 | $144,400 |
| Washington-Arlington-Alexandria, DC-VA-MD-WV Metropolitan Division | 62,290 | 25.01 | 3.26 | $69.52 | $144,610 |
| Los Angeles-Long Beach-Glendale, CA Metropolitan Division | 39,040 | 9.25 | 1.21 | $61.83 | $128,600 |
| Chicago-Naperville-Arlington Heights, IL Metropolitan Division | 33,830 | 9.30 | 1.21 | $52.75 | $109,720 |
| Houston-The Woodlands-Sugar Land, TX | 23,610 | 8.05 | 1.05 | $60.87 | $126,620 |
| Atlanta-Sandy Springs-Roswell, GA | 22,310 | 8.74 | 1.14 | $52.74 | $109,690 |
| Boston-Cambridge-Newton, MA NECTA Division | 22,170 | 12.30 | 1.61 | $63.16 | $131,360 |
| Dallas-Plano-Irving, TX Metropolitan Division | 18,990 | 7.82 | 1.02 | $59.50 | $123,750 |
| Miami-Miami Beach-Kendall, FL Metropolitan Division | 16,930 | 15.04 | 1.96 | $48.44 | $100,750 |
| San Francisco-Redwood City-South San Francisco, CA Metropolitan Division | 15,700 | 14.72 | 1.92 | $75.71 | $157,480 |
Metropolitan areas with the highest concentration of jobs and location quotients in this occupation:
| Metropolitan area | Employment (1) | Employment per thousand jobs | Location quotient (9) | Hourly mean wage | Annual mean wage (2) |
|---|---|---|---|---|---|
| Washington-Arlington-Alexandria, DC-VA-MD-WV Metropolitan Division | 62,290 | 25.01 | 3.26 | $69.52 | $144,610 |
| Tallahassee, FL | 3,330 | 20.31 | 2.65 | $40.33 | $83,880 |
| Philadelphia, PA Metropolitan Division | 15,630 | 17.55 | 2.29 | $54.47 | $113,290 |
| Charleston, WV | 1,800 | 15.83 | 2.07 | $39.61 | $82,400 |
| Miami-Miami Beach-Kendall, FL Metropolitan Division | 16,930 | 15.04 | 1.96 | $48.44 | $100,750 |
| San Francisco-Redwood City-South San Francisco, CA Metropolitan Division | 15,700 | 14.72 | 1.92 | $75.71 | $157,480 |
| Bloomington, IL | 1,300 | 14.43 | 1.88 | $46.33 | $96,360 |
| West Palm Beach-Boca Raton-Delray Beach, FL Metropolitan Division | 8,310 | 14.10 | 1.84 | $44.49 | $92,540 |
| Santa Fe, NM | 820 | 13.31 | 1.74 | $36.45 | $75,820 |
| Carson City, NV | 370 | 13.24 | 1.73 | $44.99 | $93,570 |
Top paying metropolitan areas for this occupation:
| Metropolitan area | Employment (1) | Employment per thousand jobs | Location quotient (9) | Hourly mean wage | Annual mean wage (2) |
|---|---|---|---|---|---|
| San Francisco-Redwood City-South San Francisco, CA Metropolitan Division | 15,700 | 14.72 | 1.92 | $75.71 | $157,480 |
| San Jose-Sunnyvale-Santa Clara, CA | 7,790 | 7.45 | 0.97 | $75.53 | $157,100 |
| Washington-Arlington-Alexandria, DC-VA-MD-WV Metropolitan Division | 62,290 | 25.01 | 3.26 | $69.52 | $144,610 |
| New York-Jersey City-White Plains, NY-NJ Metropolitan Division | 82,860 | 12.58 | 1.64 | $69.42 | $144,400 |
| San Rafael, CA Metropolitan Division | 780 | 6.97 | 0.91 | $68.93 | $143,380 |
| Bridgeport-Stamford-Norwalk, CT | 4,010 | 9.57 | 1.25 | $67.66 | $140,730 |
| Boston-Cambridge-Newton, MA NECTA Division | 22,170 | 12.30 | 1.61 | $63.16 | $131,360 |
| Oxnard-Thousand Oaks-Ventura, CA | 1,820 | 6.06 | 0.79 | $62.78 | $130,590 |
| Los Angeles-Long Beach-Glendale, CA Metropolitan Division | 39,040 | 9.25 | 1.21 | $61.83 | $128,600 |
| Houston-The Woodlands-Sugar Land, TX | 23,610 | 8.05 | 1.05 | $60.87 | $126,620 |
Nonmetropolitan areas with the highest employment in this occupation:
| Nonmetropolitan area | Employment (1) | Employment per thousand jobs | Location quotient (9) | Hourly mean wage | Annual mean wage (2) |
|---|---|---|---|---|---|
| Central Kentucky nonmetropolitan area | 1,210 | 6.65 | 0.87 | $27.94 | $58,110 |
| Southeast Oklahoma nonmetropolitan area | 1,170 | 6.92 | 0.90 | $39.97 | $83,140 |
| Southwest Montana nonmetropolitan area | 1,150 | 8.75 | 1.14 | $31.30 | $65,110 |
| North Texas nonmetropolitan area | 1,080 | 4.04 | 0.53 | $34.84 | $72,480 |
| Hill Country Region of Texas nonmetropolitan area | 1,000 | 5.18 | 0.68 | $28.58 | $59,450 |
Nonmetropolitan areas with the highest concentration of jobs and location quotients in this occupation:
| Nonmetropolitan area | Employment (1) | Employment per thousand jobs | Location quotient (9) | Hourly mean wage | Annual mean wage (2) |
|---|---|---|---|---|---|
| Central New Hampshire nonmetropolitan area | 870 | 8.97 | 1.17 | $36.65 | $76,240 |
| Southwest Montana nonmetropolitan area | 1,150 | 8.75 | 1.14 | $31.30 | $65,110 |
| Upper Eastern Shore of Maryland nonmetropolitan area | 370 | 7.78 | 1.02 | $37.32 | $77,620 |
| East Kentucky nonmetropolitan area | 730 | 7.14 | 0.93 | $34.92 | $72,630 |
| Southeast Oklahoma nonmetropolitan area | 1,170 | 6.92 | 0.90 | $39.97 | $83,140 |
Top paying nonmetropolitan areas for this occupation:
| Nonmetropolitan area | Employment (1) | Employment per thousand jobs | Location quotient (9) | Hourly mean wage | Annual mean wage (2) |
|---|---|---|---|---|---|
| Los Alamos County, New Mexico nonmetropolitan area | (8) | (8) | (8) | $66.50 | $138,320 |
| East Central New York nonmetropolitan area | 200 | 5.81 | 0.76 | $54.00 | $112,330 |
| Capital/Northern New York nonmetropolitan area | 640 | 4.44 | 0.58 | $50.73 | $105,510 |
| Southeast Alaska nonmetropolitan area | 220 | 6.21 | 0.81 | $50.48 | $105,000 |
| Northern Mountains Region of California nonmetropolitan area | 170 | 2.72 | 0.35 | $49.94 | $103,870 |
These estimates are calculated with data collected from employers in all industry sectors, all metropolitan and nonmetropolitan areas, and all states and the District of Columbia.
The percentile wage estimate is the value of a wage below which a certain percent of workers fall. The median wage is the 50th percentile wage estimate--50 percent of workers earn less than the median and 50 percent of workers earn more than the median. More about percentile wages.
(1) Estimates for detailed occupations do not sum to the totals because the totals include occupations not shown separately. Estimates do not include self-employed workers.
(2) Annual wages have been calculated by multiplying the hourly mean wage by a "year-round, full-time" hours figure of 2,080 hours; for those occupations where there is not an hourly wage published, the annual wage has been directly calculated from the reported survey data.
(3) The relative standard error (RSE) is a measure of the reliability of a survey statistic. The smaller the relative standard error, the more precise the estimate.
(5) This wage is equal to or greater than $100.00 per hour or $208,000 per year.
(8) Estimate not released.
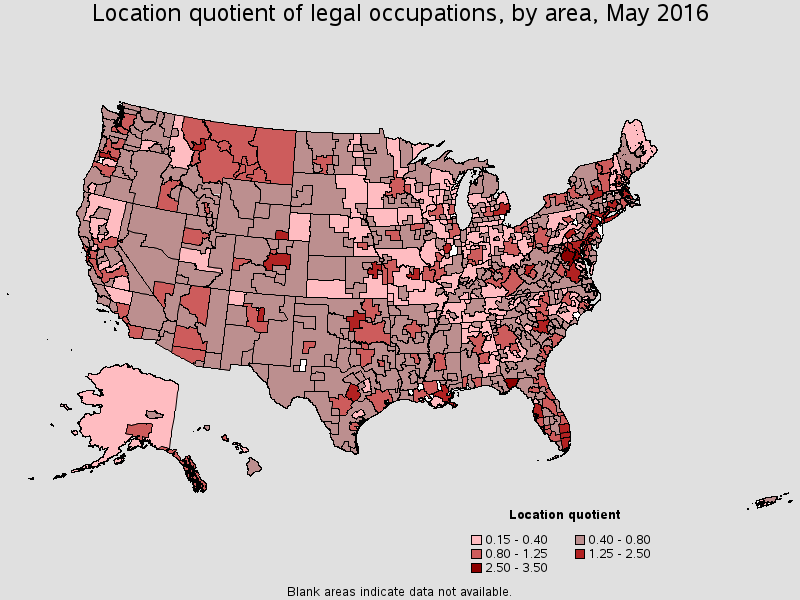
(9) The location quotient is the ratio of the area concentration of occupational employment to the national average concentration. A location quotient greater than one indicates the occupation has a higher share of employment than average, and a location quotient less than one indicates the occupation is less prevalent in the area than average.
Other OES estimates and related information:
May 2016 National Occupational Employment and Wage Estimates
May 2016 State Occupational Employment and Wage Estimates
May 2016 Metropolitan and Nonmetropolitan Area Occupational Employment and Wage Estimates
May 2016 National Industry-Specific Occupational Employment and Wage Estimates
Last Modified Date: March 31, 2017