
An official website of the United States government
An official website of the United States government
The .gov means it's official.
Federal government websites often end in .gov or .mil. Before sharing sensitive information,
make sure you're on a federal government site.
The site is secure.
The
https:// ensures that you are connecting to the official website and that any
information you provide is encrypted and transmitted securely.
Set up, operate, and maintain the electronic equipment used to transmit radio and television programs. Control audio equipment to regulate volume level and quality of sound during radio and television broadcasts. Operate transmitter to broadcast radio or television programs.
Employment estimate and mean wage estimates for this occupation:
| Employment (1) | Employment RSE (3) |
Mean hourly wage |
Mean annual wage (2) |
Wage RSE (3) |
|---|---|---|---|---|
| 30,330 | 4.9 % | $21.84 | $45,430 | 1.5 % |
Percentile wage estimates for this occupation:
| Percentile | 10% | 25% | 50% (Median) |
75% | 90% |
|---|---|---|---|---|---|
| Hourly Wage | $9.36 | $12.42 | $18.54 | $29.02 | $38.60 |
| Annual Wage (2) | $19,460 | $25,840 | $38,550 | $60,370 | $80,280 |
Industries with the highest published employment and wages for this occupation are provided. For a list of all industries with employment in this occupation, see the Create Customized Tables function.
Industries with the highest levels of employment in this occupation:
| Industry | Employment (1) | Percent of industry employment | Hourly mean wage | Annual mean wage (2) |
|---|---|---|---|---|
| Radio and Television Broadcasting | 22,100 | 10.06 | $20.58 | $42,810 |
| Cable and Other Subscription Programming | 1,560 | 2.76 | $23.56 | $49,010 |
| Motion Picture and Video Industries | 1,360 | 0.32 | $27.55 | $57,310 |
| Colleges, Universities, and Professional Schools | 930 | 0.03 | $23.80 | $49,500 |
| State Government (OES Designation) | 840 | 0.04 | $19.07 | $39,670 |
Industries with the highest concentration of employment in this occupation:
| Industry | Employment (1) | Percent of industry employment | Hourly mean wage | Annual mean wage (2) |
|---|---|---|---|---|
| Radio and Television Broadcasting | 22,100 | 10.06 | $20.58 | $42,810 |
| Cable and Other Subscription Programming | 1,560 | 2.76 | $23.56 | $49,010 |
| Satellite Telecommunications | 50 | 0.93 | (8) | (8) |
| Motion Picture and Video Industries | 1,360 | 0.32 | $27.55 | $57,310 |
| Spectator Sports | 190 | 0.14 | $25.18 | $52,370 |
Top paying industries for this occupation:
| Industry | Employment (1) | Percent of industry employment | Hourly mean wage | Annual mean wage (2) |
|---|---|---|---|---|
| Federal Executive Branch (OES Designation) | 70 | (7) | $44.62 | $92,810 |
| Wired Telecommunications Carriers | 760 | 0.13 | $29.90 | $62,190 |
| Promoters of Performing Arts, Sports, and Similar Events | 40 | 0.03 | $28.00 | $58,240 |
| Motion Picture and Video Industries | 1,360 | 0.32 | $27.55 | $57,310 |
| Religious Organizations | 50 | 0.02 | $27.06 | $56,280 |
States and areas with the highest published employment, location quotients, and wages for this occupation are provided. For a list of all areas with employment in this occupation, see the Create Customized Tables function.
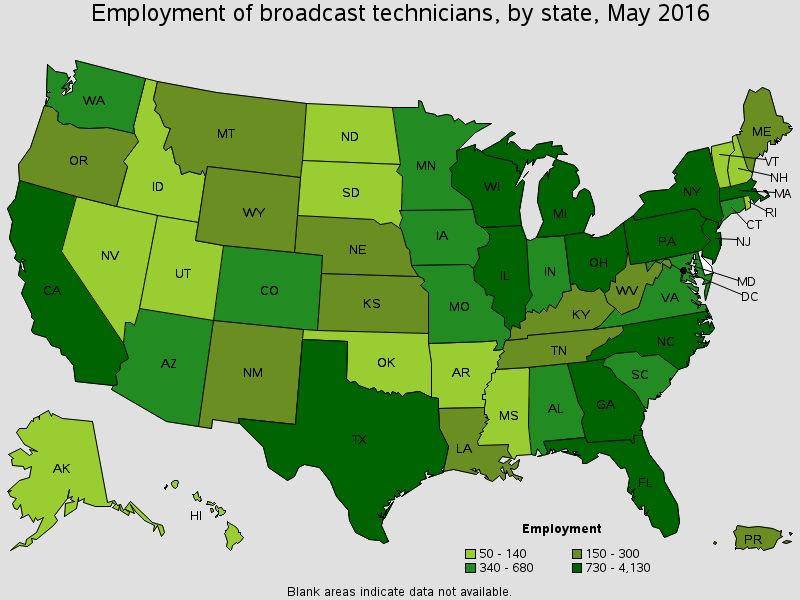
States with the highest employment level in this occupation:
| State | Employment (1) | Employment per thousand jobs | Location quotient (9) | Hourly mean wage | Annual mean wage (2) |
|---|---|---|---|---|---|
| California | 4,130 | 0.26 | 1.20 | $25.26 | $52,540 |
| New York | 4,000 | 0.44 | 2.03 | $26.21 | $54,520 |
| Florida | 1,970 | 0.24 | 1.11 | $19.16 | $39,860 |
| Texas | 1,920 | 0.16 | 0.76 | $16.87 | $35,080 |
| Illinois | 1,180 | 0.20 | 0.92 | $21.93 | $45,610 |
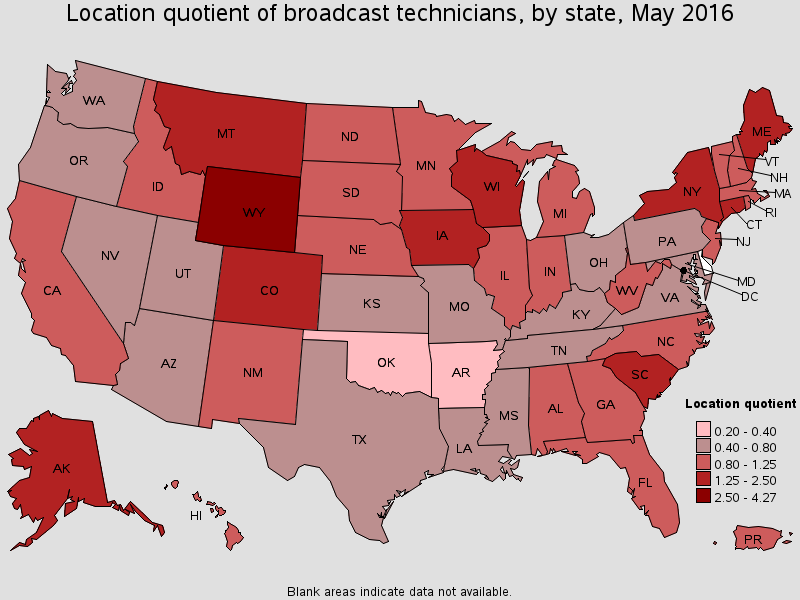
States with the highest concentration of jobs and location quotients in this occupation:
| State | Employment (1) | Employment per thousand jobs | Location quotient (9) | Hourly mean wage | Annual mean wage (2) |
|---|---|---|---|---|---|
| District of Columbia | 650 | 0.92 | 4.27 | $36.27 | $75,430 |
| Wyoming | 230 | 0.84 | 3.89 | $19.64 | $40,860 |
| New York | 4,000 | 0.44 | 2.03 | $26.21 | $54,520 |
| Montana | 160 | 0.35 | 1.62 | $15.05 | $31,300 |
| Connecticut | 580 | 0.35 | 1.62 | $20.50 | $42,650 |
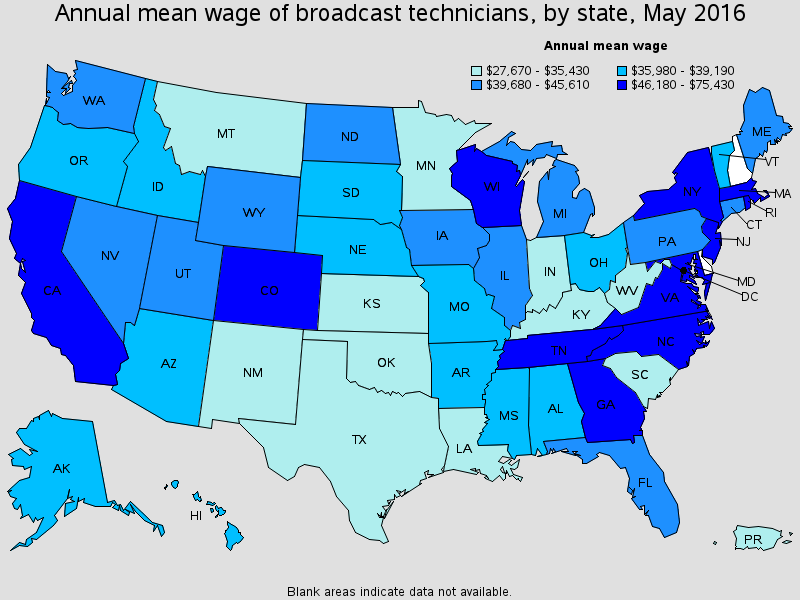
Top paying States for this occupation:
| State | Employment (1) | Employment per thousand jobs | Location quotient (9) | Hourly mean wage | Annual mean wage (2) |
|---|---|---|---|---|---|
| District of Columbia | 650 | 0.92 | 4.27 | $36.27 | $75,430 |
| New York | 4,000 | 0.44 | 2.03 | $26.21 | $54,520 |
| Wisconsin | 830 | 0.30 | 1.37 | $25.85 | $53,760 |
| New Jersey | 760 | 0.19 | 0.89 | $25.85 | $53,760 |
| California | 4,130 | 0.26 | 1.20 | $25.26 | $52,540 |
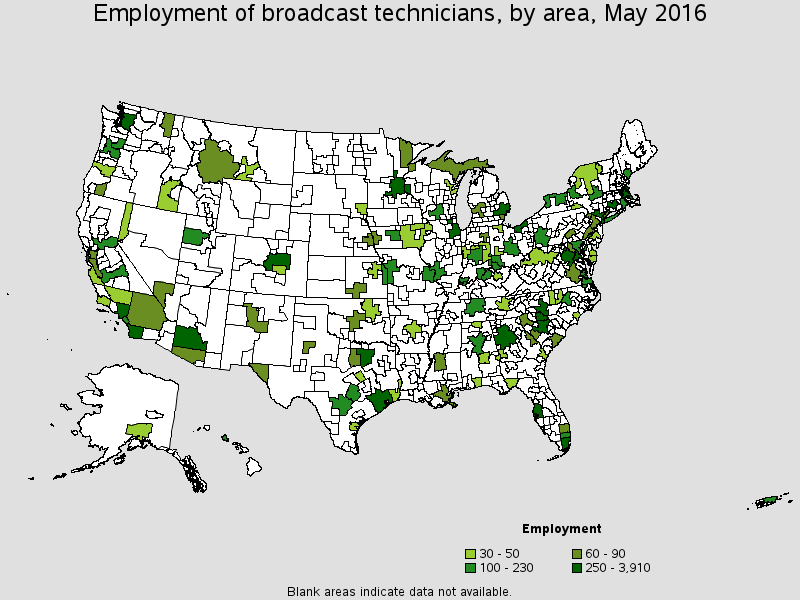
Metropolitan areas with the highest employment level in this occupation:
| Metropolitan area | Employment (1) | Employment per thousand jobs | Location quotient (9) | Hourly mean wage | Annual mean wage (2) |
|---|---|---|---|---|---|
| New York-Jersey City-White Plains, NY-NJ Metropolitan Division | 3,710 | 0.56 | 2.61 | $27.50 | $57,210 |
| Los Angeles-Long Beach-Glendale, CA Metropolitan Division | 2,400 | 0.57 | 2.64 | $26.63 | $55,390 |
| Chicago-Naperville-Arlington Heights, IL Metropolitan Division | 1,050 | 0.29 | 1.34 | $22.34 | $46,460 |
| Washington-Arlington-Alexandria, DC-VA-MD-WV Metropolitan Division | 920 | 0.37 | 1.72 | $33.64 | $69,960 |
| Boston-Cambridge-Newton, MA NECTA Division | 730 | 0.40 | 1.87 | $23.75 | $49,390 |
| Atlanta-Sandy Springs-Roswell, GA | 570 | 0.22 | 1.04 | $24.16 | $50,260 |
| Denver-Aurora-Lakewood, CO | 540 | 0.38 | 1.76 | $25.19 | $52,390 |
| Houston-The Woodlands-Sugar Land, TX | 460 | 0.16 | 0.72 | $17.44 | $36,270 |
| Charlotte-Concord-Gastonia, NC-SC | 460 | 0.39 | 1.82 | $25.87 | $53,810 |
| Hartford-West Hartford-East Hartford, CT | 440 | 0.76 | 3.52 | $20.80 | $43,260 |
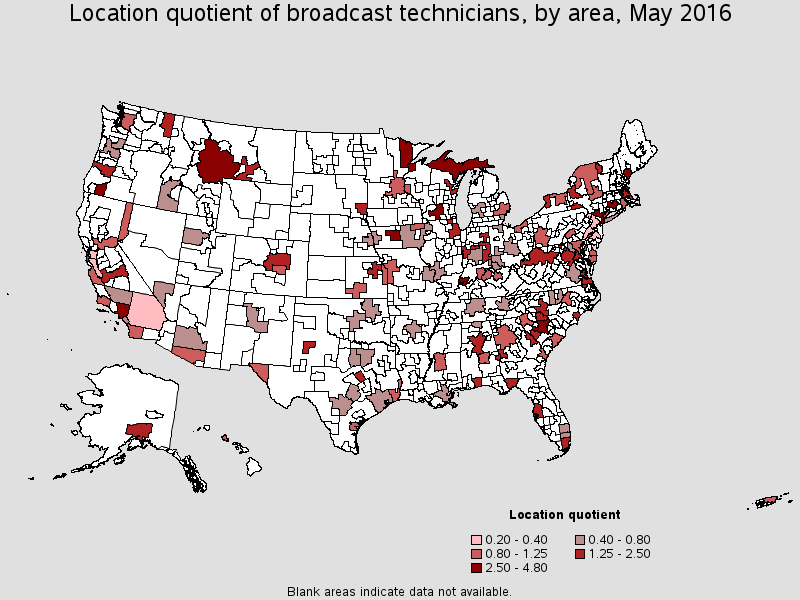
Metropolitan areas with the highest concentration of jobs and location quotients in this occupation:
| Metropolitan area | Employment (1) | Employment per thousand jobs | Location quotient (9) | Hourly mean wage | Annual mean wage (2) |
|---|---|---|---|---|---|
| Columbia, SC | 390 | 1.04 | 4.80 | $16.61 | $34,560 |
| Evansville, IN-KY | 150 | 1.00 | 4.61 | $11.94 | $24,840 |
| Medford, OR | 70 | 0.86 | 3.97 | $14.64 | $30,450 |
| Hartford-West Hartford-East Hartford, CT | 440 | 0.76 | 3.52 | $20.80 | $43,260 |
| Portland-South Portland, ME | 120 | 0.60 | 2.80 | $18.43 | $38,340 |
| Los Angeles-Long Beach-Glendale, CA Metropolitan Division | 2,400 | 0.57 | 2.64 | $26.63 | $55,390 |
| Duluth, MN-WI | 70 | 0.57 | 2.63 | $16.95 | $35,260 |
| Des Moines-West Des Moines, IA | 200 | 0.57 | 2.64 | $19.64 | $40,850 |
| New York-Jersey City-White Plains, NY-NJ Metropolitan Division | 3,710 | 0.56 | 2.61 | $27.50 | $57,210 |
| Madison, WI | 210 | 0.55 | 2.52 | $21.98 | $45,730 |

Top paying metropolitan areas for this occupation:
| Metropolitan area | Employment (1) | Employment per thousand jobs | Location quotient (9) | Hourly mean wage | Annual mean wage (2) |
|---|---|---|---|---|---|
| San Francisco-Redwood City-South San Francisco, CA Metropolitan Division | 310 | 0.29 | 1.34 | $34.34 | $71,420 |
| Washington-Arlington-Alexandria, DC-VA-MD-WV Metropolitan Division | 920 | 0.37 | 1.72 | $33.64 | $69,960 |
| Oakland-Hayward-Berkeley, CA Metropolitan Division | 70 | 0.07 | 0.30 | $33.46 | $69,600 |
| Milwaukee-Waukesha-West Allis, WI | (8) | (8) | (8) | $31.27 | $65,050 |
| Detroit-Dearborn-Livonia, MI Metropolitan Division | 90 | 0.12 | 0.56 | $28.01 | $58,270 |
| New York-Jersey City-White Plains, NY-NJ Metropolitan Division | 3,710 | 0.56 | 2.61 | $27.50 | $57,210 |
| Los Angeles-Long Beach-Glendale, CA Metropolitan Division | 2,400 | 0.57 | 2.64 | $26.63 | $55,390 |
| Riverside-San Bernardino-Ontario, CA | 70 | 0.05 | 0.23 | $26.16 | $54,420 |
| Charlotte-Concord-Gastonia, NC-SC | 460 | 0.39 | 1.82 | $25.87 | $53,810 |
| Denver-Aurora-Lakewood, CO | 540 | 0.38 | 1.76 | $25.19 | $52,390 |
Nonmetropolitan areas with the highest employment in this occupation:
| Nonmetropolitan area | Employment (1) | Employment per thousand jobs | Location quotient (9) | Hourly mean wage | Annual mean wage (2) |
|---|---|---|---|---|---|
| Southwest Montana nonmetropolitan area | 80 | 0.62 | 2.86 | $16.20 | $33,690 |
| Upper Peninsula of Michigan nonmetropolitan area | 70 | 0.60 | 2.76 | (8) | (8) |
| Central Indiana nonmetropolitan area | 50 | 0.33 | 1.52 | $12.40 | $25,790 |
| Northern West Virginia nonmetropolitan area | 40 | 0.31 | 1.43 | (8) | (8) |
| Capital/Northern New York nonmetropolitan area | 40 | 0.24 | 1.13 | $17.27 | $35,910 |
Nonmetropolitan areas with the highest concentration of jobs and location quotients in this occupation:
| Nonmetropolitan area | Employment (1) | Employment per thousand jobs | Location quotient (9) | Hourly mean wage | Annual mean wage (2) |
|---|---|---|---|---|---|
| Southwest Montana nonmetropolitan area | 80 | 0.62 | 2.86 | $16.20 | $33,690 |
| Upper Peninsula of Michigan nonmetropolitan area | 70 | 0.60 | 2.76 | (8) | (8) |
| Central Indiana nonmetropolitan area | 50 | 0.33 | 1.52 | $12.40 | $25,790 |
| Northern West Virginia nonmetropolitan area | 40 | 0.31 | 1.43 | (8) | (8) |
| Capital/Northern New York nonmetropolitan area | 40 | 0.24 | 1.13 | $17.27 | $35,910 |
Top paying nonmetropolitan areas for this occupation:
| Nonmetropolitan area | Employment (1) | Employment per thousand jobs | Location quotient (9) | Hourly mean wage | Annual mean wage (2) |
|---|---|---|---|---|---|
| Capital/Northern New York nonmetropolitan area | 40 | 0.24 | 1.13 | $17.27 | $35,910 |
| Southwest Montana nonmetropolitan area | 80 | 0.62 | 2.86 | $16.20 | $33,690 |
| Panhandle of Idaho nonmetropolitan area | (8) | (8) | (8) | $15.58 | $32,400 |
| South Central Idaho nonmetropolitan area | (8) | (8) | (8) | $14.82 | $30,810 |
| Southern Ohio non-metropolitan area | (8) | (8) | (8) | $13.81 | $28,720 |
These estimates are calculated with data collected from employers in all industry sectors, all metropolitan and nonmetropolitan areas, and all states and the District of Columbia. The top employment and wage figures are provided above. The complete list is available in the downloadable XLS files.
The percentile wage estimate is the value of a wage below which a certain percent of workers fall. The median wage is the 50th percentile wage estimate--50 percent of workers earn less than the median and 50 percent of workers earn more than the median. More about percentile wages.
(1) Estimates for detailed occupations do not sum to the totals because the totals include occupations not shown separately. Estimates do not include self-employed workers.
(2) Annual wages have been calculated by multiplying the hourly mean wage by a "year-round, full-time" hours figure of 2,080 hours; for those occupations where there is not an hourly wage published, the annual wage has been directly calculated from the reported survey data.
(3) The relative standard error (RSE) is a measure of the reliability of a survey statistic. The smaller the relative standard error, the more precise the estimate.
(7) The value is less than .005 percent of industry employment.
(8) Estimate not released.
(9) The location quotient is the ratio of the area concentration of occupational employment to the national average concentration. A location quotient greater than one indicates the occupation has a higher share of employment than average, and a location quotient less than one indicates the occupation is less prevalent in the area than average.
Other OES estimates and related information:
May 2016 National Occupational Employment and Wage Estimates
May 2016 State Occupational Employment and Wage Estimates
May 2016 Metropolitan and Nonmetropolitan Area Occupational Employment and Wage Estimates
May 2016 National Industry-Specific Occupational Employment and Wage Estimates
Last Modified Date: March 31, 2017