
An official website of the United States government
An official website of the United States government
The .gov means it's official.
Federal government websites often end in .gov or .mil. Before sharing sensitive information,
make sure you're on a federal government site.
The site is secure.
The
https:// ensures that you are connecting to the official website and that any
information you provide is encrypted and transmitted securely.
Photograph people, landscapes, merchandise, or other subjects, using digital or film cameras and equipment. May develop negatives or use computer software to produce finished images and prints. Includes scientific photographers, aerial photographers, and photojournalists.
Employment estimate and mean wage estimates for this occupation:
| Employment (1) | Employment RSE (3) |
Mean hourly wage |
Mean annual wage (2) |
Wage RSE (3) |
|---|---|---|---|---|
| 48,660 | 2.3 % | $20.50 | $42,640 | 1.8 % |
Percentile wage estimates for this occupation:
| Percentile | 10% | 25% | 50% (Median) |
75% | 90% |
|---|---|---|---|---|---|
| Hourly Wage | $9.19 | $11.29 | $16.38 | $25.10 | $36.65 |
| Annual Wage (2) | $19,110 | $23,480 | $34,070 | $52,220 | $76,220 |
Industries with the highest published employment and wages for this occupation are provided. For a list of all industries with employment in this occupation, see the Create Customized Tables function.
Industries with the highest levels of employment in this occupation:
| Industry | Employment (1) | Percent of industry employment | Hourly mean wage | Annual mean wage (2) |
|---|---|---|---|---|
| Other Professional, Scientific, and Technical Services | 28,460 | 4.20 | $18.59 | $38,660 |
| Radio and Television Broadcasting | 3,510 | 1.60 | $23.67 | $49,230 |
| Newspaper, Periodical, Book, and Directory Publishers | 3,120 | 0.82 | $22.44 | $46,670 |
| Motion Picture and Video Industries | 1,470 | 0.35 | $33.35 | $69,370 |
| Electronic Shopping and Mail-Order Houses | 1,130 | 0.31 | $21.44 | $44,600 |
Industries with the highest concentration of employment in this occupation:
| Industry | Employment (1) | Percent of industry employment | Hourly mean wage | Annual mean wage (2) |
|---|---|---|---|---|
| Other Professional, Scientific, and Technical Services | 28,460 | 4.20 | $18.59 | $38,660 |
| Radio and Television Broadcasting | 3,510 | 1.60 | $23.67 | $49,230 |
| Independent Artists, Writers, and Performers | 530 | 0.98 | $25.40 | $52,830 |
| Newspaper, Periodical, Book, and Directory Publishers | 3,120 | 0.82 | $22.44 | $46,670 |
| Motion Picture and Video Industries | 1,470 | 0.35 | $33.35 | $69,370 |
Top paying industries for this occupation:
| Industry | Employment (1) | Percent of industry employment | Hourly mean wage | Annual mean wage (2) |
|---|---|---|---|---|
| Motion Picture and Video Industries | 1,470 | 0.35 | $33.35 | $69,370 |
| Printing and Related Support Activities | 80 | 0.02 | $29.86 | $62,110 |
| Scientific Research and Development Services | 140 | 0.02 | $29.57 | $61,500 |
| Local Government (OES Designation) | 260 | (7) | $28.60 | $59,490 |
| Management, Scientific, and Technical Consulting Services | 100 | 0.01 | $28.09 | $58,430 |
States and areas with the highest published employment, location quotients, and wages for this occupation are provided. For a list of all areas with employment in this occupation, see the Create Customized Tables function.
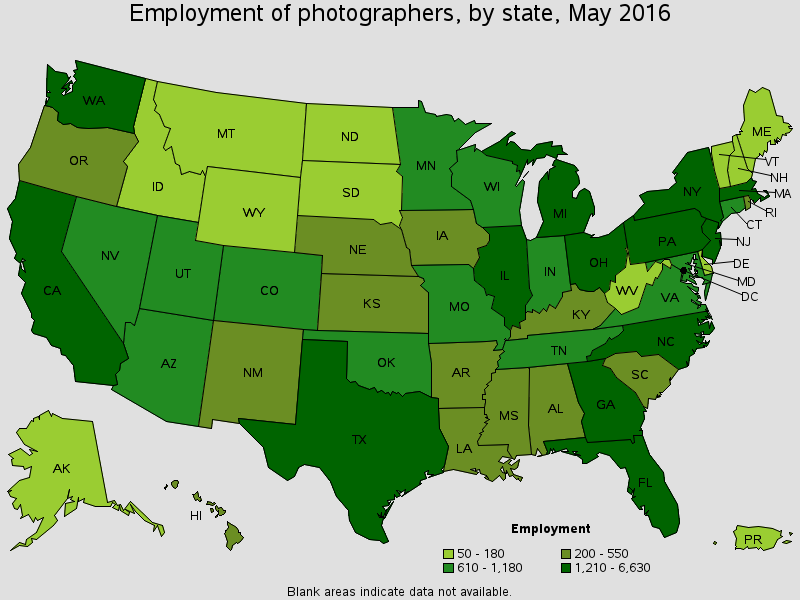
States with the highest employment level in this occupation:
| State | Employment (1) | Employment per thousand jobs | Location quotient (9) | Hourly mean wage | Annual mean wage (2) |
|---|---|---|---|---|---|
| California | 6,630 | 0.41 | 1.20 | $24.56 | $51,080 |
| New York | 3,830 | 0.42 | 1.21 | $29.58 | $61,530 |
| Florida | 3,680 | 0.45 | 1.29 | $20.53 | $42,710 |
| Texas | 3,040 | 0.26 | 0.75 | $21.15 | $43,990 |
| Illinois | 2,000 | 0.34 | 0.98 | $18.24 | $37,930 |
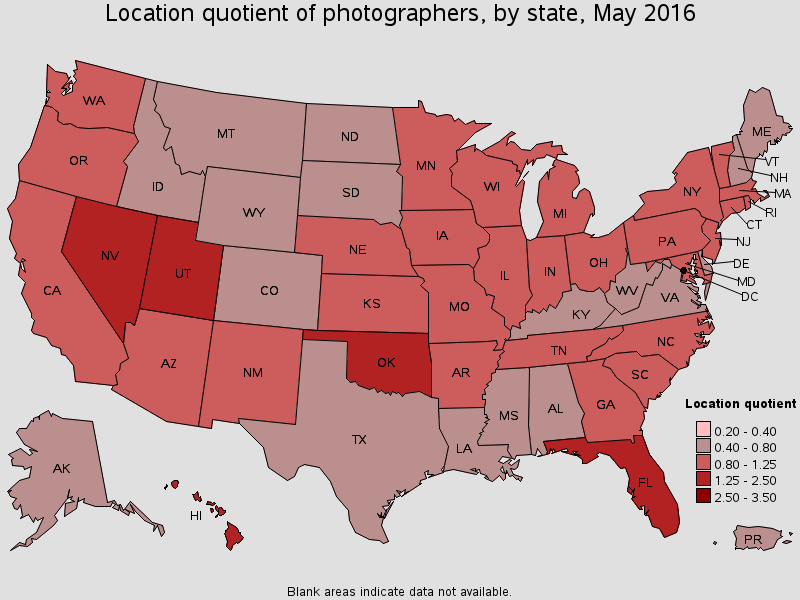
States with the highest concentration of jobs and location quotients in this occupation:
| State | Employment (1) | Employment per thousand jobs | Location quotient (9) | Hourly mean wage | Annual mean wage (2) |
|---|---|---|---|---|---|
| Hawaii | 440 | 0.69 | 1.99 | $18.99 | $39,500 |
| Nevada | 740 | 0.58 | 1.68 | $17.72 | $36,850 |
| Utah | 680 | 0.49 | 1.42 | $15.62 | $32,490 |
| Florida | 3,680 | 0.45 | 1.29 | $20.53 | $42,710 |
| Oklahoma | 690 | 0.44 | 1.26 | $15.19 | $31,590 |
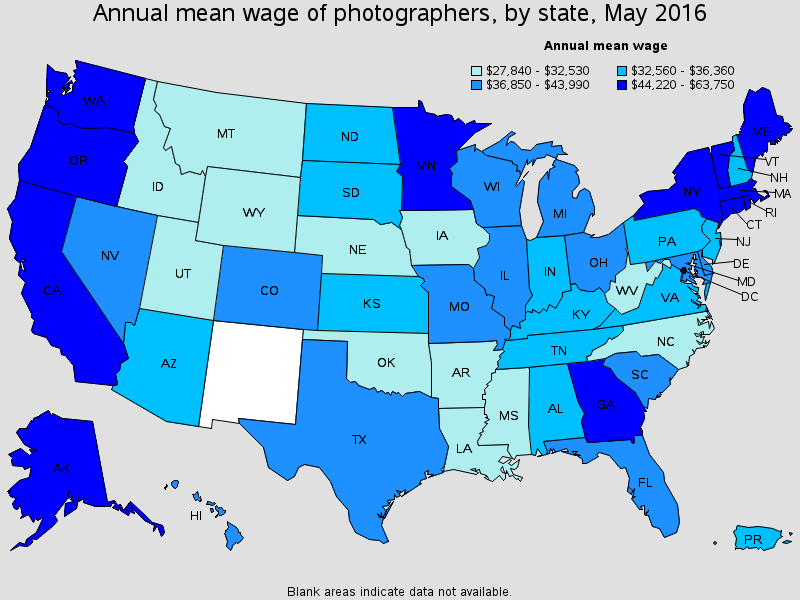
Top paying States for this occupation:
| State | Employment (1) | Employment per thousand jobs | Location quotient (9) | Hourly mean wage | Annual mean wage (2) |
|---|---|---|---|---|---|
| District of Columbia | 180 | 0.25 | 0.73 | $30.65 | $63,750 |
| New York | 3,830 | 0.42 | 1.21 | $29.58 | $61,530 |
| Massachusetts | 1,210 | 0.35 | 1.01 | $28.91 | $60,130 |
| California | 6,630 | 0.41 | 1.20 | $24.56 | $51,080 |
| Connecticut | 610 | 0.36 | 1.05 | $22.65 | $47,100 |
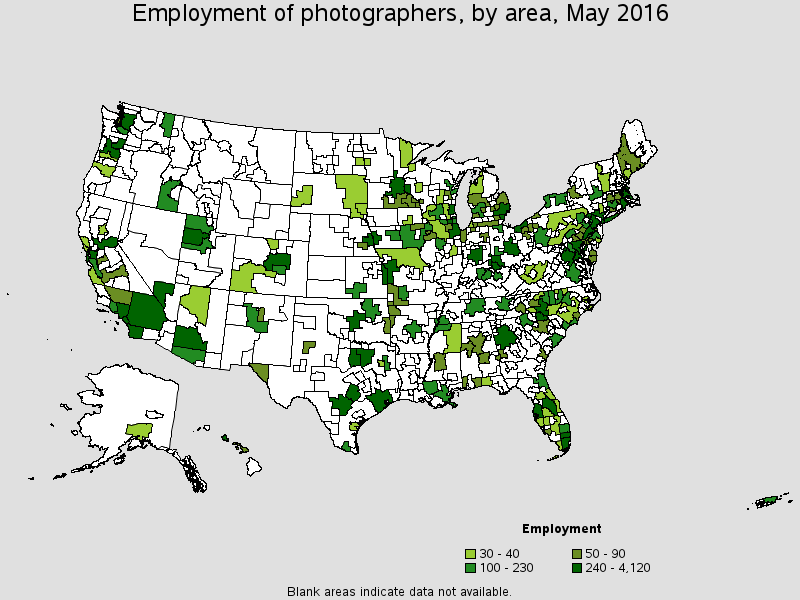
Metropolitan areas with the highest employment level in this occupation:
| Metropolitan area | Employment (1) | Employment per thousand jobs | Location quotient (9) | Hourly mean wage | Annual mean wage (2) |
|---|---|---|---|---|---|
| New York-Jersey City-White Plains, NY-NJ Metropolitan Division | 3,270 | 0.50 | 1.43 | $28.91 | $60,120 |
| Los Angeles-Long Beach-Glendale, CA Metropolitan Division | 2,900 | 0.69 | 1.98 | $28.73 | $59,750 |
| Orlando-Kissimmee-Sanford, FL | 1,450 | 1.24 | 3.58 | $16.51 | $34,350 |
| Chicago-Naperville-Arlington Heights, IL Metropolitan Division | 1,310 | 0.36 | 1.03 | $19.49 | $40,540 |
| Atlanta-Sandy Springs-Roswell, GA | 940 | 0.37 | 1.06 | $20.79 | $43,240 |
| Seattle-Bellevue-Everett, WA Metropolitan Division | 870 | 0.55 | 1.57 | $23.41 | $48,690 |
| Anaheim-Santa Ana-Irvine, CA Metropolitan Division | 760 | 0.48 | 1.40 | $26.74 | $55,610 |
| Houston-The Woodlands-Sugar Land, TX | 740 | 0.25 | 0.73 | (8) | (8) |
| Minneapolis-St. Paul-Bloomington, MN-WI | 700 | 0.37 | 1.05 | $22.61 | $47,030 |
| Boston-Cambridge-Newton, MA NECTA Division | 670 | 0.37 | 1.07 | $32.10 | $66,760 |
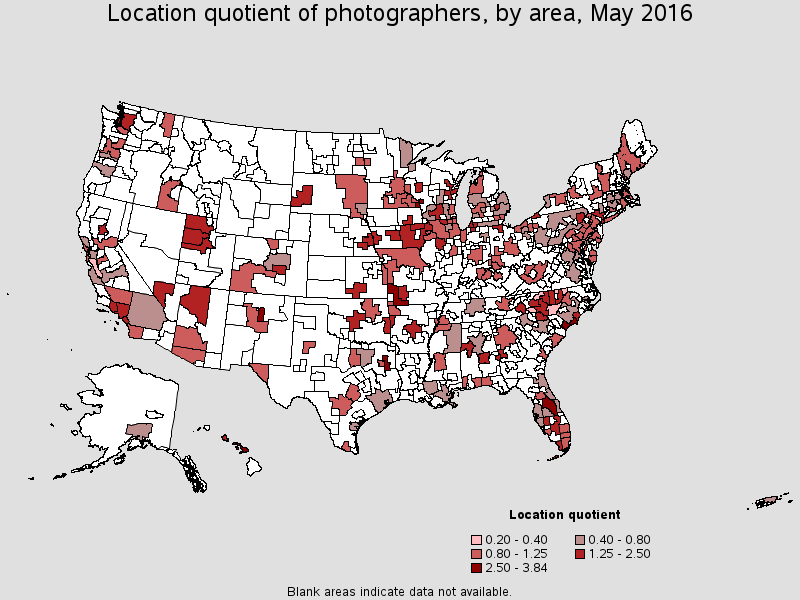
Metropolitan areas with the highest concentration of jobs and location quotients in this occupation:
| Metropolitan area | Employment (1) | Employment per thousand jobs | Location quotient (9) | Hourly mean wage | Annual mean wage (2) |
|---|---|---|---|---|---|
| Longview, TX | 130 | 1.33 | 3.84 | (8) | (8) |
| Orlando-Kissimmee-Sanford, FL | 1,450 | 1.24 | 3.58 | $16.51 | $34,350 |
| Myrtle Beach-Conway-North Myrtle Beach, SC-NC | 170 | 1.12 | 3.23 | $9.81 | $20,400 |
| Santa Fe, NM | 60 | 1.02 | 2.95 | (8) | (8) |
| Kahului-Wailuku-Lahaina, HI | 70 | 0.90 | 2.59 | (8) | (8) |
| La Crosse-Onalaska, WI-MN | 60 | 0.88 | 2.53 | $18.38 | $38,230 |
| Ogden-Clearfield, UT | 210 | 0.85 | 2.45 | $13.93 | $28,980 |
| Rockford, IL | 120 | 0.81 | 2.33 | $12.99 | $27,020 |
| Urban Honolulu, HI | 350 | 0.76 | 2.19 | (8) | (8) |
| Las Vegas-Henderson-Paradise, NV | 670 | 0.72 | 2.07 | $17.79 | $37,000 |
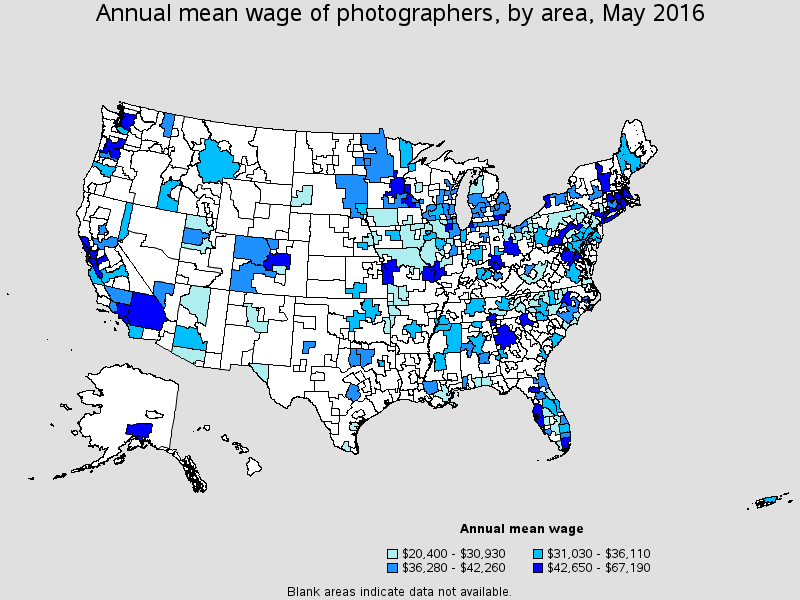
Top paying metropolitan areas for this occupation:
| Metropolitan area | Employment (1) | Employment per thousand jobs | Location quotient (9) | Hourly mean wage | Annual mean wage (2) |
|---|---|---|---|---|---|
| Nassau County-Suffolk County, NY Metropolitan Division | 400 | 0.31 | 0.91 | $32.31 | $67,190 |
| Boston-Cambridge-Newton, MA NECTA Division | 670 | 0.37 | 1.07 | $32.10 | $66,760 |
| Niles-Benton Harbor, MI | 40 | 0.67 | 1.94 | $29.96 | $62,310 |
| Brockton-Bridgewater-Easton, MA NECTA Division | (8) | (8) | (8) | $29.53 | $61,420 |
| New York-Jersey City-White Plains, NY-NJ Metropolitan Division | 3,270 | 0.50 | 1.43 | $28.91 | $60,120 |
| Los Angeles-Long Beach-Glendale, CA Metropolitan Division | 2,900 | 0.69 | 1.98 | $28.73 | $59,750 |
| San Rafael, CA Metropolitan Division | 30 | 0.30 | 0.87 | $27.73 | $57,670 |
| San Francisco-Redwood City-South San Francisco, CA Metropolitan Division | 360 | 0.34 | 0.97 | $26.99 | $56,150 |
| Anaheim-Santa Ana-Irvine, CA Metropolitan Division | 760 | 0.48 | 1.40 | $26.74 | $55,610 |
| Springfield, MA-CT | 70 | 0.23 | 0.67 | $26.51 | $55,130 |
Nonmetropolitan areas with the highest employment in this occupation:
| Nonmetropolitan area | Employment (1) | Employment per thousand jobs | Location quotient (9) | Hourly mean wage | Annual mean wage (2) |
|---|---|---|---|---|---|
| Southeast Iowa nonmetropolitan area | 120 | 0.51 | 1.47 | $13.84 | $28,780 |
| Southwest Missouri nonmetropolitan area | 90 | 1.25 | 3.60 | $9.88 | $20,550 |
| Southwest Maine nonmetropolitan area | 50 | 0.28 | 0.81 | $15.59 | $32,420 |
| Balance of Lower Peninsula of Michigan nonmetropolitan area | 50 | 0.17 | 0.48 | $18.11 | $37,670 |
| Southeast Minnesota nonmetropolitan area | 50 | 0.28 | 0.82 | $19.28 | $40,090 |
Nonmetropolitan areas with the highest concentration of jobs and location quotients in this occupation:
| Nonmetropolitan area | Employment (1) | Employment per thousand jobs | Location quotient (9) | Hourly mean wage | Annual mean wage (2) |
|---|---|---|---|---|---|
| Southwest Missouri nonmetropolitan area | 90 | 1.25 | 3.60 | $9.88 | $20,550 |
| South Florida nonmetropolitan area | 40 | 0.58 | 1.68 | $11.90 | $24,760 |
| Southeast Iowa nonmetropolitan area | 120 | 0.51 | 1.47 | $13.84 | $28,780 |
| Southern West Virginia nonmetropolitan area | 30 | 0.41 | 1.17 | $12.96 | $26,960 |
| Southern Vermont nonmetropolitan area | 40 | 0.41 | 1.17 | $20.66 | $42,980 |
Top paying nonmetropolitan areas for this occupation:
| Nonmetropolitan area | Employment (1) | Employment per thousand jobs | Location quotient (9) | Hourly mean wage | Annual mean wage (2) |
|---|---|---|---|---|---|
| Southern Pennsylvania nonmetropolitan area | 40 | 0.23 | 0.66 | $24.72 | $51,420 |
| Southern Vermont nonmetropolitan area | 40 | 0.41 | 1.17 | $20.66 | $42,980 |
| Northwest Colorado nonmetropolitan area | (8) | (8) | (8) | $20.32 | $42,260 |
| Southwest Colorado nonmetropolitan area | 30 | 0.33 | 0.97 | $20.17 | $41,960 |
| Southeast Minnesota nonmetropolitan area | 50 | 0.28 | 0.82 | $19.28 | $40,090 |
These estimates are calculated with data collected from employers in all industry sectors, all metropolitan and nonmetropolitan areas, and all states and the District of Columbia. The top employment and wage figures are provided above. The complete list is available in the downloadable XLS files.
The percentile wage estimate is the value of a wage below which a certain percent of workers fall. The median wage is the 50th percentile wage estimate--50 percent of workers earn less than the median and 50 percent of workers earn more than the median. More about percentile wages.
(1) Estimates for detailed occupations do not sum to the totals because the totals include occupations not shown separately. Estimates do not include self-employed workers.
(2) Annual wages have been calculated by multiplying the hourly mean wage by a "year-round, full-time" hours figure of 2,080 hours; for those occupations where there is not an hourly wage published, the annual wage has been directly calculated from the reported survey data.
(3) The relative standard error (RSE) is a measure of the reliability of a survey statistic. The smaller the relative standard error, the more precise the estimate.
(7) The value is less than .005 percent of industry employment.
(8) Estimate not released.
(9) The location quotient is the ratio of the area concentration of occupational employment to the national average concentration. A location quotient greater than one indicates the occupation has a higher share of employment than average, and a location quotient less than one indicates the occupation is less prevalent in the area than average.
Other OES estimates and related information:
May 2016 National Occupational Employment and Wage Estimates
May 2016 State Occupational Employment and Wage Estimates
May 2016 Metropolitan and Nonmetropolitan Area Occupational Employment and Wage Estimates
May 2016 National Industry-Specific Occupational Employment and Wage Estimates
Last Modified Date: March 31, 2017