
An official website of the United States government
An official website of the United States government
The .gov means it's official.
Federal government websites often end in .gov or .mil. Before sharing sensitive information,
make sure you're on a federal government site.
The site is secure.
The
https:// ensures that you are connecting to the official website and that any
information you provide is encrypted and transmitted securely.
Care for ill, injured, or convalescing patients or persons with disabilities in hospitals, nursing homes, clinics, private homes, group homes, and similar institutions. May work under the supervision of a registered nurse. Licensing required.
Employment estimate and mean wage estimates for this occupation:
| Employment (1) | Employment RSE (3) |
Mean hourly wage |
Mean annual wage (2) |
Wage RSE (3) |
|---|---|---|---|---|
| 702,400 | 0.6 % | $21.56 | $44,840 | 0.2 % |
Percentile wage estimates for this occupation:
| Percentile | 10% | 25% | 50% (Median) |
75% | 90% |
|---|---|---|---|---|---|
| Hourly Wage | $15.63 | $17.81 | $21.20 | $24.63 | $29.05 |
| Annual Wage (2) | $32,510 | $37,040 | $44,090 | $51,220 | $60,420 |
Industries with the highest published employment and wages for this occupation are provided. For a list of all industries with employment in this occupation, see the Create Customized Tables function.
Industries with the highest levels of employment in this occupation:
| Industry | Employment (1) | Percent of industry employment | Hourly mean wage | Annual mean wage (2) |
|---|---|---|---|---|
| Nursing Care Facilities (Skilled Nursing Facilities) | 211,940 | 12.91 | $22.12 | $46,020 |
| Offices of Physicians | 93,470 | 3.71 | $20.06 | $41,720 |
| General Medical and Surgical Hospitals | 93,050 | 1.72 | $20.89 | $43,440 |
| Home Health Care Services | 85,410 | 6.30 | $22.03 | $45,820 |
| Continuing Care Retirement Communities and Assisted Living Facilities for the Elderly | 48,920 | 5.51 | $21.95 | $45,650 |
Industries with the highest concentration of employment in this occupation:
| Industry | Employment (1) | Percent of industry employment | Hourly mean wage | Annual mean wage (2) |
|---|---|---|---|---|
| Nursing Care Facilities (Skilled Nursing Facilities) | 211,940 | 12.91 | $22.12 | $46,020 |
| Home Health Care Services | 85,410 | 6.30 | $22.03 | $45,820 |
| Continuing Care Retirement Communities and Assisted Living Facilities for the Elderly | 48,920 | 5.51 | $21.95 | $45,650 |
| Psychiatric and Substance Abuse Hospitals | 8,750 | 3.72 | $20.91 | $43,490 |
| Offices of Physicians | 93,470 | 3.71 | $20.06 | $41,720 |
Top paying industries for this occupation:
| Industry | Employment (1) | Percent of industry employment | Hourly mean wage | Annual mean wage (2) |
|---|---|---|---|---|
| Insurance Carriers | 920 | 0.08 | $24.38 | $50,710 |
| Business Support Services | 40 | (7) | $23.90 | $49,700 |
| Management, Scientific, and Technical Consulting Services | 290 | 0.02 | $23.57 | $49,020 |
| Religious Organizations | 390 | 0.20 | $23.48 | $48,840 |
| RV (Recreational Vehicle) Parks and Recreational Camps | 30 | 0.06 | $22.83 | $47,480 |
States and areas with the highest published employment, location quotients, and wages for this occupation are provided. For a list of all areas with employment in this occupation, see the Create Customized Tables function.
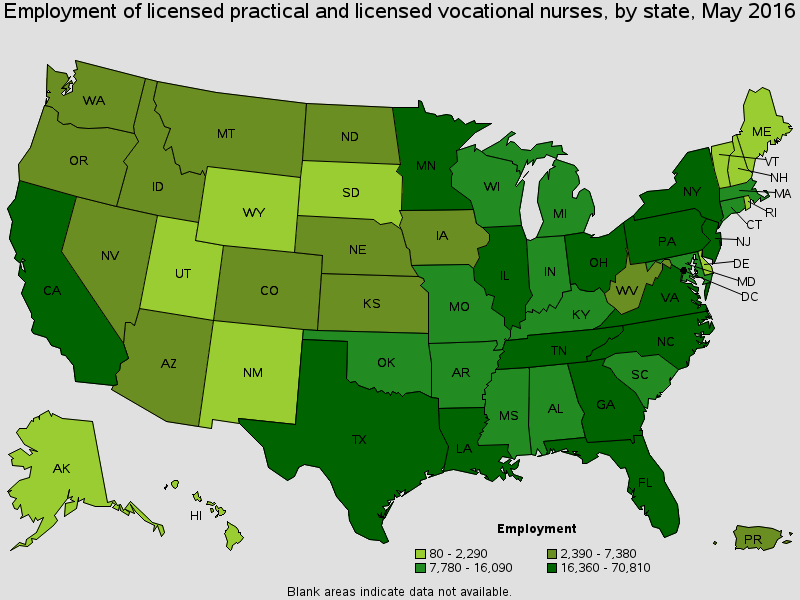
States with the highest employment level in this occupation:
| State | Employment (1) | Employment per thousand jobs | Location quotient (9) | Hourly mean wage | Annual mean wage (2) |
|---|---|---|---|---|---|
| Texas | 70,810 | 6.03 | 1.21 | $22.17 | $46,110 |
| California | 68,110 | 4.27 | 0.85 | $25.32 | $52,670 |
| New York | 46,990 | 5.17 | 1.03 | $22.68 | $47,170 |
| Florida | 44,820 | 5.45 | 1.09 | $20.65 | $42,960 |
| Ohio | 39,920 | 7.48 | 1.49 | $19.87 | $41,320 |
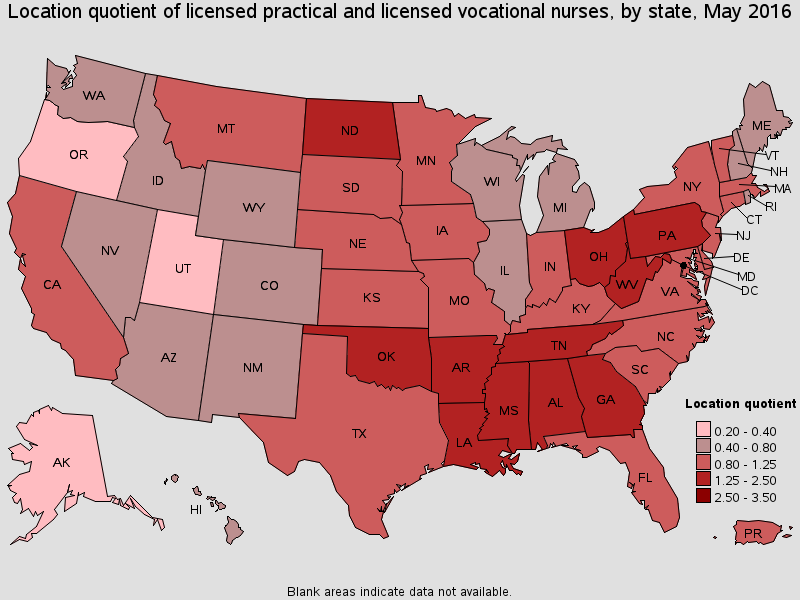
States with the highest concentration of jobs and location quotients in this occupation:
| State | Employment (1) | Employment per thousand jobs | Location quotient (9) | Hourly mean wage | Annual mean wage (2) |
|---|---|---|---|---|---|
| Louisiana | 20,580 | 10.71 | 2.14 | $18.31 | $38,070 |
| Arkansas | 12,100 | 10.16 | 2.03 | $17.69 | $36,800 |
| West Virginia | 6,090 | 8.73 | 1.75 | $17.33 | $36,050 |
| Tennessee | 23,620 | 8.16 | 1.63 | $18.23 | $37,920 |
| Mississippi | 8,990 | 8.05 | 1.61 | $17.71 | $36,840 |
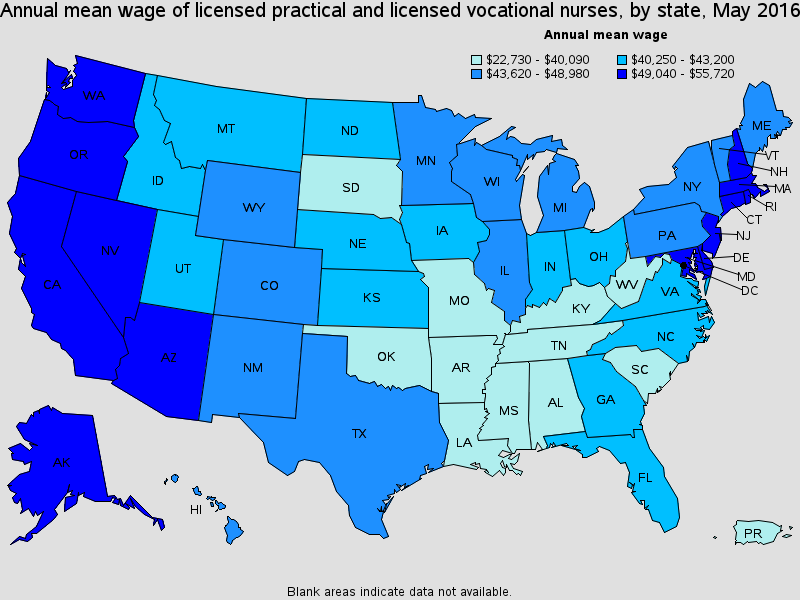
Top paying States for this occupation:
| State | Employment (1) | Employment per thousand jobs | Location quotient (9) | Hourly mean wage | Annual mean wage (2) |
|---|---|---|---|---|---|
| Connecticut | 7,780 | 4.67 | 0.93 | $26.79 | $55,720 |
| Rhode Island | 1,060 | 2.22 | 0.44 | $26.64 | $55,410 |
| District of Columbia | 1,720 | 2.45 | 0.49 | $26.54 | $55,200 |
| Massachusetts | 15,890 | 4.59 | 0.92 | $26.53 | $55,190 |
| Alaska | 500 | 1.54 | 0.31 | $25.85 | $53,760 |
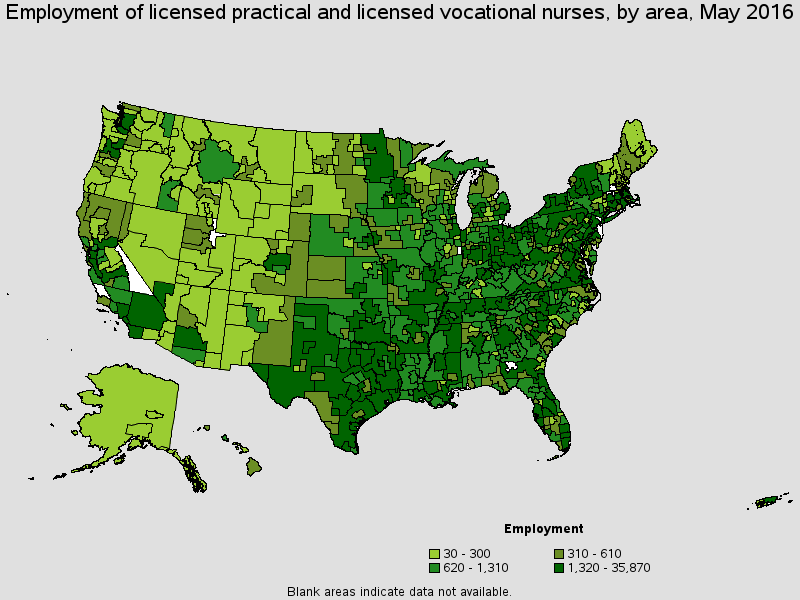
Metropolitan areas with the highest employment level in this occupation:
| Metropolitan area | Employment (1) | Employment per thousand jobs | Location quotient (9) | Hourly mean wage | Annual mean wage (2) |
|---|---|---|---|---|---|
| New York-Jersey City-White Plains, NY-NJ Metropolitan Division | 25,020 | 3.80 | 0.76 | $25.89 | $53,850 |
| Los Angeles-Long Beach-Glendale, CA Metropolitan Division | 20,870 | 4.94 | 0.99 | $24.24 | $50,420 |
| Houston-The Woodlands-Sugar Land, TX | 12,820 | 4.37 | 0.87 | $24.76 | $51,490 |
| Atlanta-Sandy Springs-Roswell, GA | 11,940 | 4.68 | 0.93 | $20.74 | $43,140 |
| Dallas-Plano-Irving, TX Metropolitan Division | 11,070 | 4.56 | 0.91 | $22.76 | $47,340 |
| Chicago-Naperville-Arlington Heights, IL Metropolitan Division | 9,940 | 2.73 | 0.55 | $25.43 | $52,880 |
| Minneapolis-St. Paul-Bloomington, MN-WI | 9,050 | 4.74 | 0.95 | $21.93 | $45,620 |
| Washington-Arlington-Alexandria, DC-VA-MD-WV Metropolitan Division | 8,020 | 3.22 | 0.64 | $23.95 | $49,810 |
| Riverside-San Bernardino-Ontario, CA | 7,680 | 5.64 | 1.13 | $23.51 | $48,900 |
| Anaheim-Santa Ana-Irvine, CA Metropolitan Division | 7,470 | 4.78 | 0.95 | $25.19 | $52,400 |
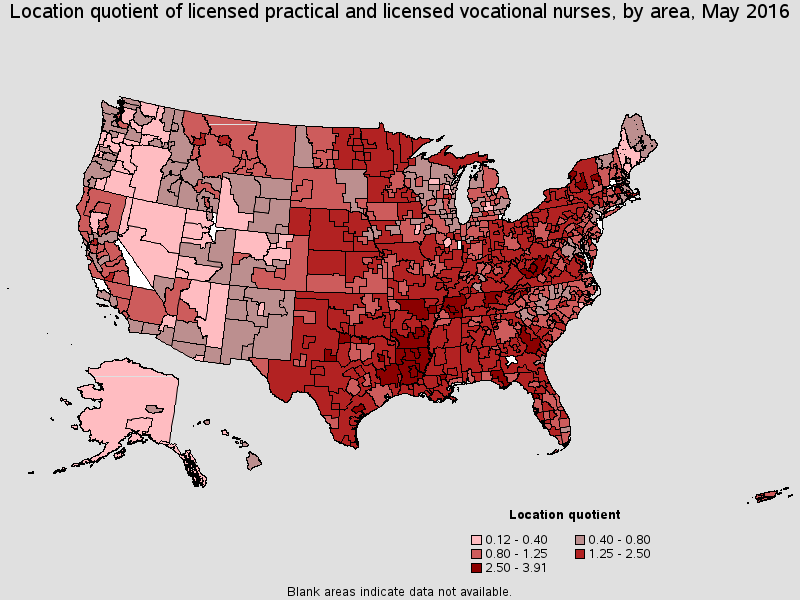
Metropolitan areas with the highest concentration of jobs and location quotients in this occupation:
| Metropolitan area | Employment (1) | Employment per thousand jobs | Location quotient (9) | Hourly mean wage | Annual mean wage (2) |
|---|---|---|---|---|---|
| Wichita Falls, TX | 1,010 | 18.07 | 3.61 | $19.57 | $40,710 |
| Alexandria, LA | 1,080 | 17.66 | 3.53 | $17.88 | $37,180 |
| Homosassa Springs, FL | 560 | 17.53 | 3.50 | $19.36 | $40,270 |
| Johnson City, TN | 1,260 | 16.14 | 3.23 | $17.01 | $35,370 |
| Jackson, TN | 980 | 15.40 | 3.08 | $16.18 | $33,650 |
| Shreveport-Bossier City, LA | 2,660 | 14.95 | 2.99 | $18.30 | $38,060 |
| Sherman-Denison, TX | 640 | 14.79 | 2.96 | $19.82 | $41,220 |
| Monroe, LA | 1,110 | 14.46 | 2.89 | $17.70 | $36,830 |
| Jonesboro, AR | 770 | 14.28 | 2.85 | $17.00 | $35,350 |
| Pine Bluff, AR | 420 | 13.83 | 2.76 | $15.48 | $32,210 |
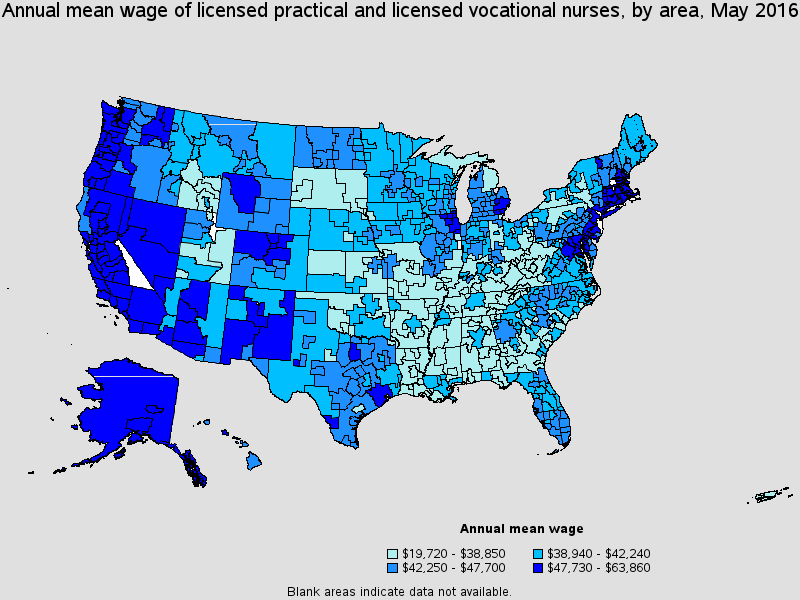
Top paying metropolitan areas for this occupation:
| Metropolitan area | Employment (1) | Employment per thousand jobs | Location quotient (9) | Hourly mean wage | Annual mean wage (2) |
|---|---|---|---|---|---|
| San Francisco-Redwood City-South San Francisco, CA Metropolitan Division | 2,330 | 2.18 | 0.44 | $30.70 | $63,860 |
| San Rafael, CA Metropolitan Division | 350 | 3.14 | 0.63 | $29.51 | $61,390 |
| San Jose-Sunnyvale-Santa Clara, CA | 2,180 | 2.09 | 0.42 | $29.18 | $60,700 |
| Peabody-Salem-Beverly, MA NECTA Division | 630 | 6.64 | 1.33 | $28.80 | $59,900 |
| Lynn-Saugus-Marblehead, MA NECTA Division | 240 | 5.61 | 1.12 | $28.55 | $59,390 |
| Santa Maria-Santa Barbara, CA | 520 | 2.85 | 0.57 | $27.92 | $58,080 |
| Napa, CA | 160 | 2.30 | 0.46 | $27.77 | $57,770 |
| Boston-Cambridge-Newton, MA NECTA Division | 5,790 | 3.21 | 0.64 | $27.76 | $57,750 |
| Laredo, TX | 460 | 4.72 | 0.94 | $27.75 | $57,710 |
| Vallejo-Fairfield, CA | 860 | 6.66 | 1.33 | $27.62 | $57,450 |
Nonmetropolitan areas with the highest employment in this occupation:
| Nonmetropolitan area | Employment (1) | Employment per thousand jobs | Location quotient (9) | Hourly mean wage | Annual mean wage (2) |
|---|---|---|---|---|---|
| North Northeastern Ohio non-metropolitan area (non-contiguous) | 3,530 | 10.68 | 2.13 | $18.93 | $39,360 |
| North Texas nonmetropolitan area | 2,980 | 11.21 | 2.24 | $20.50 | $42,650 |
| Hill Country Region of Texas nonmetropolitan area | 2,360 | 12.21 | 2.44 | $21.81 | $45,370 |
| West Northwestern Ohio nonmetropolitan area | 2,200 | 8.71 | 1.74 | $18.49 | $38,460 |
| West Texas nonmetropolitan area | 2,100 | 10.79 | 2.16 | $19.41 | $40,360 |
Nonmetropolitan areas with the highest concentration of jobs and location quotients in this occupation:
| Nonmetropolitan area | Employment (1) | Employment per thousand jobs | Location quotient (9) | Hourly mean wage | Annual mean wage (2) |
|---|---|---|---|---|---|
| Northeast Louisiana nonmetropolitan area | 1,290 | 19.58 | 3.91 | $17.72 | $36,860 |
| Central Louisiana nonmetropolitan area | 1,300 | 16.59 | 3.32 | $17.23 | $35,840 |
| Washington Parish Louisiana nonmetropolitan area | 150 | 15.89 | 3.18 | $19.08 | $39,690 |
| South Arkansas nonmetropolitan area | 1,550 | 15.83 | 3.16 | $17.27 | $35,930 |
| North Arkansas nonmetropolitan area | 1,680 | 14.46 | 2.89 | $16.39 | $34,090 |
Top paying nonmetropolitan areas for this occupation:
| Nonmetropolitan area | Employment (1) | Employment per thousand jobs | Location quotient (9) | Hourly mean wage | Annual mean wage (2) |
|---|---|---|---|---|---|
| Balance of Alaska nonmetropolitan area | 50 | 0.73 | 0.15 | $26.92 | $55,990 |
| Southeast Alaska nonmetropolitan area | 60 | 1.60 | 0.32 | $26.71 | $55,560 |
| Mother Lode Region of California nonmetropolitan area | 190 | 4.75 | 0.95 | $26.39 | $54,890 |
| North Nevada nonmetropolitan area | 60 | 1.36 | 0.27 | $26.39 | $54,880 |
| Connecticut nonmetropolitan area | 190 | 5.68 | 1.13 | $25.78 | $53,620 |
These estimates are calculated with data collected from employers in all industry sectors, all metropolitan and nonmetropolitan areas, and all states and the District of Columbia. The top employment and wage figures are provided above. The complete list is available in the downloadable XLS files.
The percentile wage estimate is the value of a wage below which a certain percent of workers fall. The median wage is the 50th percentile wage estimate--50 percent of workers earn less than the median and 50 percent of workers earn more than the median. More about percentile wages.
(1) Estimates for detailed occupations do not sum to the totals because the totals include occupations not shown separately. Estimates do not include self-employed workers.
(2) Annual wages have been calculated by multiplying the hourly mean wage by a "year-round, full-time" hours figure of 2,080 hours; for those occupations where there is not an hourly wage published, the annual wage has been directly calculated from the reported survey data.
(3) The relative standard error (RSE) is a measure of the reliability of a survey statistic. The smaller the relative standard error, the more precise the estimate.
(7) The value is less than .005 percent of industry employment.
(9) The location quotient is the ratio of the area concentration of occupational employment to the national average concentration. A location quotient greater than one indicates the occupation has a higher share of employment than average, and a location quotient less than one indicates the occupation is less prevalent in the area than average.
Other OES estimates and related information:
May 2016 National Occupational Employment and Wage Estimates
May 2016 State Occupational Employment and Wage Estimates
May 2016 Metropolitan and Nonmetropolitan Area Occupational Employment and Wage Estimates
May 2016 National Industry-Specific Occupational Employment and Wage Estimates
Last Modified Date: March 31, 2017