
An official website of the United States government
An official website of the United States government
The .gov means it's official.
Federal government websites often end in .gov or .mil. Before sharing sensitive information,
make sure you're on a federal government site.
The site is secure.
The
https:// ensures that you are connecting to the official website and that any
information you provide is encrypted and transmitted securely.
Evaluate and advise individuals to assist recovery from or avoid athletic-related injuries or illnesses, or maintain peak physical fitness. May provide first aid or emergency care.
Employment estimate and mean wage estimates for this occupation:
| Employment (1) | Employment RSE (3) |
Mean hourly wage |
Mean annual wage (2) |
Mean wage RSE (3) |
|---|---|---|---|---|
| 24,130 | 2.7 % | (4) | $47,880 | 0.7 % |
Percentile wage estimates for this occupation:
| Percentile | 10% | 25% | 50% (Median) |
75% | 90% |
|---|---|---|---|---|---|
| Annual Wage (2) | $30,300 | $37,010 | $45,630 | $56,320 | $69,140 |
Industries with the highest published employment and wages for this occupation are provided. For a list of all industries with employment in this occupation, see the Create Customized Tables function.
Industries with the highest levels of employment in this occupation:
| Industry | Employment (1) | Percent of industry employment | Hourly mean wage | Annual mean wage (2) |
|---|---|---|---|---|
| Colleges, Universities, and Professional Schools | 5,140 | 0.17 | (4) | $48,020 |
| Offices of Other Health Practitioners | 4,250 | 0.51 | (4) | $43,530 |
| General Medical and Surgical Hospitals | 3,970 | 0.07 | (4) | $46,580 |
| Other Amusement and Recreation Industries | 2,890 | 0.23 | (4) | $46,680 |
| Elementary and Secondary Schools | 2,770 | 0.03 | (4) | $56,520 |
Industries with the highest concentration of employment in this occupation:
| Industry | Employment (1) | Percent of industry employment | Hourly mean wage | Annual mean wage (2) |
|---|---|---|---|---|
| Spectator Sports | 780 | 0.56 | (4) | $56,180 |
| Offices of Other Health Practitioners | 4,250 | 0.51 | (4) | $43,530 |
| Other Amusement and Recreation Industries | 2,890 | 0.23 | (4) | $46,680 |
| Colleges, Universities, and Professional Schools | 5,140 | 0.17 | (4) | $48,020 |
| Other Schools and Instruction | 410 | 0.10 | (4) | $38,560 |
Top paying industries for this occupation:
| Industry | Employment (1) | Percent of industry employment | Hourly mean wage | Annual mean wage (2) |
|---|---|---|---|---|
| Elementary and Secondary Schools | 2,770 | 0.03 | (4) | $56,520 |
| Spectator Sports | 780 | 0.56 | (4) | $56,180 |
| Promoters of Performing Arts, Sports, and Similar Events | 100 | 0.08 | (4) | $55,000 |
| Management of Companies and Enterprises | 80 | (7) | (4) | $51,170 |
| Business, Professional, Labor, Political, and Similar Organizations | 40 | 0.01 | (4) | $50,590 |
States and areas with the highest published employment, location quotients, and wages for this occupation are provided. For a list of all areas with employment in this occupation, see the Create Customized Tables function.
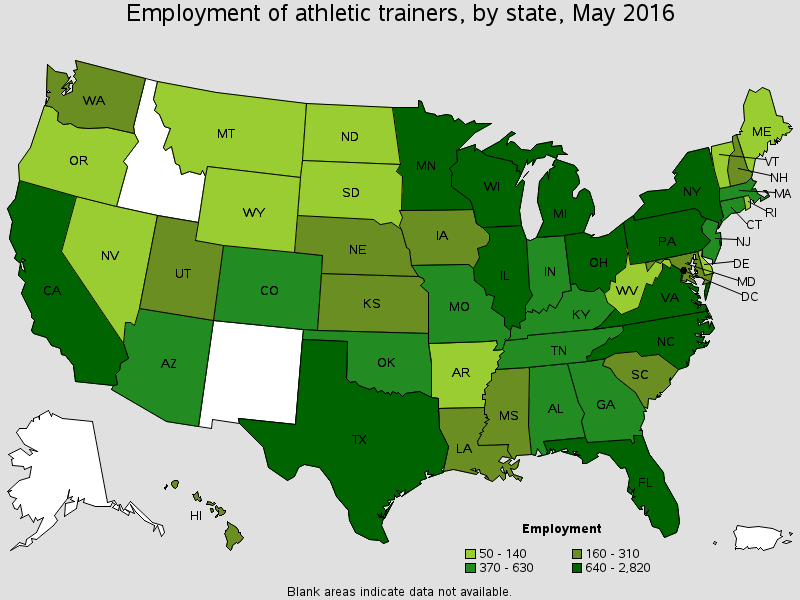
States with the highest employment level in this occupation:
| State | Employment (1) | Employment per thousand jobs | Location quotient (9) | Hourly mean wage | Annual mean wage (2) |
|---|---|---|---|---|---|
| Texas | 2,820 | 0.24 | 1.40 | (4) | $53,620 |
| Pennsylvania | 1,480 | 0.26 | 1.50 | (4) | $44,900 |
| California | 1,450 | 0.09 | 0.53 | (4) | $49,020 |
| New York | 1,250 | 0.14 | 0.80 | (4) | $47,220 |
| Ohio | 1,190 | 0.22 | 1.30 | (4) | $46,460 |
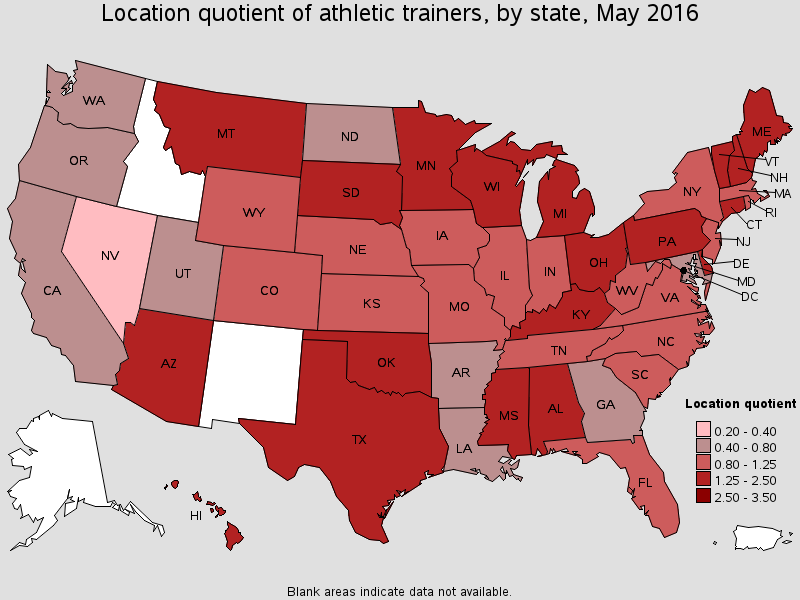
States with the highest concentration of jobs and location quotients in this occupation:
| State | Employment (1) | Employment per thousand jobs | Location quotient (9) | Hourly mean wage | Annual mean wage (2) |
|---|---|---|---|---|---|
| Delaware | 140 | 0.32 | 1.85 | (4) | $41,620 |
| South Dakota | 120 | 0.29 | 1.72 | (4) | $44,410 |
| Minnesota | 760 | 0.27 | 1.57 | (4) | $47,830 |
| Hawaii | 170 | 0.27 | 1.59 | (4) | $51,820 |
| Wisconsin | 720 | 0.26 | 1.49 | (4) | $49,310 |
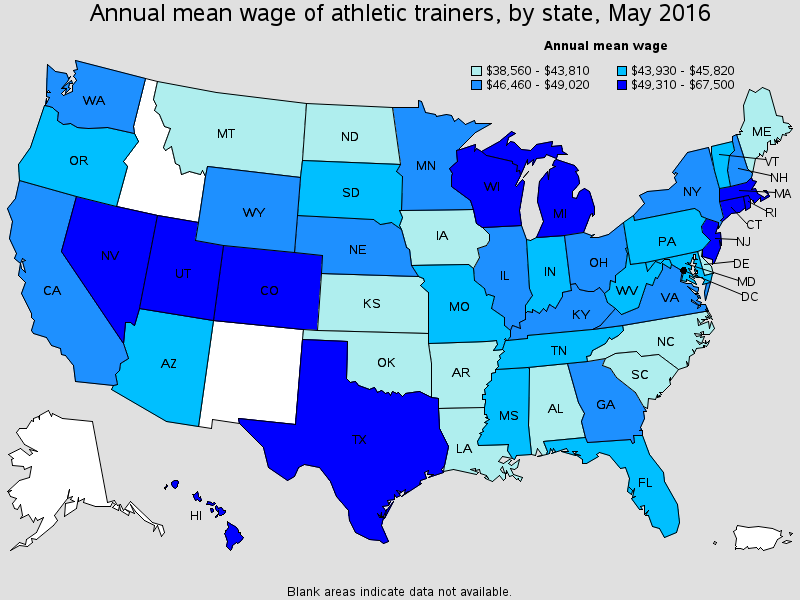
Top paying States for this occupation:
| State | Employment (1) | Employment per thousand jobs | Location quotient (9) | Hourly mean wage | Annual mean wage (2) |
|---|---|---|---|---|---|
| District of Columbia | 70 | 0.10 | 0.60 | (4) | $67,500 |
| New Jersey | 630 | 0.16 | 0.93 | (4) | $59,180 |
| Connecticut | 370 | 0.22 | 1.29 | (4) | $57,140 |
| Nevada | 50 | 0.04 | 0.21 | (4) | $57,110 |
| Texas | 2,820 | 0.24 | 1.40 | (4) | $53,620 |
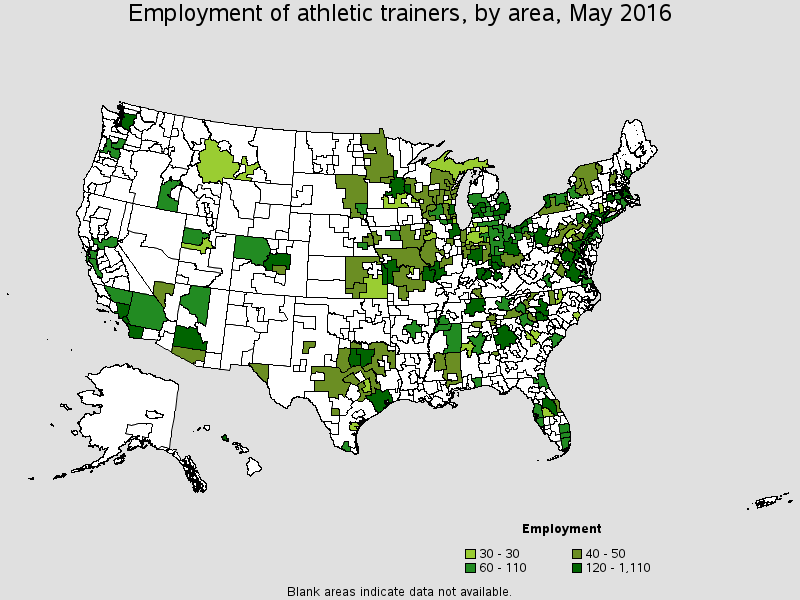
Metropolitan areas with the highest employment level in this occupation:
| Metropolitan area | Employment (1) | Employment per thousand jobs | Location quotient (9) | Hourly mean wage | Annual mean wage (2) |
|---|---|---|---|---|---|
| Houston-The Woodlands-Sugar Land, TX | 780 | 0.27 | 1.56 | (4) | $61,710 |
| New York-Jersey City-White Plains, NY-NJ Metropolitan Division | 730 | 0.11 | 0.65 | (4) | $51,460 |
| Chicago-Naperville-Arlington Heights, IL Metropolitan Division | 720 | 0.20 | 1.16 | (4) | $48,170 |
| Minneapolis-St. Paul-Bloomington, MN-WI | 540 | 0.28 | 1.64 | (4) | $48,110 |
| Phoenix-Mesa-Scottsdale, AZ | 420 | 0.22 | 1.25 | (4) | $41,920 |
| Pittsburgh, PA | 390 | 0.35 | 2.03 | (4) | $41,140 |
| Washington-Arlington-Alexandria, DC-VA-MD-WV Metropolitan Division | 360 | 0.14 | 0.84 | (4) | $52,360 |
| Los Angeles-Long Beach-Glendale, CA Metropolitan Division | 330 | 0.08 | 0.45 | (4) | $49,260 |
| Fort Worth-Arlington, TX Metropolitan Division | 310 | 0.32 | 1.87 | (4) | $54,550 |
| Dallas-Plano-Irving, TX Metropolitan Division | 310 | 0.13 | 0.74 | (4) | $64,470 |
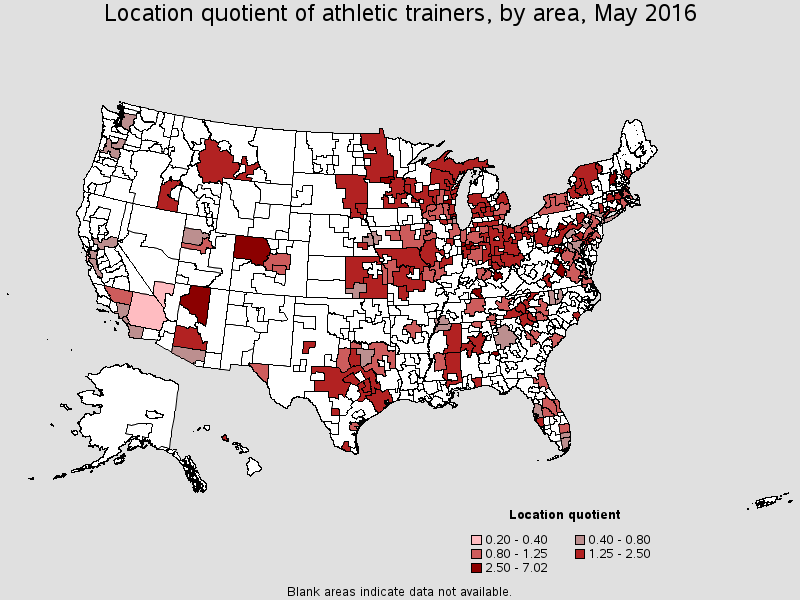
Metropolitan areas with the highest concentration of jobs and location quotients in this occupation:
| Metropolitan area | Employment (1) | Employment per thousand jobs | Location quotient (9) | Hourly mean wage | Annual mean wage (2) |
|---|---|---|---|---|---|
| Flagstaff, AZ | 80 | 1.21 | 7.02 | (4) | $62,130 |
| Fond du Lac, WI | 30 | 0.74 | 4.30 | (4) | $49,590 |
| State College, PA | 50 | 0.73 | 4.26 | (8) | (8) |
| Auburn-Opelika, AL | 40 | 0.70 | 4.05 | (4) | $44,110 |
| Racine, WI | 50 | 0.69 | 4.00 | (4) | $50,350 |
| Harrisonburg, VA | 40 | 0.67 | 3.88 | (4) | $45,450 |
| Winchester, VA-WV | 40 | 0.65 | 3.77 | (4) | $56,810 |
| Bowling Green, KY | 40 | 0.57 | 3.34 | (4) | $42,540 |
| Lafayette-West Lafayette, IN | 40 | 0.48 | 2.80 | (4) | $44,130 |
| St. Cloud, MN | 50 | 0.47 | 2.71 | (4) | $40,810 |
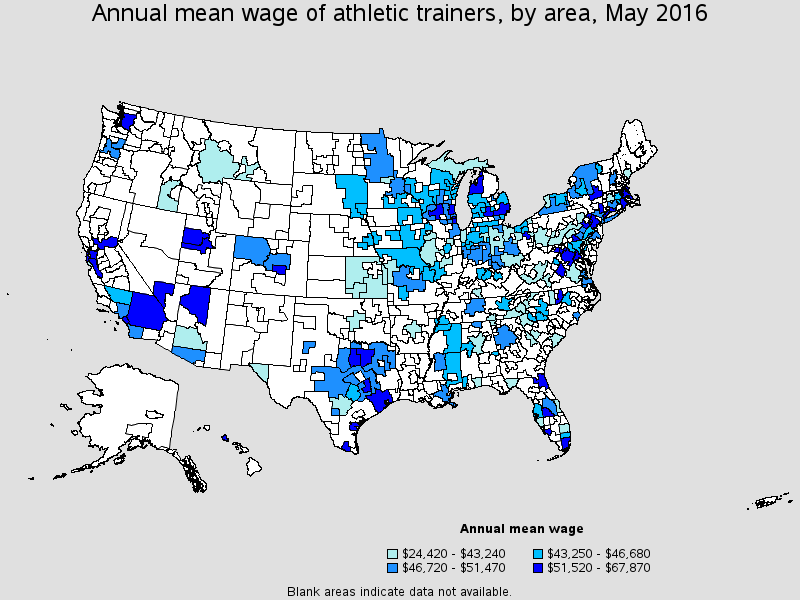
Top paying metropolitan areas for this occupation:
| Metropolitan area | Employment (1) | Employment per thousand jobs | Location quotient (9) | Hourly mean wage | Annual mean wage (2) |
|---|---|---|---|---|---|
| Charlottesville, VA | 50 | 0.47 | 2.76 | (4) | $67,870 |
| College Station-Bryan, TX | 30 | 0.32 | 1.88 | (4) | $65,550 |
| Dallas-Plano-Irving, TX Metropolitan Division | 310 | 0.13 | 0.74 | (4) | $64,470 |
| Flagstaff, AZ | 80 | 1.21 | 7.02 | (4) | $62,130 |
| Houston-The Woodlands-Sugar Land, TX | 780 | 0.27 | 1.56 | (4) | $61,710 |
| Bridgeport-Stamford-Norwalk, CT | 130 | 0.31 | 1.81 | (4) | $60,800 |
| San Francisco-Redwood City-South San Francisco, CA Metropolitan Division | 70 | 0.06 | 0.35 | (4) | $60,270 |
| Boston-Cambridge-Newton, MA NECTA Division | 290 | 0.16 | 0.94 | (4) | $60,190 |
| McAllen-Edinburg-Mission, TX | 60 | 0.25 | 1.47 | (4) | $60,180 |
| Las Vegas-Henderson-Paradise, NV | 40 | 0.04 | 0.24 | (4) | $60,020 |
Nonmetropolitan areas with the highest employment in this occupation:
| Nonmetropolitan area | Employment (1) | Employment per thousand jobs | Location quotient (9) | Hourly mean wage | Annual mean wage (2) |
|---|---|---|---|---|---|
| West Northwestern Ohio nonmetropolitan area | 90 | 0.35 | 2.02 | (4) | $42,120 |
| North Northeastern Ohio non-metropolitan area (non-contiguous) | 80 | 0.25 | 1.47 | (4) | $39,820 |
| Northeast Mississippi nonmetropolitan area | 80 | 0.34 | 1.98 | (4) | $46,370 |
| Balance of Lower Peninsula of Michigan nonmetropolitan area | 60 | 0.22 | 1.26 | (4) | $45,110 |
| Northwest Colorado nonmetropolitan area | 60 | 0.52 | 3.03 | (4) | $47,990 |
Nonmetropolitan areas with the highest concentration of jobs and location quotients in this occupation:
| Nonmetropolitan area | Employment (1) | Employment per thousand jobs | Location quotient (9) | Hourly mean wage | Annual mean wage (2) |
|---|---|---|---|---|---|
| West Central New Hampshire nonmetropolitan area | 40 | 0.68 | 3.96 | (4) | $48,360 |
| Northwest Colorado nonmetropolitan area | 60 | 0.52 | 3.03 | (4) | $47,990 |
| North Missouri nonmetropolitan area | 40 | 0.41 | 2.36 | (4) | $43,970 |
| West Northwestern Ohio nonmetropolitan area | 90 | 0.35 | 2.02 | (4) | $42,120 |
| East South Dakota nonmetropolitan area | 40 | 0.34 | 1.97 | (4) | $44,490 |
Top paying nonmetropolitan areas for this occupation:
| Nonmetropolitan area | Employment (1) | Employment per thousand jobs | Location quotient (9) | Hourly mean wage | Annual mean wage (2) |
|---|---|---|---|---|---|
| Northwest Lower Peninsula of Michigan nonmetropolitan area | (8) | (8) | (8) | (4) | $52,380 |
| Capital/Northern New York nonmetropolitan area | 40 | 0.30 | 1.76 | (4) | $51,400 |
| Northwest Minnesota nonmetropolitan area | 40 | 0.24 | 1.39 | (4) | $48,610 |
| West Central New Hampshire nonmetropolitan area | 40 | 0.68 | 3.96 | (4) | $48,360 |
| Central Missouri nonmetropolitan area | 40 | 0.23 | 1.34 | (4) | $48,340 |
These estimates are calculated with data collected from employers in all industry sectors, all metropolitan and nonmetropolitan areas, and all states and the District of Columbia. The top employment and wage figures are provided above. The complete list is available in the downloadable XLS files.
The percentile wage estimate is the value of a wage below which a certain percent of workers fall. The median wage is the 50th percentile wage estimate--50 percent of workers earn less than the median and 50 percent of workers earn more than the median. More about percentile wages.
(1) Estimates for detailed occupations do not sum to the totals because the totals include occupations not shown separately. Estimates do not include self-employed workers.
(2) Annual wages have been calculated by multiplying the hourly mean wage by a "year-round, full-time" hours figure of 2,080 hours; for those occupations where there is not an hourly wage published, the annual wage has been directly calculated from the reported survey data.
(3) The relative standard error (RSE) is a measure of the reliability of a survey statistic. The smaller the relative standard error, the more precise the estimate.
(4) Wages for some occupations that do not generally work year-round, full time, are reported either as hourly wages or annual salaries depending on how they are typically paid.
(7) The value is less than .005 percent of industry employment.
(8) Estimate not released.
(9) The location quotient is the ratio of the area concentration of occupational employment to the national average concentration. A location quotient greater than one indicates the occupation has a higher share of employment than average, and a location quotient less than one indicates the occupation is less prevalent in the area than average.
Other OES estimates and related information:
May 2016 National Occupational Employment and Wage Estimates
May 2016 State Occupational Employment and Wage Estimates
May 2016 Metropolitan and Nonmetropolitan Area Occupational Employment and Wage Estimates
May 2016 National Industry-Specific Occupational Employment and Wage Estimates
Last Modified Date: March 31, 2017