
An official website of the United States government
An official website of the United States government
The .gov means it's official.
Federal government websites often end in .gov or .mil. Before sharing sensitive information,
make sure you're on a federal government site.
The site is secure.
The
https:// ensures that you are connecting to the official website and that any
information you provide is encrypted and transmitted securely.
All healthcare practitioners and technical workers not listed separately.
Employment estimate and mean wage estimates for this occupation:
| Employment (1) | Employment RSE (3) |
Mean hourly wage |
Mean annual wage (2) |
Wage RSE (3) |
|---|---|---|---|---|
| 36,000 | 1.9 % | $27.87 | $57,960 | 1.3 % |
Percentile wage estimates for this occupation:
| Percentile | 10% | 25% | 50% (Median) |
75% | 90% |
|---|---|---|---|---|---|
| Hourly Wage | $12.48 | $16.14 | $23.47 | $37.21 | $50.03 |
| Annual Wage (2) | $25,960 | $33,580 | $48,820 | $77,400 | $104,050 |
Industries with the highest published employment and wages for this occupation are provided. For a list of all industries with employment in this occupation, see the Create Customized Tables function.
Industries with the highest levels of employment in this occupation:
| Industry | Employment (1) | Percent of industry employment | Hourly mean wage | Annual mean wage (2) |
|---|---|---|---|---|
| General Medical and Surgical Hospitals | 12,890 | 0.24 | $27.51 | $57,220 |
| Federal Executive Branch (OES Designation) | 4,580 | 0.23 | $37.69 | $78,400 |
| Offices of Other Health Practitioners | 2,580 | 0.31 | $18.88 | $39,280 |
| Outpatient Care Centers | 2,020 | 0.24 | $25.27 | $52,570 |
| Offices of Physicians | 2,020 | 0.08 | $27.98 | $58,190 |
Industries with the highest concentration of employment in this occupation:
| Industry | Employment (1) | Percent of industry employment | Hourly mean wage | Annual mean wage (2) |
|---|---|---|---|---|
| Other Ambulatory Health Care Services | 1,230 | 0.43 | $27.11 | $56,380 |
| Offices of Other Health Practitioners | 2,580 | 0.31 | $18.88 | $39,280 |
| Specialty (except Psychiatric and Substance Abuse) Hospitals | 650 | 0.25 | $25.37 | $52,770 |
| General Medical and Surgical Hospitals | 12,890 | 0.24 | $27.51 | $57,220 |
| Outpatient Care Centers | 2,020 | 0.24 | $25.27 | $52,570 |
Top paying industries for this occupation:
| Industry | Employment (1) | Percent of industry employment | Hourly mean wage | Annual mean wage (2) |
|---|---|---|---|---|
| Junior Colleges | 160 | 0.02 | $47.42 | $98,630 |
| Federal Executive Branch (OES Designation) | 4,580 | 0.23 | $37.69 | $78,400 |
| Drugs and Druggists' Sundries Merchant Wholesalers | 60 | 0.03 | $35.64 | $74,130 |
| Insurance Carriers | 390 | 0.03 | $33.24 | $69,130 |
| Agencies, Brokerages, and Other Insurance Related Activities | 40 | (7) | $30.42 | $63,270 |
States and areas with the highest published employment, location quotients, and wages for this occupation are provided. For a list of all areas with employment in this occupation, see the Create Customized Tables function.
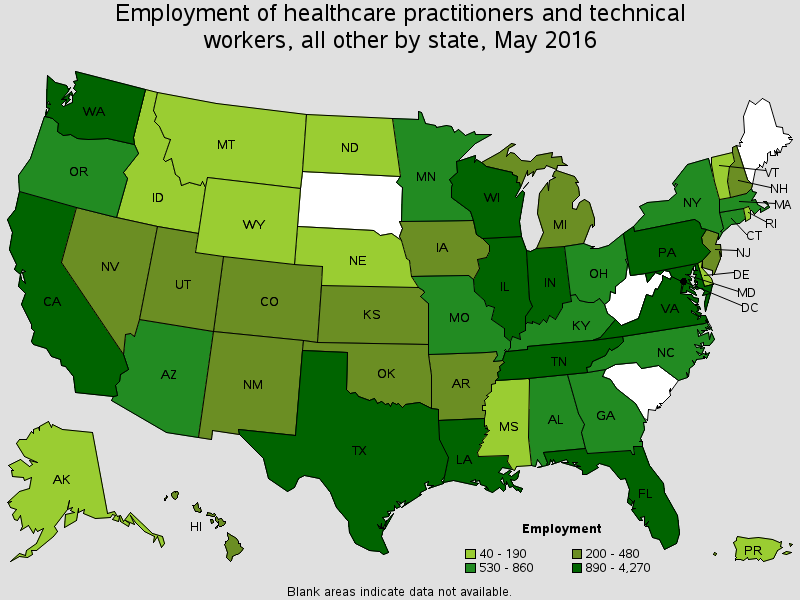
States with the highest employment level in this occupation:
| State | Employment (1) | Employment per thousand jobs | Location quotient (9) | Hourly mean wage | Annual mean wage (2) |
|---|---|---|---|---|---|
| California | 4,270 | 0.27 | 1.04 | $36.65 | $76,220 |
| Illinois | 2,860 | 0.48 | 1.89 | $21.86 | $45,470 |
| Tennessee | 2,760 | 0.95 | 3.72 | $25.71 | $53,480 |
| Maryland | 2,010 | 0.76 | 2.97 | $42.14 | $87,660 |
| Florida | 1,720 | 0.21 | 0.82 | $23.29 | $48,440 |
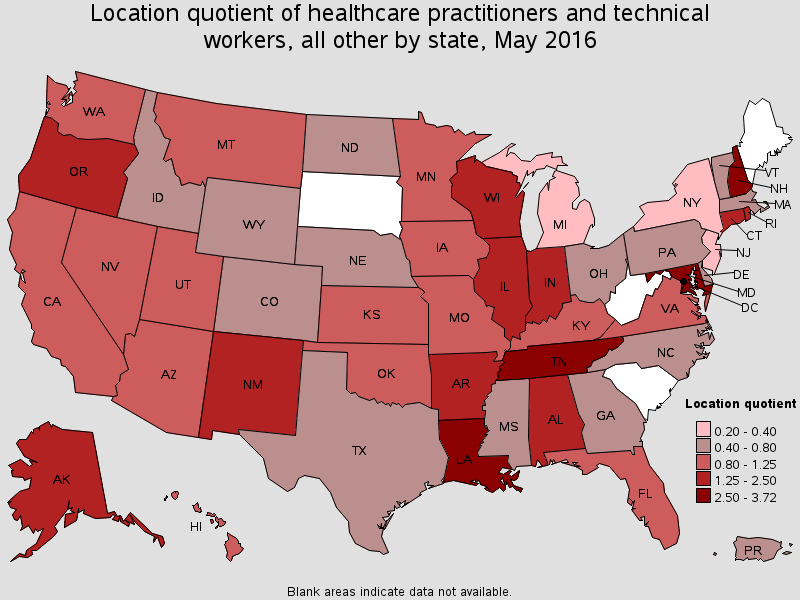
States with the highest concentration of jobs and location quotients in this occupation:
| State | Employment (1) | Employment per thousand jobs | Location quotient (9) | Hourly mean wage | Annual mean wage (2) |
|---|---|---|---|---|---|
| Tennessee | 2,760 | 0.95 | 3.72 | $25.71 | $53,480 |
| Louisiana | 1,510 | 0.78 | 3.05 | $22.39 | $46,570 |
| Maryland | 2,010 | 0.76 | 2.97 | $42.14 | $87,660 |
| New Hampshire | 420 | 0.65 | 2.52 | $30.42 | $63,270 |
| New Mexico | 420 | 0.52 | 2.04 | $25.17 | $52,360 |
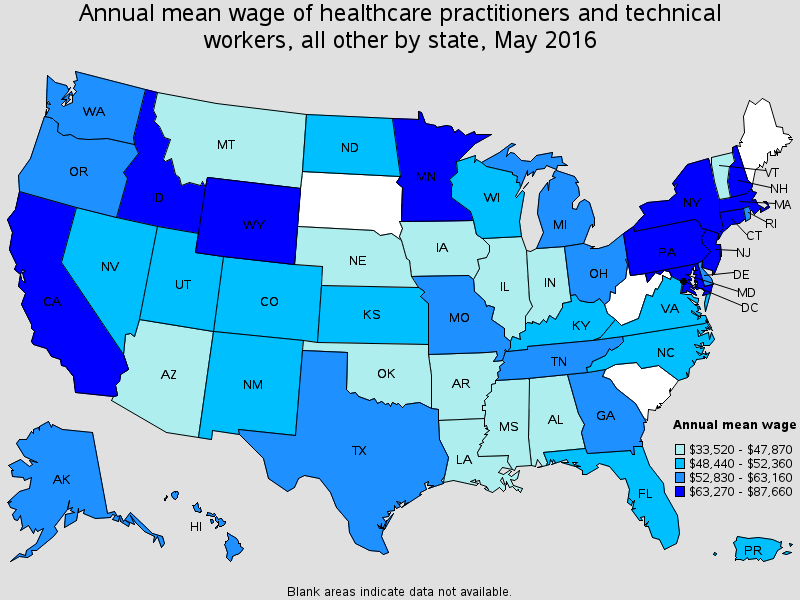
Top paying States for this occupation:
| State | Employment (1) | Employment per thousand jobs | Location quotient (9) | Hourly mean wage | Annual mean wage (2) |
|---|---|---|---|---|---|
| Maryland | 2,010 | 0.76 | 2.97 | $42.14 | $87,660 |
| New Jersey | 210 | 0.05 | 0.21 | $39.61 | $82,390 |
| New York | 810 | 0.09 | 0.35 | $38.54 | $80,160 |
| District of Columbia | 100 | 0.14 | 0.56 | $37.76 | $78,530 |
| California | 4,270 | 0.27 | 1.04 | $36.65 | $76,220 |
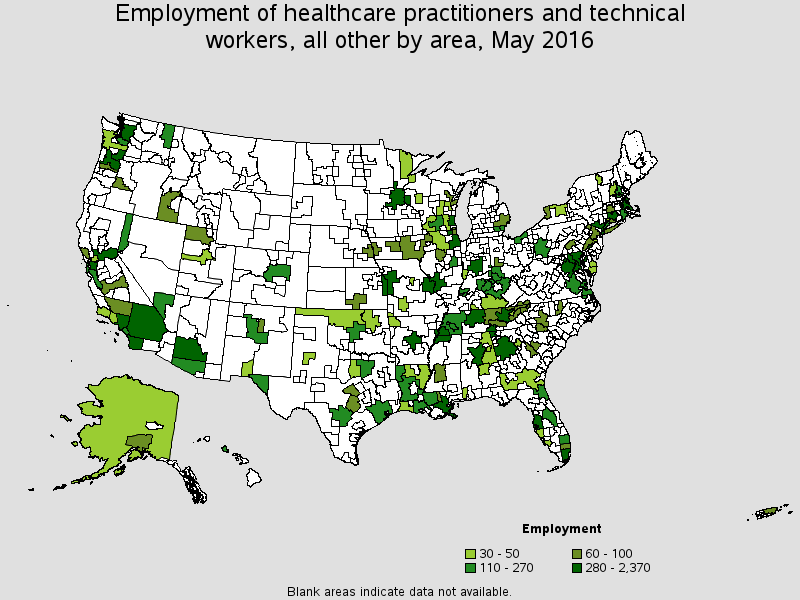
Metropolitan areas with the highest employment level in this occupation:
| Metropolitan area | Employment (1) | Employment per thousand jobs | Location quotient (9) | Hourly mean wage | Annual mean wage (2) |
|---|---|---|---|---|---|
| Chicago-Naperville-Arlington Heights, IL Metropolitan Division | 2,070 | 0.57 | 2.22 | $22.00 | $45,760 |
| Los Angeles-Long Beach-Glendale, CA Metropolitan Division | 1,330 | 0.32 | 1.23 | $36.82 | $76,580 |
| Nashville-Davidson--Murfreesboro--Franklin, TN | 1,070 | 1.17 | 4.58 | $27.82 | $57,860 |
| Silver Spring-Frederick-Rockville, MD Metropolitan Division | 890 | 1.54 | 5.99 | $48.31 | $100,490 |
| Baltimore-Columbia-Towson, MD | 750 | 0.56 | 2.17 | $35.90 | $74,670 |
| Washington-Arlington-Alexandria, DC-VA-MD-WV Metropolitan Division | 700 | 0.28 | 1.09 | $35.97 | $74,820 |
| Portland-Vancouver-Hillsboro, OR-WA | 590 | 0.52 | 2.02 | $27.06 | $56,290 |
| Phoenix-Mesa-Scottsdale, AZ | 570 | 0.29 | 1.15 | $19.10 | $39,740 |
| Atlanta-Sandy Springs-Roswell, GA | 560 | 0.22 | 0.86 | $30.34 | $63,110 |
| Indianapolis-Carmel-Anderson, IN | 560 | 0.55 | 2.15 | $21.82 | $45,380 |
Metropolitan areas with the highest concentration of jobs and location quotients in this occupation:
| Metropolitan area | Employment (1) | Employment per thousand jobs | Location quotient (9) | Hourly mean wage | Annual mean wage (2) |
|---|---|---|---|---|---|
| Hammond, LA | 90 | 2.22 | 8.65 | $36.61 | $76,140 |
| Jackson, TN | 110 | 1.71 | 6.65 | $20.80 | $43,270 |
| Champaign-Urbana, IL | 160 | 1.63 | 6.37 | $19.51 | $40,570 |
| Silver Spring-Frederick-Rockville, MD Metropolitan Division | 890 | 1.54 | 5.99 | $48.31 | $100,490 |
| Shreveport-Bossier City, LA | 230 | 1.28 | 4.98 | $17.98 | $37,400 |
| Chattanooga, TN-GA | 280 | 1.20 | 4.67 | $23.14 | $48,130 |
| Nashville-Davidson--Murfreesboro--Franklin, TN | 1,070 | 1.17 | 4.58 | $27.82 | $57,860 |
| Little Rock-North Little Rock-Conway, AR | 390 | 1.16 | 4.51 | $21.67 | $45,060 |
| Johnson City, TN | 90 | 1.12 | 4.38 | $21.05 | $43,790 |
| Santa Fe, NM | 60 | 1.03 | 4.03 | $23.01 | $47,860 |
Top paying metropolitan areas for this occupation:
| Metropolitan area | Employment (1) | Employment per thousand jobs | Location quotient (9) | Hourly mean wage | Annual mean wage (2) |
|---|---|---|---|---|---|
| Springfield, MO | 30 | 0.16 | 0.64 | $52.90 | $110,040 |
| San Jose-Sunnyvale-Santa Clara, CA | 250 | 0.24 | 0.92 | $52.53 | $109,260 |
| El Paso, TX | 140 | 0.47 | 1.83 | $49.33 | $102,620 |
| Silver Spring-Frederick-Rockville, MD Metropolitan Division | 890 | 1.54 | 5.99 | $48.31 | $100,490 |
| Nassau County-Suffolk County, NY Metropolitan Division | 60 | 0.04 | 0.17 | $43.49 | $90,460 |
| New Haven, CT | 90 | 0.32 | 1.25 | $42.88 | $89,190 |
| Newark, NJ-PA Metropolitan Division | 90 | 0.08 | 0.31 | $42.71 | $88,830 |
| Bend-Redmond, OR | 80 | 1.02 | 3.96 | $42.15 | $87,670 |
| Oakland-Hayward-Berkeley, CA Metropolitan Division | 320 | 0.30 | 1.15 | $40.83 | $84,920 |
| Anaheim-Santa Ana-Irvine, CA Metropolitan Division | 270 | 0.17 | 0.67 | $40.72 | $84,700 |
Nonmetropolitan areas with the highest employment in this occupation:
| Nonmetropolitan area | Employment (1) | Employment per thousand jobs | Location quotient (9) | Hourly mean wage | Annual mean wage (2) |
|---|---|---|---|---|---|
| Central Louisiana nonmetropolitan area | 230 | 2.90 | 11.32 | $12.81 | $26,640 |
| West Tennessee nonmetropolitan area | 150 | 1.20 | 4.67 | $21.58 | $44,890 |
| Central New Hampshire nonmetropolitan area | 130 | 1.33 | 5.19 | $31.65 | $65,830 |
| Central Kentucky nonmetropolitan area | 110 | 0.58 | 2.26 | $25.36 | $52,750 |
| Southeast Iowa nonmetropolitan area | 80 | 0.34 | 1.34 | $16.90 | $35,150 |
Nonmetropolitan areas with the highest concentration of jobs and location quotients in this occupation:
| Nonmetropolitan area | Employment (1) | Employment per thousand jobs | Location quotient (9) | Hourly mean wage | Annual mean wage (2) |
|---|---|---|---|---|---|
| Central Louisiana nonmetropolitan area | 230 | 2.90 | 11.32 | $12.81 | $26,640 |
| Central New Hampshire nonmetropolitan area | 130 | 1.33 | 5.19 | $31.65 | $65,830 |
| West Tennessee nonmetropolitan area | 150 | 1.20 | 4.67 | $21.58 | $44,890 |
| North Central Tennessee nonmetropolitan area | 70 | 0.68 | 2.64 | $23.06 | $47,960 |
| West Central New Hampshire nonmetropolitan area | 40 | 0.68 | 2.65 | (8) | (8) |
Top paying nonmetropolitan areas for this occupation:
| Nonmetropolitan area | Employment (1) | Employment per thousand jobs | Location quotient (9) | Hourly mean wage | Annual mean wage (2) |
|---|---|---|---|---|---|
| Central New Hampshire nonmetropolitan area | 130 | 1.33 | 5.19 | $31.65 | $65,830 |
| Upper Eastern Shore of Maryland nonmetropolitan area | (8) | (8) | (8) | $30.19 | $62,790 |
| Southwest Louisiana nonmetropolitan area | (8) | (8) | (8) | $28.77 | $59,840 |
| South Central Kentucky nonmetropolitan area | 50 | 0.28 | 1.07 | $26.84 | $55,830 |
| Southwest Washington nonmetropolitan area | 40 | 0.58 | 2.27 | $26.67 | $55,480 |
These estimates are calculated with data collected from employers in all industry sectors, all metropolitan and nonmetropolitan areas, and all states and the District of Columbia. The top employment and wage figures are provided above. The complete list is available in the downloadable XLS files.
The percentile wage estimate is the value of a wage below which a certain percent of workers fall. The median wage is the 50th percentile wage estimate--50 percent of workers earn less than the median and 50 percent of workers earn more than the median. More about percentile wages.
(1) Estimates for detailed occupations do not sum to the totals because the totals include occupations not shown separately. Estimates do not include self-employed workers.
(2) Annual wages have been calculated by multiplying the hourly mean wage by a "year-round, full-time" hours figure of 2,080 hours; for those occupations where there is not an hourly wage published, the annual wage has been directly calculated from the reported survey data.
(3) The relative standard error (RSE) is a measure of the reliability of a survey statistic. The smaller the relative standard error, the more precise the estimate.
(7) The value is less than .005 percent of industry employment.
(8) Estimate not released.
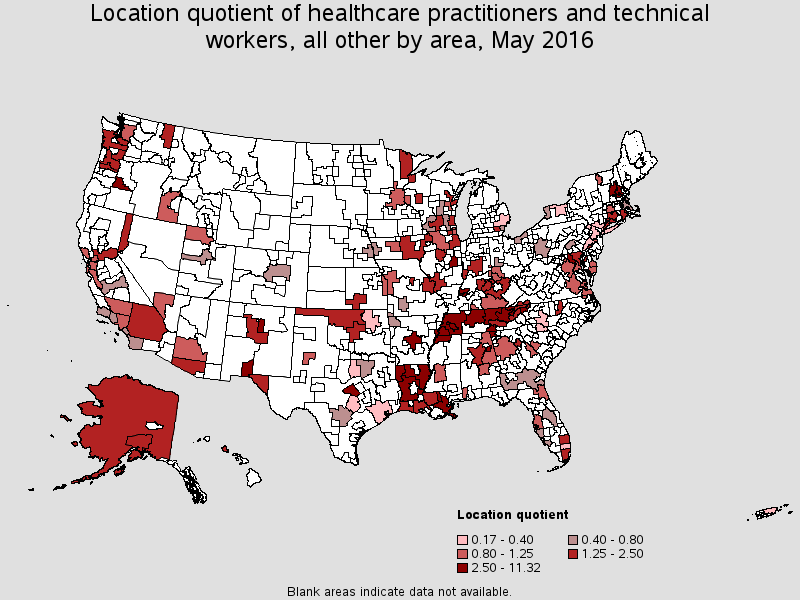
(9) The location quotient is the ratio of the area concentration of occupational employment to the national average concentration. A location quotient greater than one indicates the occupation has a higher share of employment than average, and a location quotient less than one indicates the occupation is less prevalent in the area than average.
Other OES estimates and related information:
May 2016 National Occupational Employment and Wage Estimates
May 2016 State Occupational Employment and Wage Estimates
May 2016 Metropolitan and Nonmetropolitan Area Occupational Employment and Wage Estimates
May 2016 National Industry-Specific Occupational Employment and Wage Estimates
Last Modified Date: March 31, 2017