
An official website of the United States government
An official website of the United States government
The .gov means it's official.
Federal government websites often end in .gov or .mil. Before sharing sensitive information,
make sure you're on a federal government site.
The site is secure.
The
https:// ensures that you are connecting to the official website and that any
information you provide is encrypted and transmitted securely.
Transcribe medical reports recorded by physicians and other healthcare practitioners using various electronic devices, covering office visits, emergency room visits, diagnostic imaging studies, operations, chart reviews, and final summaries. Transcribe dictated reports and translate abbreviations into fully understandable form. Edit as necessary and return reports in either printed or electronic form for review and signature, or correction.
Employment estimate and mean wage estimates for this occupation:
| Employment (1) | Employment RSE (3) |
Mean hourly wage |
Mean annual wage (2) |
Wage RSE (3) |
|---|---|---|---|---|
| 54,070 | 2.8 % | $17.86 | $37,150 | 1.1 % |
Percentile wage estimates for this occupation:
| Percentile | 10% | 25% | 50% (Median) |
75% | 90% |
|---|---|---|---|---|---|
| Hourly Wage | $10.73 | $13.78 | $17.17 | $21.01 | $24.83 |
| Annual Wage (2) | $22,330 | $28,660 | $35,720 | $43,700 | $51,640 |
Industries with the highest published employment and wages for this occupation are provided. For a list of all industries with employment in this occupation, see the Create Customized Tables function.
Industries with the highest levels of employment in this occupation:
| Industry | Employment (1) | Percent of industry employment | Hourly mean wage | Annual mean wage (2) |
|---|---|---|---|---|
| General Medical and Surgical Hospitals | 15,460 | 0.29 | $19.37 | $40,300 |
| Offices of Physicians | 13,690 | 0.54 | $18.05 | $37,550 |
| Business Support Services | 12,890 | 1.40 | $16.26 | $33,830 |
| Medical and Diagnostic Laboratories | 1,770 | 0.67 | $19.70 | $40,970 |
| Employment Services | 1,660 | 0.05 | $15.90 | $33,070 |
Industries with the highest concentration of employment in this occupation:
| Industry | Employment (1) | Percent of industry employment | Hourly mean wage | Annual mean wage (2) |
|---|---|---|---|---|
| Business Support Services | 12,890 | 1.40 | $16.26 | $33,830 |
| Medical and Diagnostic Laboratories | 1,770 | 0.67 | $19.70 | $40,970 |
| Offices of Physicians | 13,690 | 0.54 | $18.05 | $37,550 |
| General Medical and Surgical Hospitals | 15,460 | 0.29 | $19.37 | $40,300 |
| Office Administrative Services | 1,300 | 0.27 | $17.25 | $35,880 |
Top paying industries for this occupation:
| Industry | Employment (1) | Percent of industry employment | Hourly mean wage | Annual mean wage (2) |
|---|---|---|---|---|
| Specialty (except Psychiatric and Substance Abuse) Hospitals | 380 | 0.15 | $19.90 | $41,380 |
| Medical and Diagnostic Laboratories | 1,770 | 0.67 | $19.70 | $40,970 |
| Local Government (OES Designation) | 250 | (7) | $19.50 | $40,560 |
| General Medical and Surgical Hospitals | 15,460 | 0.29 | $19.37 | $40,300 |
| State Government (OES Designation) | 80 | (7) | $19.20 | $39,930 |
States and areas with the highest published employment, location quotients, and wages for this occupation are provided. For a list of all areas with employment in this occupation, see the Create Customized Tables function.
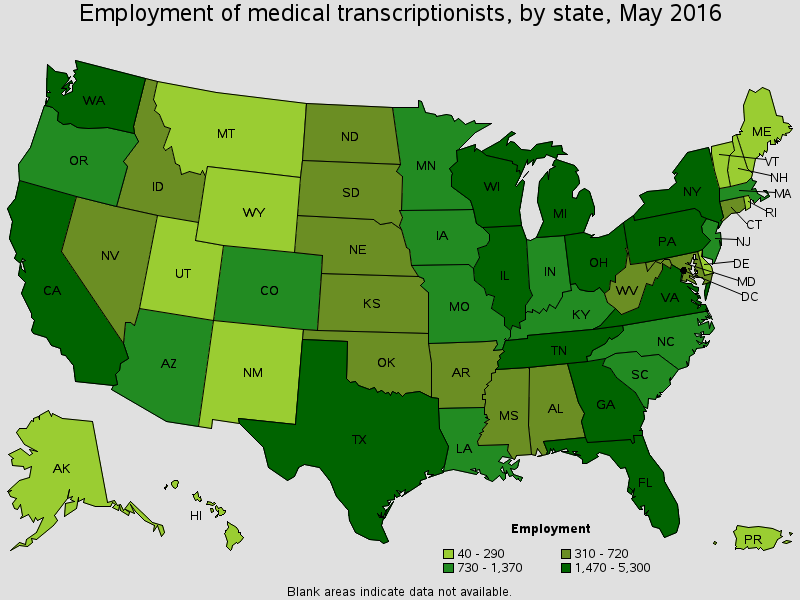
States with the highest employment level in this occupation:
| State | Employment (1) | Employment per thousand jobs | Location quotient (9) | Hourly mean wage | Annual mean wage (2) |
|---|---|---|---|---|---|
| Florida | 5,300 | 0.64 | 1.67 | $16.38 | $34,070 |
| Texas | 4,680 | 0.40 | 1.03 | $19.51 | $40,590 |
| California | 3,880 | 0.24 | 0.63 | $21.95 | $45,650 |
| Pennsylvania | 2,530 | 0.44 | 1.14 | $19.15 | $39,840 |
| New York | 2,190 | 0.24 | 0.62 | $18.75 | $39,000 |
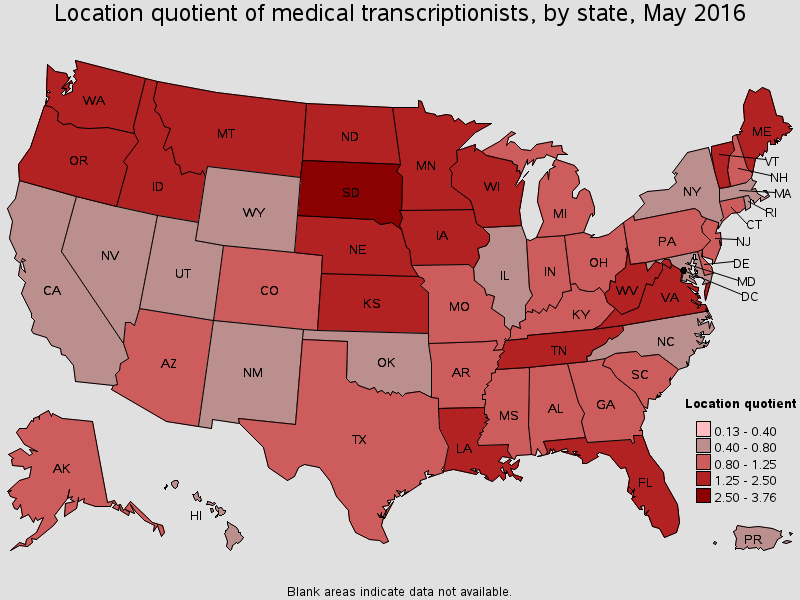
States with the highest concentration of jobs and location quotients in this occupation:
| State | Employment (1) | Employment per thousand jobs | Location quotient (9) | Hourly mean wage | Annual mean wage (2) |
|---|---|---|---|---|---|
| South Dakota | 610 | 1.45 | 3.76 | $15.11 | $31,420 |
| Idaho | 570 | 0.87 | 2.25 | $15.01 | $31,220 |
| North Dakota | 310 | 0.74 | 1.91 | $17.06 | $35,480 |
| Iowa | 1,010 | 0.66 | 1.71 | $16.23 | $33,750 |
| Florida | 5,300 | 0.64 | 1.67 | $16.38 | $34,070 |
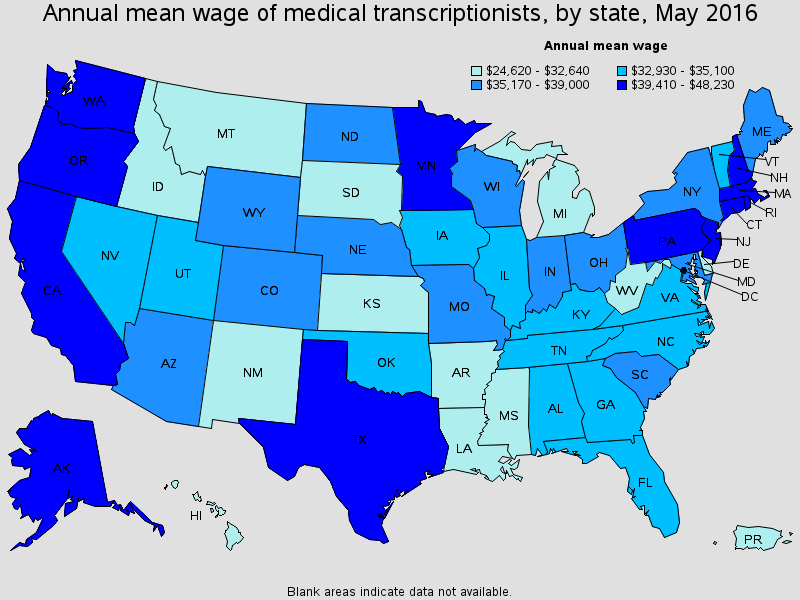
Top paying States for this occupation:
| State | Employment (1) | Employment per thousand jobs | Location quotient (9) | Hourly mean wage | Annual mean wage (2) |
|---|---|---|---|---|---|
| District of Columbia | 40 | 0.05 | 0.13 | $23.19 | $48,230 |
| Massachusetts | 730 | 0.21 | 0.55 | $22.94 | $47,710 |
| California | 3,880 | 0.24 | 0.63 | $21.95 | $45,650 |
| Washington | 1,620 | 0.53 | 1.37 | $21.87 | $45,480 |
| Alaska | 120 | 0.37 | 0.97 | $21.26 | $44,220 |
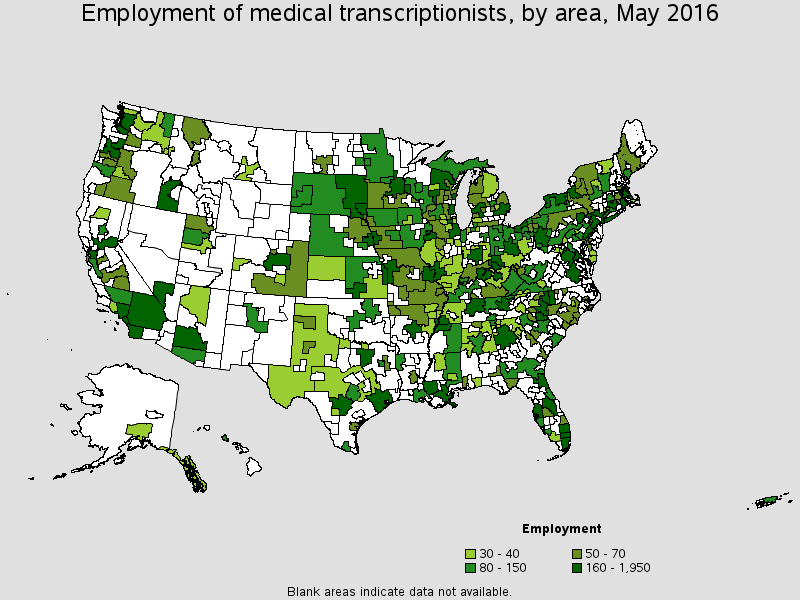
Metropolitan areas with the highest employment level in this occupation:
| Metropolitan area | Employment (1) | Employment per thousand jobs | Location quotient (9) | Hourly mean wage | Annual mean wage (2) |
|---|---|---|---|---|---|
| Tampa-St. Petersburg-Clearwater, FL | 1,630 | 1.29 | 3.34 | $18.23 | $37,910 |
| Orlando-Kissimmee-Sanford, FL | 1,300 | 1.11 | 2.88 | $13.78 | $28,670 |
| New York-Jersey City-White Plains, NY-NJ Metropolitan Division | 1,220 | 0.18 | 0.48 | $21.00 | $43,690 |
| Chicago-Naperville-Arlington Heights, IL Metropolitan Division | 1,000 | 0.28 | 0.71 | $16.74 | $34,830 |
| Atlanta-Sandy Springs-Roswell, GA | 980 | 0.38 | 1.00 | $17.14 | $35,650 |
| Los Angeles-Long Beach-Glendale, CA Metropolitan Division | 960 | 0.23 | 0.59 | $23.24 | $48,340 |
| Seattle-Bellevue-Everett, WA Metropolitan Division | 860 | 0.54 | 1.41 | $22.20 | $46,170 |
| Houston-The Woodlands-Sugar Land, TX | 750 | 0.25 | 0.66 | $22.73 | $47,280 |
| San Antonio-New Braunfels, TX | 740 | 0.76 | 1.98 | $11.03 | $22,930 |
| Dallas-Plano-Irving, TX Metropolitan Division | 710 | 0.29 | 0.75 | $29.27 | $60,870 |
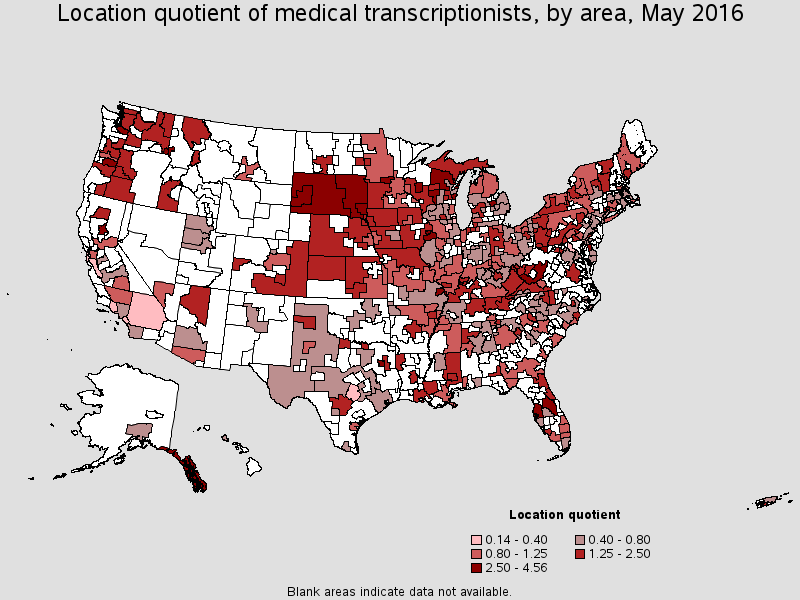
Metropolitan areas with the highest concentration of jobs and location quotients in this occupation:
| Metropolitan area | Employment (1) | Employment per thousand jobs | Location quotient (9) | Hourly mean wage | Annual mean wage (2) |
|---|---|---|---|---|---|
| Chico, CA | 130 | 1.76 | 4.56 | $22.15 | $46,080 |
| Rapid City, SD | 110 | 1.74 | 4.52 | $14.51 | $30,180 |
| Morgantown, WV | 90 | 1.36 | 3.54 | $16.25 | $33,800 |
| Sioux Falls, SD | 200 | 1.34 | 3.47 | $15.92 | $33,120 |
| Eau Claire, WI | 110 | 1.33 | 3.46 | $17.47 | $36,330 |
| Albany, OR | 60 | 1.33 | 3.45 | $20.19 | $41,990 |
| Lewiston, ID-WA | 30 | 1.32 | 3.43 | $17.95 | $37,340 |
| Tampa-St. Petersburg-Clearwater, FL | 1,630 | 1.29 | 3.34 | $18.23 | $37,910 |
| Saginaw, MI | 110 | 1.26 | 3.28 | $15.37 | $31,970 |
| Davenport-Moline-Rock Island, IA-IL | 220 | 1.23 | 3.20 | $11.74 | $24,430 |
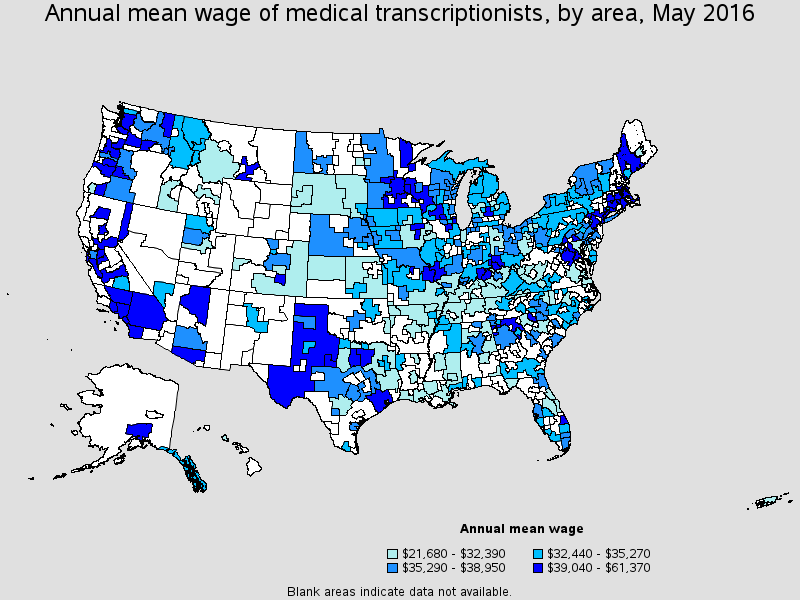
Top paying metropolitan areas for this occupation:
| Metropolitan area | Employment (1) | Employment per thousand jobs | Location quotient (9) | Hourly mean wage | Annual mean wage (2) |
|---|---|---|---|---|---|
| San Francisco-Redwood City-South San Francisco, CA Metropolitan Division | 60 | 0.06 | 0.14 | $29.51 | $61,370 |
| Dallas-Plano-Irving, TX Metropolitan Division | 710 | 0.29 | 0.75 | $29.27 | $60,870 |
| Redding, CA | 30 | 0.53 | 1.37 | $28.54 | $59,370 |
| Anchorage, AK | 40 | 0.23 | 0.60 | $26.47 | $55,060 |
| Boston-Cambridge-Newton, MA NECTA Division | 300 | 0.17 | 0.43 | $25.71 | $53,480 |
| Riverside-San Bernardino-Ontario, CA | 190 | 0.14 | 0.36 | $24.92 | $51,840 |
| Kennewick-Richland, WA | (8) | (8) | (8) | $24.78 | $51,550 |
| San Jose-Sunnyvale-Santa Clara, CA | 130 | 0.13 | 0.33 | $24.35 | $50,640 |
| Sacramento--Roseville--Arden-Arcade, CA | 390 | 0.43 | 1.11 | $23.73 | $49,350 |
| Stockton-Lodi, CA | (8) | (8) | (8) | $23.59 | $49,070 |
Nonmetropolitan areas with the highest employment in this occupation:
| Nonmetropolitan area | Employment (1) | Employment per thousand jobs | Location quotient (9) | Hourly mean wage | Annual mean wage (2) |
|---|---|---|---|---|---|
| Northeastern Wisconsin nonmetropolitan area | 220 | 1.08 | 2.81 | $17.89 | $37,210 |
| East South Dakota nonmetropolitan area | 190 | 1.44 | 3.73 | $14.68 | $30,530 |
| Southeast Iowa nonmetropolitan area | 140 | 0.59 | 1.53 | $15.24 | $31,710 |
| West Northwestern Ohio nonmetropolitan area | 130 | 0.52 | 1.34 | $12.31 | $25,610 |
| Northeast Kansas nonmetropolitan area | 110 | 0.76 | 1.97 | $15.07 | $31,340 |
Nonmetropolitan areas with the highest concentration of jobs and location quotients in this occupation:
| Nonmetropolitan area | Employment (1) | Employment per thousand jobs | Location quotient (9) | Hourly mean wage | Annual mean wage (2) |
|---|---|---|---|---|---|
| East South Dakota nonmetropolitan area | 190 | 1.44 | 3.73 | $14.68 | $30,530 |
| West South Dakota nonmetropolitan area | 80 | 1.32 | 3.42 | $14.84 | $30,870 |
| Southeast Alaska nonmetropolitan area | 40 | 1.25 | 3.25 | $16.27 | $33,830 |
| Northeastern Wisconsin nonmetropolitan area | 220 | 1.08 | 2.81 | $17.89 | $37,210 |
| Southern West Virginia nonmetropolitan area | 80 | 1.02 | 2.64 | $13.65 | $28,390 |
Top paying nonmetropolitan areas for this occupation:
| Nonmetropolitan area | Employment (1) | Employment per thousand jobs | Location quotient (9) | Hourly mean wage | Annual mean wage (2) |
|---|---|---|---|---|---|
| Southwest Maine nonmetropolitan area | 60 | 0.33 | 0.86 | $20.82 | $43,300 |
| North Georgia nonmetropolitan area | 40 | 0.22 | 0.57 | $19.54 | $40,650 |
| Western Wisconsin nonmetropolitan area | 100 | 0.73 | 1.89 | $19.31 | $40,170 |
| Southeast Minnesota nonmetropolitan area | 60 | 0.40 | 1.05 | $19.14 | $39,820 |
| West Texas nonmetropolitan area | 30 | 0.17 | 0.43 | $18.97 | $39,450 |
These estimates are calculated with data collected from employers in all industry sectors, all metropolitan and nonmetropolitan areas, and all states and the District of Columbia. The top employment and wage figures are provided above. The complete list is available in the downloadable XLS files.
The percentile wage estimate is the value of a wage below which a certain percent of workers fall. The median wage is the 50th percentile wage estimate--50 percent of workers earn less than the median and 50 percent of workers earn more than the median. More about percentile wages.
(1) Estimates for detailed occupations do not sum to the totals because the totals include occupations not shown separately. Estimates do not include self-employed workers.
(2) Annual wages have been calculated by multiplying the hourly mean wage by a "year-round, full-time" hours figure of 2,080 hours; for those occupations where there is not an hourly wage published, the annual wage has been directly calculated from the reported survey data.
(3) The relative standard error (RSE) is a measure of the reliability of a survey statistic. The smaller the relative standard error, the more precise the estimate.
(7) The value is less than .005 percent of industry employment.
(8) Estimate not released.
(9) The location quotient is the ratio of the area concentration of occupational employment to the national average concentration. A location quotient greater than one indicates the occupation has a higher share of employment than average, and a location quotient less than one indicates the occupation is less prevalent in the area than average.
Other OES estimates and related information:
May 2016 National Occupational Employment and Wage Estimates
May 2016 State Occupational Employment and Wage Estimates
May 2016 Metropolitan and Nonmetropolitan Area Occupational Employment and Wage Estimates
May 2016 National Industry-Specific Occupational Employment and Wage Estimates
Last Modified Date: March 31, 2017