
An official website of the United States government
An official website of the United States government
The .gov means it's official.
Federal government websites often end in .gov or .mil. Before sharing sensitive information,
make sure you're on a federal government site.
The site is secure.
The
https:// ensures that you are connecting to the official website and that any
information you provide is encrypted and transmitted securely.
Facilitate food service. Clean tables, remove dirty dishes, replace soiled table linens; set tables; replenish supply of clean linens, silverware, glassware, and dishes; supply service bar with food; and serve items such as water, condiments, and coffee to patrons.
Employment estimate and mean wage estimates for this occupation:
| Employment (1) | Employment RSE (3) |
Mean hourly wage |
Mean annual wage (2) |
Wage RSE (3) |
|---|---|---|---|---|
| 423,080 | 1.3 % | $10.74 | $22,340 | 0.5 % |
Percentile wage estimates for this occupation:
| Percentile | 10% | 25% | 50% (Median) |
75% | 90% |
|---|---|---|---|---|---|
| Hourly Wage | $8.31 | $8.90 | $9.71 | $11.42 | $14.61 |
| Annual Wage (2) | $17,280 | $18,510 | $20,200 | $23,740 | $30,390 |
Industries with the highest published employment and wages for this occupation are provided. For a list of all industries with employment in this occupation, see the Create Customized Tables function.
Industries with the highest levels of employment in this occupation:
| Industry | Employment (1) | Percent of industry employment | Hourly mean wage | Annual mean wage (2) |
|---|---|---|---|---|
| Restaurants and Other Eating Places | 273,830 | 2.66 | $10.44 | $21,720 |
| Traveler Accommodation | 53,270 | 2.77 | $12.18 | $25,340 |
| Special Food Services | 19,820 | 2.90 | $11.34 | $23,580 |
| Other Amusement and Recreation Industries | 11,730 | 0.95 | $10.75 | $22,350 |
| Elementary and Secondary Schools | 11,550 | 0.14 | $10.11 | $21,020 |
Industries with the highest concentration of employment in this occupation:
| Industry | Employment (1) | Percent of industry employment | Hourly mean wage | Annual mean wage (2) |
|---|---|---|---|---|
| Rooming and Boarding Houses | 680 | 5.54 | $9.87 | $20,530 |
| Drinking Places (Alcoholic Beverages) | 11,500 | 3.03 | $10.85 | $22,560 |
| Special Food Services | 19,820 | 2.90 | $11.34 | $23,580 |
| Traveler Accommodation | 53,270 | 2.77 | $12.18 | $25,340 |
| Restaurants and Other Eating Places | 273,830 | 2.66 | $10.44 | $21,720 |
Top paying industries for this occupation:
| Industry | Employment (1) | Percent of industry employment | Hourly mean wage | Annual mean wage (2) |
|---|---|---|---|---|
| Grantmaking and Giving Services | (8) | (8) | $18.30 | $38,060 |
| Legal Services | 50 | (7) | $15.41 | $32,060 |
| Consumer Goods Rental | (8) | (8) | $13.35 | $27,780 |
| Specialty (except Psychiatric and Substance Abuse) Hospitals | 90 | 0.03 | $12.39 | $25,760 |
| Promoters of Performing Arts, Sports, and Similar Events | 310 | 0.23 | $12.35 | $25,690 |
States and areas with the highest published employment, location quotients, and wages for this occupation are provided. For a list of all areas with employment in this occupation, see the Create Customized Tables function.
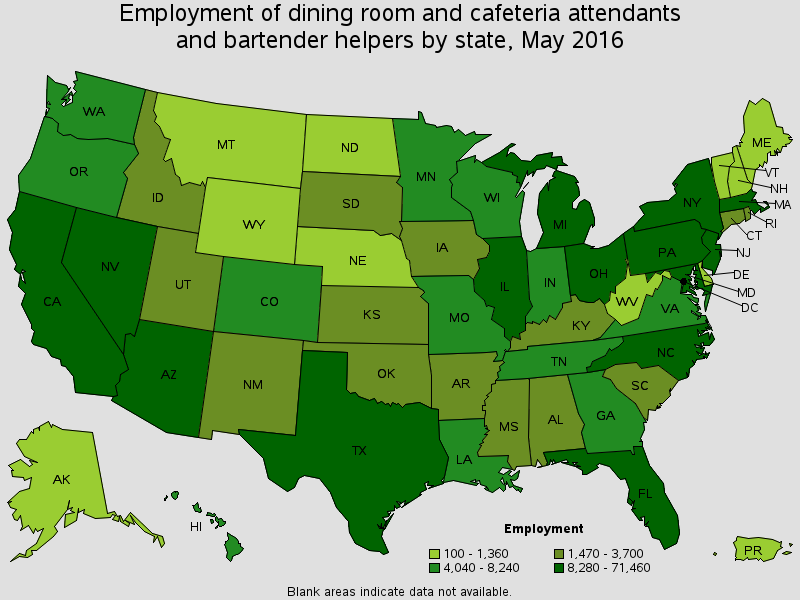
States with the highest employment level in this occupation:
| State | Employment (1) | Employment per thousand jobs | Location quotient (9) | Hourly mean wage | Annual mean wage (2) |
|---|---|---|---|---|---|
| California | 71,460 | 4.48 | 1.49 | $12.01 | $24,970 |
| Texas | 37,690 | 3.21 | 1.06 | $9.60 | $19,970 |
| Florida | 34,940 | 4.25 | 1.41 | $10.66 | $22,180 |
| New York | 33,390 | 3.67 | 1.22 | $12.43 | $25,860 |
| Illinois | 19,410 | 3.29 | 1.09 | $10.14 | $21,080 |
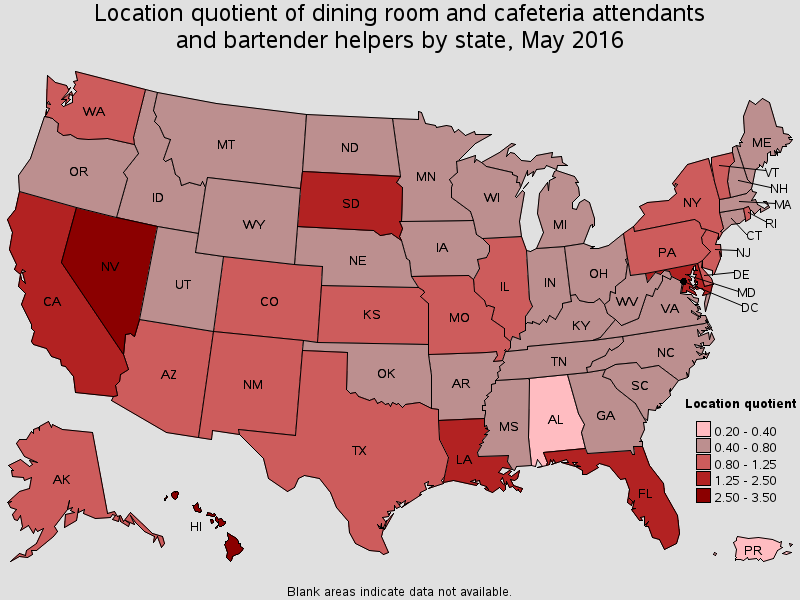
States with the highest concentration of jobs and location quotients in this occupation:
| State | Employment (1) | Employment per thousand jobs | Location quotient (9) | Hourly mean wage | Annual mean wage (2) |
|---|---|---|---|---|---|
| Nevada | 13,070 | 10.28 | 3.41 | $11.93 | $24,810 |
| Hawaii | 5,130 | 8.11 | 2.69 | $14.51 | $30,170 |
| South Dakota | 3,050 | 7.30 | 2.42 | $9.98 | $20,760 |
| District of Columbia | 4,730 | 6.73 | 2.23 | $13.44 | $27,960 |
| California | 71,460 | 4.48 | 1.49 | $12.01 | $24,970 |
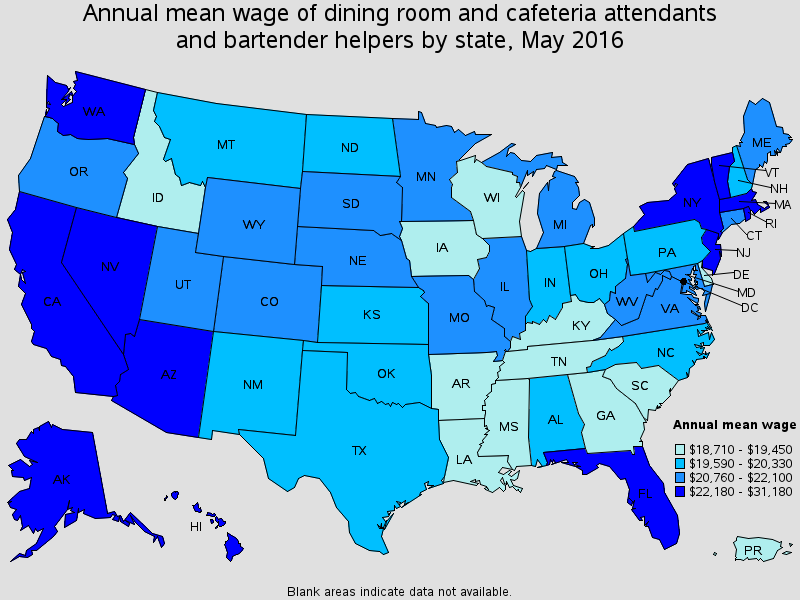
Top paying States for this occupation:
| State | Employment (1) | Employment per thousand jobs | Location quotient (9) | Hourly mean wage | Annual mean wage (2) |
|---|---|---|---|---|---|
| Hawaii | 5,130 | 8.11 | 2.69 | $14.51 | $30,170 |
| District of Columbia | 4,730 | 6.73 | 2.23 | $13.44 | $27,960 |
| New York | 33,390 | 3.67 | 1.22 | $12.43 | $25,860 |
| Alaska | 920 | 2.83 | 0.94 | $12.35 | $25,700 |
| Washington | 8,240 | 2.69 | 0.89 | $12.22 | $25,420 |
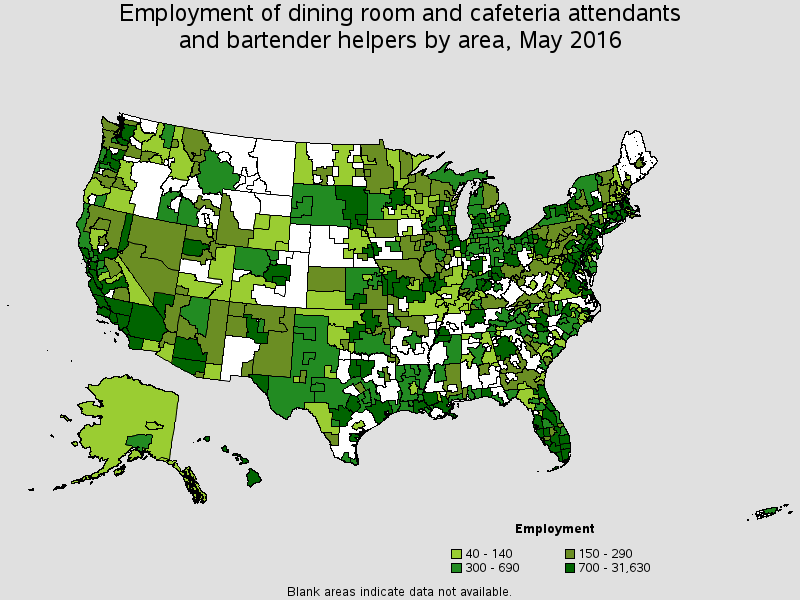
Metropolitan areas with the highest employment level in this occupation:
| Metropolitan area | Employment (1) | Employment per thousand jobs | Location quotient (9) | Hourly mean wage | Annual mean wage (2) |
|---|---|---|---|---|---|
| New York-Jersey City-White Plains, NY-NJ Metropolitan Division | 25,050 | 3.80 | 1.26 | $12.67 | $26,360 |
| Los Angeles-Long Beach-Glendale, CA Metropolitan Division | 20,700 | 4.91 | 1.63 | $11.35 | $23,620 |
| Chicago-Naperville-Arlington Heights, IL Metropolitan Division | 12,830 | 3.53 | 1.17 | $10.22 | $21,250 |
| Las Vegas-Henderson-Paradise, NV | 11,480 | 12.27 | 4.07 | $12.36 | $25,700 |
| Washington-Arlington-Alexandria, DC-VA-MD-WV Metropolitan Division | 10,600 | 4.25 | 1.41 | $11.98 | $24,930 |
| Houston-The Woodlands-Sugar Land, TX | 9,940 | 3.39 | 1.12 | $9.80 | $20,390 |
| Dallas-Plano-Irving, TX Metropolitan Division | 8,700 | 3.58 | 1.19 | $10.13 | $21,070 |
| Anaheim-Santa Ana-Irvine, CA Metropolitan Division | 7,850 | 5.02 | 1.67 | $11.68 | $24,290 |
| San Diego-Carlsbad, CA | 7,770 | 5.60 | 1.86 | $11.79 | $24,520 |
| Orlando-Kissimmee-Sanford, FL | 7,140 | 6.10 | 2.03 | $11.78 | $24,500 |
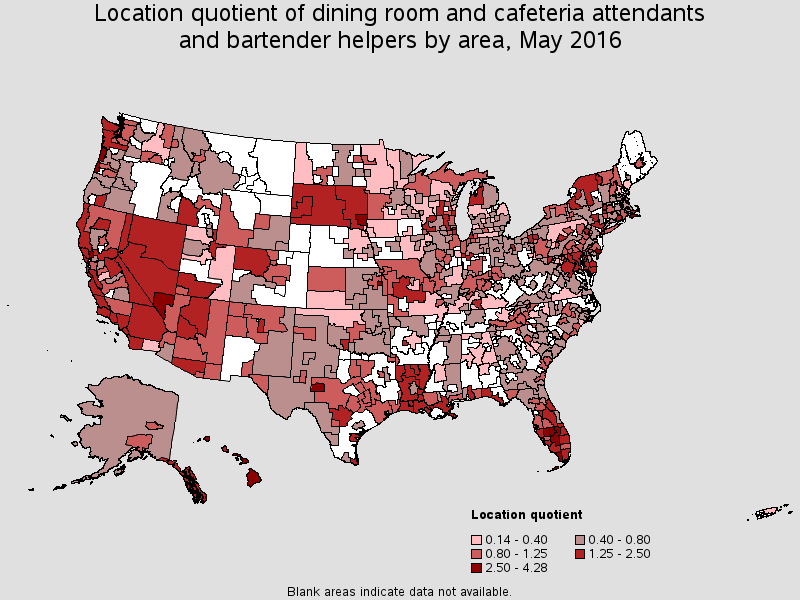
Metropolitan areas with the highest concentration of jobs and location quotients in this occupation:
| Metropolitan area | Employment (1) | Employment per thousand jobs | Location quotient (9) | Hourly mean wage | Annual mean wage (2) |
|---|---|---|---|---|---|
| Atlantic City-Hammonton, NJ | 1,620 | 12.89 | 4.28 | $11.28 | $23,460 |
| Las Vegas-Henderson-Paradise, NV | 11,480 | 12.27 | 4.07 | $12.36 | $25,700 |
| Kahului-Wailuku-Lahaina, HI | 830 | 11.47 | 3.81 | $18.34 | $38,140 |
| Ocean City, NJ | 380 | 10.00 | 3.32 | $10.46 | $21,750 |
| Lawrence, KS | 500 | 10.00 | 3.32 | $8.46 | $17,590 |
| Sioux Falls, SD | 1,340 | 9.00 | 2.99 | $10.17 | $21,150 |
| San Angelo, TX | 380 | 8.15 | 2.70 | $8.80 | $18,310 |
| Napa, CA | 550 | 7.83 | 2.60 | $14.09 | $29,310 |
| Sebring, FL | 190 | 7.70 | 2.56 | $9.32 | $19,390 |
| Norwich-New London-Westerly, CT-RI | 940 | 7.41 | 2.46 | $10.16 | $21,140 |
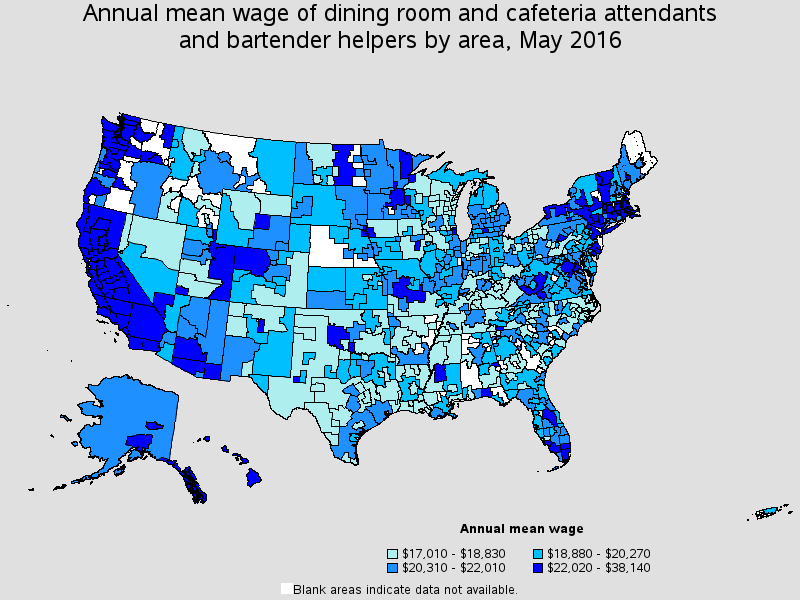
Top paying metropolitan areas for this occupation:
| Metropolitan area | Employment (1) | Employment per thousand jobs | Location quotient (9) | Hourly mean wage | Annual mean wage (2) |
|---|---|---|---|---|---|
| Kahului-Wailuku-Lahaina, HI | 830 | 11.47 | 3.81 | $18.34 | $38,140 |
| San Francisco-Redwood City-South San Francisco, CA Metropolitan Division | 5,150 | 4.83 | 1.60 | $15.35 | $31,920 |
| Mount Vernon-Anacortes, WA | 150 | 3.35 | 1.11 | $14.38 | $29,900 |
| San Rafael, CA Metropolitan Division | 620 | 5.51 | 1.83 | $14.17 | $29,480 |
| Napa, CA | 550 | 7.83 | 2.60 | $14.09 | $29,310 |
| Salinas, CA | 820 | 4.99 | 1.65 | $13.85 | $28,810 |
| Anchorage, AK | 530 | 3.03 | 1.00 | $13.43 | $27,930 |
| Seattle-Bellevue-Everett, WA Metropolitan Division | 4,060 | 2.56 | 0.85 | $13.07 | $27,190 |
| Santa Rosa, CA | 1,110 | 5.71 | 1.90 | $13.04 | $27,130 |
| San Jose-Sunnyvale-Santa Clara, CA | 4,290 | 4.10 | 1.36 | $12.98 | $27,000 |
Nonmetropolitan areas with the highest employment in this occupation:
| Nonmetropolitan area | Employment (1) | Employment per thousand jobs | Location quotient (9) | Hourly mean wage | Annual mean wage (2) |
|---|---|---|---|---|---|
| South Central Wisconsin nonmetropolitan area | 910 | 4.39 | 1.46 | $8.65 | $17,990 |
| Hawaii / Kauai nonmetropolitan area | 880 | 9.11 | 3.02 | $17.82 | $37,070 |
| East South Dakota nonmetropolitan area | 840 | 6.33 | 2.10 | $9.84 | $20,460 |
| South Florida nonmetropolitan area | 740 | 9.68 | 3.21 | $10.58 | $22,000 |
| Central Missouri nonmetropolitan area | 730 | 4.64 | 1.54 | $15.20 | $31,610 |
Nonmetropolitan areas with the highest concentration of jobs and location quotients in this occupation:
| Nonmetropolitan area | Employment (1) | Employment per thousand jobs | Location quotient (9) | Hourly mean wage | Annual mean wage (2) |
|---|---|---|---|---|---|
| Nantucket Island and Martha's Vineyard nonmetropolitan area | 180 | 10.35 | 3.44 | $11.48 | $23,870 |
| North Coast Oregon nonmetropolitan area | 440 | 10.12 | 3.36 | $10.03 | $20,870 |
| South Florida nonmetropolitan area | 740 | 9.68 | 3.21 | $10.58 | $22,000 |
| Hawaii / Kauai nonmetropolitan area | 880 | 9.11 | 3.02 | $17.82 | $37,070 |
| Upper Eastern Shore of Maryland nonmetropolitan area | 330 | 7.02 | 2.33 | $9.35 | $19,440 |
Top paying nonmetropolitan areas for this occupation:
| Nonmetropolitan area | Employment (1) | Employment per thousand jobs | Location quotient (9) | Hourly mean wage | Annual mean wage (2) |
|---|---|---|---|---|---|
| Hawaii / Kauai nonmetropolitan area | 880 | 9.11 | 3.02 | $17.82 | $37,070 |
| Central Missouri nonmetropolitan area | 730 | 4.64 | 1.54 | $15.20 | $31,610 |
| Southern Vermont nonmetropolitan area | 230 | 2.18 | 0.72 | $12.17 | $25,300 |
| North Coast Region of California nonmetropolitan area | 390 | 4.05 | 1.34 | $12.13 | $25,230 |
| Eastern Sierra Region of California nonmetropolitan area | 90 | 6.61 | 2.19 | $12.11 | $25,180 |
These estimates are calculated with data collected from employers in all industry sectors, all metropolitan and nonmetropolitan areas, and all states and the District of Columbia. The top employment and wage figures are provided above. The complete list is available in the downloadable XLS files.
The percentile wage estimate is the value of a wage below which a certain percent of workers fall. The median wage is the 50th percentile wage estimate--50 percent of workers earn less than the median and 50 percent of workers earn more than the median. More about percentile wages.
(1) Estimates for detailed occupations do not sum to the totals because the totals include occupations not shown separately. Estimates do not include self-employed workers.
(2) Annual wages have been calculated by multiplying the hourly mean wage by a "year-round, full-time" hours figure of 2,080 hours; for those occupations where there is not an hourly wage published, the annual wage has been directly calculated from the reported survey data.
(3) The relative standard error (RSE) is a measure of the reliability of a survey statistic. The smaller the relative standard error, the more precise the estimate.
(7) The value is less than .005 percent of industry employment.
(8) Estimate not released.
(9) The location quotient is the ratio of the area concentration of occupational employment to the national average concentration. A location quotient greater than one indicates the occupation has a higher share of employment than average, and a location quotient less than one indicates the occupation is less prevalent in the area than average.
Other OES estimates and related information:
May 2016 National Occupational Employment and Wage Estimates
May 2016 State Occupational Employment and Wage Estimates
May 2016 Metropolitan and Nonmetropolitan Area Occupational Employment and Wage Estimates
May 2016 National Industry-Specific Occupational Employment and Wage Estimates
Last Modified Date: March 31, 2017