
An official website of the United States government
An official website of the United States government
The .gov means it's official.
Federal government websites often end in .gov or .mil. Before sharing sensitive information,
make sure you're on a federal government site.
The site is secure.
The
https:// ensures that you are connecting to the official website and that any
information you provide is encrypted and transmitted securely.
Assist the elderly, convalescents, or persons with disabilities with daily living activities at the person's home or in a care facility. Duties performed at a place of residence may include keeping house (making beds, doing laundry, washing dishes) and preparing meals. May provide assistance at non-residential care facilities. May advise families, the elderly, convalescents, and persons with disabilities regarding such things as nutrition, cleanliness, and household activities.
Employment estimate and mean wage estimates for this occupation:
| Employment (1) | Employment RSE (3) |
Mean hourly wage |
Mean annual wage (2) |
Wage RSE (3) |
|---|---|---|---|---|
| 1,492,250 | 0.8 % | $10.92 | $22,710 | 0.3 % |
Percentile wage estimates for this occupation:
| Percentile | 10% | 25% | 50% (Median) |
75% | 90% |
|---|---|---|---|---|---|
| Hourly Wage | $8.32 | $9.22 | $10.54 | $11.95 | $14.31 |
| Annual Wage (2) | $17,310 | $19,180 | $21,920 | $24,860 | $29,760 |
Industries with the highest published employment and wages for this occupation are provided. For a list of all industries with employment in this occupation, see the Create Customized Tables function.
Industries with the highest levels of employment in this occupation:
| Industry | Employment (1) | Percent of industry employment | Hourly mean wage | Annual mean wage (2) |
|---|---|---|---|---|
| Individual and Family Services | 640,670 | 37.94 | $10.87 | $22,610 |
| Home Health Care Services | 307,150 | 22.67 | $10.03 | $20,850 |
| Residential Intellectual and Developmental Disability, Mental Health, and Substance Abuse Facilities | 190,530 | 31.10 | $11.30 | $23,490 |
| Continuing Care Retirement Communities and Assisted Living Facilities for the Elderly | 144,270 | 16.24 | $11.11 | $23,110 |
| Vocational Rehabilitation Services | 50,180 | 15.19 | $11.12 | $23,120 |
Industries with the highest concentration of employment in this occupation:
| Industry | Employment (1) | Percent of industry employment | Hourly mean wage | Annual mean wage (2) |
|---|---|---|---|---|
| Individual and Family Services | 640,670 | 37.94 | $10.87 | $22,610 |
| Residential Intellectual and Developmental Disability, Mental Health, and Substance Abuse Facilities | 190,530 | 31.10 | $11.30 | $23,490 |
| Home Health Care Services | 307,150 | 22.67 | $10.03 | $20,850 |
| Continuing Care Retirement Communities and Assisted Living Facilities for the Elderly | 144,270 | 16.24 | $11.11 | $23,110 |
| Vocational Rehabilitation Services | 50,180 | 15.19 | $11.12 | $23,120 |
Top paying industries for this occupation:
| Industry | Employment (1) | Percent of industry employment | Hourly mean wage | Annual mean wage (2) |
|---|---|---|---|---|
| State Government (OES Designation) | 15,720 | 0.72 | $17.76 | $36,930 |
| Other Investment Pools and Funds | 180 | 3.18 | $17.14 | $35,640 |
| Other Financial Investment Activities | 450 | 0.10 | $16.10 | $33,490 |
| Religious Organizations | 300 | 0.16 | $14.97 | $31,130 |
| Colleges, Universities, and Professional Schools | 130 | (7) | $13.75 | $28,590 |
States and areas with the highest published employment, location quotients, and wages for this occupation are provided. For a list of all areas with employment in this occupation, see the Create Customized Tables function.
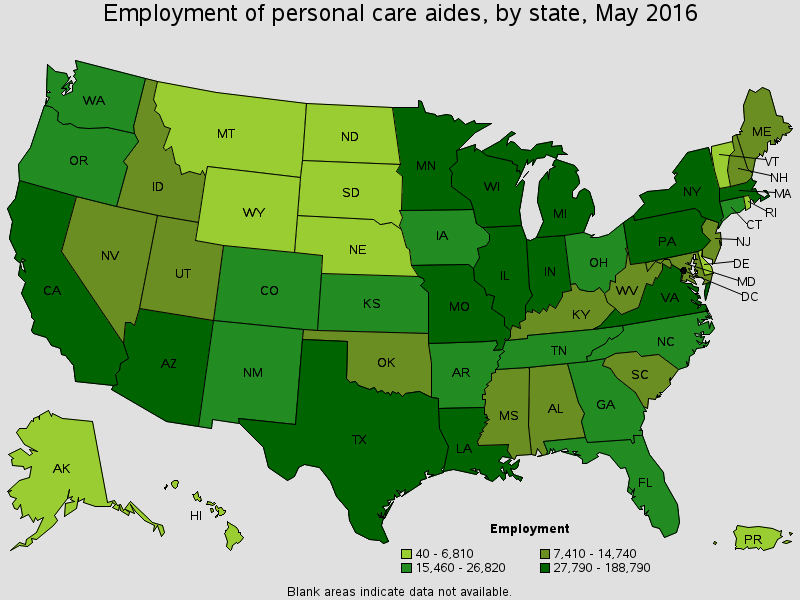
States with the highest employment level in this occupation:
| State | Employment (1) | Employment per thousand jobs | Location quotient (9) | Hourly mean wage | Annual mean wage (2) |
|---|---|---|---|---|---|
| Texas | 188,790 | 16.07 | 1.51 | $8.95 | $18,620 |
| New York | 156,830 | 17.24 | 1.62 | $12.27 | $25,510 |
| California | 144,310 | 9.04 | 0.85 | $12.09 | $25,150 |
| Pennsylvania | 92,040 | 16.01 | 1.51 | $10.96 | $22,810 |
| Minnesota | 67,420 | 23.99 | 2.26 | $11.83 | $24,610 |
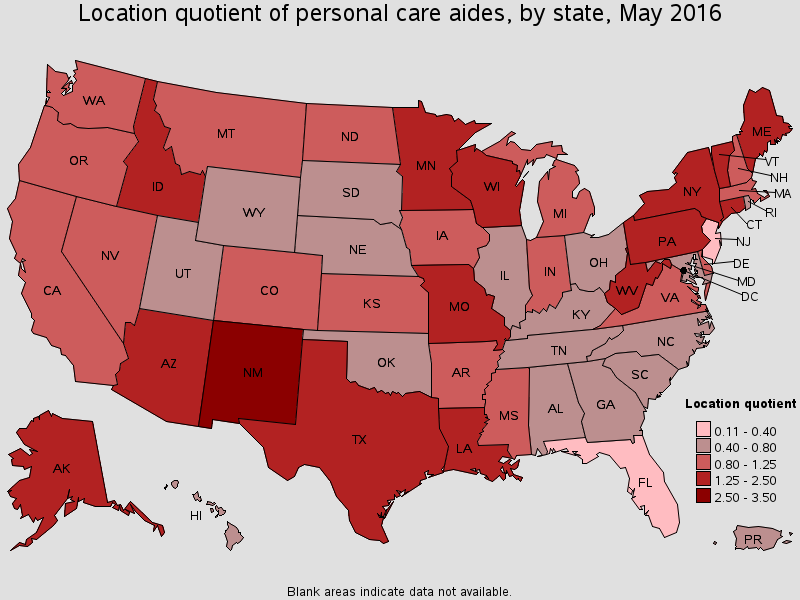
States with the highest concentration of jobs and location quotients in this occupation:
| State | Employment (1) | Employment per thousand jobs | Location quotient (9) | Hourly mean wage | Annual mean wage (2) |
|---|---|---|---|---|---|
| New Mexico | 23,940 | 29.72 | 2.80 | $9.63 | $20,020 |
| Minnesota | 67,420 | 23.99 | 2.26 | $11.83 | $24,610 |
| Maine | 13,340 | 22.37 | 2.10 | $10.92 | $22,710 |
| Vermont | 6,680 | 21.94 | 2.06 | $13.52 | $28,120 |
| Wisconsin | 59,690 | 21.28 | 2.00 | $10.77 | $22,400 |
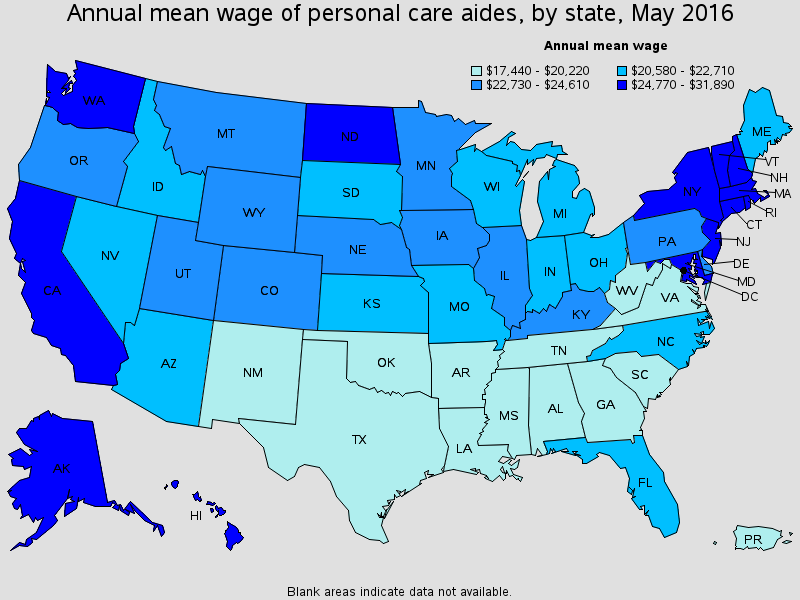
Top paying States for this occupation:
| State | Employment (1) | Employment per thousand jobs | Location quotient (9) | Hourly mean wage | Annual mean wage (2) |
|---|---|---|---|---|---|
| North Dakota | 4,940 | 11.62 | 1.09 | $15.33 | $31,890 |
| Alaska | 4,900 | 15.16 | 1.43 | $15.19 | $31,600 |
| New Jersey | 10,460 | 2.64 | 0.25 | $13.78 | $28,670 |
| Massachusetts | 42,190 | 12.19 | 1.15 | $13.59 | $28,260 |
| Vermont | 6,680 | 21.94 | 2.06 | $13.52 | $28,120 |
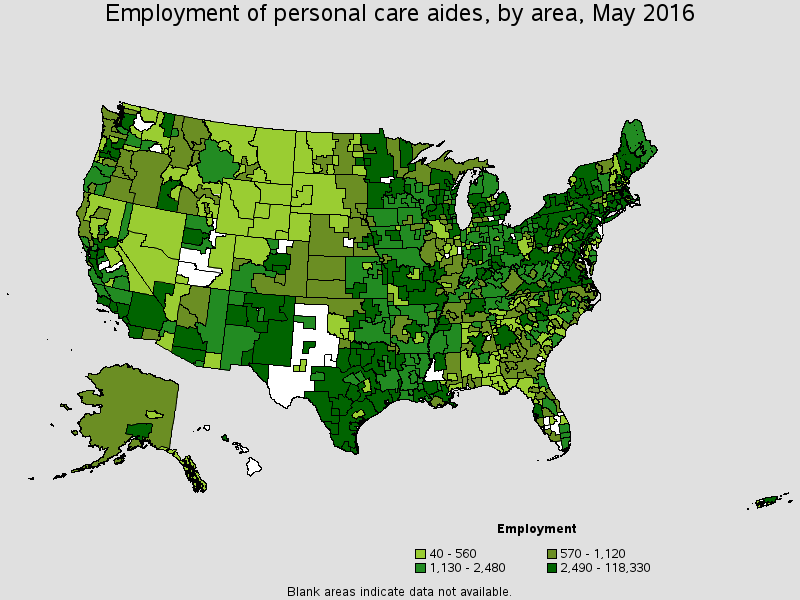
Metropolitan areas with the highest employment level in this occupation:
| Metropolitan area | Employment (1) | Employment per thousand jobs | Location quotient (9) | Hourly mean wage | Annual mean wage (2) |
|---|---|---|---|---|---|
| New York-Jersey City-White Plains, NY-NJ Metropolitan Division | 88,660 | 13.46 | 1.27 | $11.85 | $24,650 |
| Minneapolis-St. Paul-Bloomington, MN-WI | 45,900 | 24.03 | 2.26 | $11.91 | $24,780 |
| Los Angeles-Long Beach-Glendale, CA Metropolitan Division | 40,540 | 9.61 | 0.90 | $12.39 | $25,770 |
| Houston-The Woodlands-Sugar Land, TX | 34,030 | 11.59 | 1.09 | $9.10 | $18,940 |
| Chicago-Naperville-Arlington Heights, IL Metropolitan Division | 32,260 | 8.87 | 0.83 | $11.06 | $23,000 |
| Milwaukee-Waukesha-West Allis, WI | 26,210 | 31.17 | 2.93 | $10.80 | $22,460 |
| Phoenix-Mesa-Scottsdale, AZ | 25,490 | 13.17 | 1.24 | $10.73 | $22,310 |
| Nassau County-Suffolk County, NY Metropolitan Division | 23,770 | 18.48 | 1.74 | $12.70 | $26,410 |
| San Antonio-New Braunfels, TX | 22,030 | 22.54 | 2.12 | $8.83 | $18,360 |
| McAllen-Edinburg-Mission, TX | 20,720 | 82.96 | 7.81 | $8.62 | $17,930 |
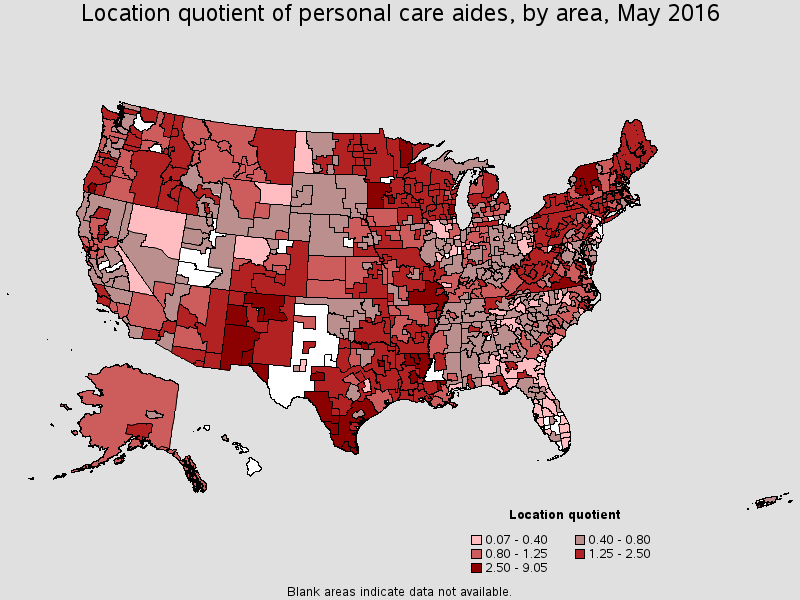
Metropolitan areas with the highest concentration of jobs and location quotients in this occupation:
| Metropolitan area | Employment (1) | Employment per thousand jobs | Location quotient (9) | Hourly mean wage | Annual mean wage (2) |
|---|---|---|---|---|---|
| Brownsville-Harlingen, TX | 13,240 | 96.16 | 9.05 | $8.71 | $18,110 |
| McAllen-Edinburg-Mission, TX | 20,720 | 82.96 | 7.81 | $8.62 | $17,930 |
| Laredo, TX | 5,890 | 60.36 | 5.68 | $8.63 | $17,950 |
| Mankato-North Mankato, MN | 2,480 | 48.05 | 4.52 | $13.30 | $27,660 |
| Las Cruces, NM | 2,940 | 41.75 | 3.93 | $9.05 | $18,830 |
| Alexandria, LA | 2,300 | 37.67 | 3.54 | $9.90 | $20,590 |
| Hammond, LA | 1,560 | 37.42 | 3.52 | $8.66 | $18,010 |
| Sherman-Denison, TX | 1,600 | 37.03 | 3.48 | $8.76 | $18,220 |
| Grants Pass, OR | 810 | 33.61 | 3.16 | $11.28 | $23,450 |
| Glens Falls, NY | 1,680 | 32.67 | 3.07 | $12.26 | $25,500 |
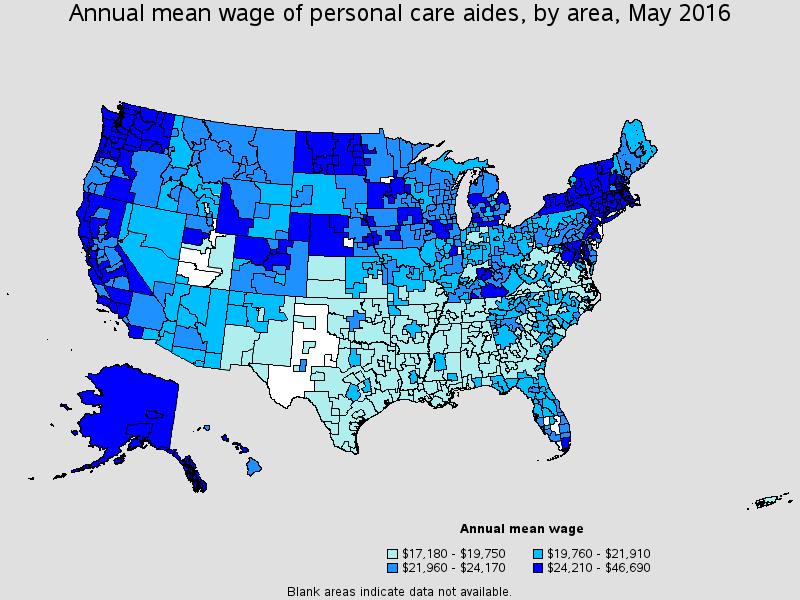
Top paying metropolitan areas for this occupation:
| Metropolitan area | Employment (1) | Employment per thousand jobs | Location quotient (9) | Hourly mean wage | Annual mean wage (2) |
|---|---|---|---|---|---|
| Bismarck, ND | 1,010 | 13.55 | 1.28 | $15.55 | $32,350 |
| Barnstable Town, MA | 1,160 | 11.38 | 1.07 | $14.97 | $31,130 |
| Anchorage, AK | 3,620 | 20.55 | 1.93 | $14.95 | $31,100 |
| Fairbanks, AK | 280 | 7.60 | 0.72 | $14.89 | $30,970 |
| Camden, NJ Metropolitan Division | 1,680 | 3.25 | 0.31 | $14.47 | $30,100 |
| Dutchess County-Putnam County, NY Metropolitan Division | 2,900 | 20.82 | 1.96 | $14.40 | $29,950 |
| Newark, NJ-PA Metropolitan Division | 3,000 | 2.59 | 0.24 | $14.26 | $29,670 |
| Norwich-New London-Westerly, CT-RI | 1,140 | 8.95 | 0.84 | $14.16 | $29,460 |
| Kingston, NY | 1,150 | 19.59 | 1.84 | $14.04 | $29,200 |
| Worcester, MA-CT | 4,700 | 16.95 | 1.59 | $14.02 | $29,160 |
Nonmetropolitan areas with the highest employment in this occupation:
| Nonmetropolitan area | Employment (1) | Employment per thousand jobs | Location quotient (9) | Hourly mean wage | Annual mean wage (2) |
|---|---|---|---|---|---|
| Southeast Missouri nonmetropolitan area | 6,430 | 39.76 | 3.74 | $9.23 | $19,200 |
| North Texas nonmetropolitan area | 4,950 | 18.58 | 1.75 | $8.62 | $17,940 |
| Coastal Plains Region of Texas nonmetropolitan area | 4,430 | 30.11 | 2.83 | $8.97 | $18,650 |
| Southwest Maine nonmetropolitan area | 4,330 | 22.68 | 2.13 | $11.02 | $22,920 |
| Capital/Northern New York nonmetropolitan area | 4,270 | 29.64 | 2.79 | $12.89 | $26,810 |
Nonmetropolitan areas with the highest concentration of jobs and location quotients in this occupation:
| Nonmetropolitan area | Employment (1) | Employment per thousand jobs | Location quotient (9) | Hourly mean wage | Annual mean wage (2) |
|---|---|---|---|---|---|
| North and West Central New Mexico nonmetropolitan area | 4,090 | 64.24 | 6.04 | $9.86 | $20,500 |
| Border Region of Texas nonmetropolitan area | 3,040 | 52.71 | 4.96 | $8.44 | $17,560 |
| Southwestern New Mexico nonmetropolitan area | 1,180 | 44.00 | 4.14 | $9.08 | $18,880 |
| North Central Massachusetts nonmetropolitan area | 250 | 40.51 | 3.81 | $13.36 | $27,780 |
| Southeast Missouri nonmetropolitan area | 6,430 | 39.76 | 3.74 | $9.23 | $19,200 |
Top paying nonmetropolitan areas for this occupation:
| Nonmetropolitan area | Employment (1) | Employment per thousand jobs | Location quotient (9) | Hourly mean wage | Annual mean wage (2) |
|---|---|---|---|---|---|
| Nantucket Island and Martha's Vineyard nonmetropolitan area | (8) | (8) | (8) | $22.45 | $46,690 |
| Far West North Dakota nonmetropolitan area | 190 | 2.92 | 0.27 | $18.47 | $38,430 |
| Southeast Alaska nonmetropolitan area | 310 | 8.94 | 0.84 | $16.46 | $34,240 |
| East Central North Dakota nonmetropolitan area | 850 | 20.95 | 1.97 | $16.11 | $33,510 |
| Balance of Alaska nonmetropolitan area | 690 | 9.31 | 0.88 | $16.01 | $33,300 |
These estimates are calculated with data collected from employers in all industry sectors, all metropolitan and nonmetropolitan areas, and all states and the District of Columbia. The top employment and wage figures are provided above. The complete list is available in the downloadable XLS files.
The percentile wage estimate is the value of a wage below which a certain percent of workers fall. The median wage is the 50th percentile wage estimate--50 percent of workers earn less than the median and 50 percent of workers earn more than the median. More about percentile wages.
(1) Estimates for detailed occupations do not sum to the totals because the totals include occupations not shown separately. Estimates do not include self-employed workers.
(2) Annual wages have been calculated by multiplying the hourly mean wage by a "year-round, full-time" hours figure of 2,080 hours; for those occupations where there is not an hourly wage published, the annual wage has been directly calculated from the reported survey data.
(3) The relative standard error (RSE) is a measure of the reliability of a survey statistic. The smaller the relative standard error, the more precise the estimate.
(7) The value is less than .005 percent of industry employment.
(8) Estimate not released.
(9) The location quotient is the ratio of the area concentration of occupational employment to the national average concentration. A location quotient greater than one indicates the occupation has a higher share of employment than average, and a location quotient less than one indicates the occupation is less prevalent in the area than average.
Other OES estimates and related information:
May 2016 National Occupational Employment and Wage Estimates
May 2016 State Occupational Employment and Wage Estimates
May 2016 Metropolitan and Nonmetropolitan Area Occupational Employment and Wage Estimates
May 2016 National Industry-Specific Occupational Employment and Wage Estimates
Last Modified Date: March 31, 2017