
An official website of the United States government
An official website of the United States government
The .gov means it's official.
Federal government websites often end in .gov or .mil. Before sharing sensitive information,
make sure you're on a federal government site.
The site is secure.
The
https:// ensures that you are connecting to the official website and that any
information you provide is encrypted and transmitted securely.
Instruct or coach groups or individuals in exercise activities. Demonstrate techniques and form, observe participants, and explain to them corrective measures necessary to improve their skills. Excludes teachers classified in 25-0000 Education, Training, and Library Occupations. Excludes "Coaches and Scouts" (27-2022) and "Athletic Trainers" (29-9091).
Employment estimate and mean wage estimates for this occupation:
| Employment (1) | Employment RSE (3) |
Mean hourly wage |
Mean annual wage (2) |
Wage RSE (3) |
|---|---|---|---|---|
| 257,410 | 1.3 % | $20.57 | $42,780 | 0.8 % |
Percentile wage estimates for this occupation:
| Percentile | 10% | 25% | 50% (Median) |
75% | 90% |
|---|---|---|---|---|---|
| Hourly Wage | $9.21 | $11.60 | $18.34 | $26.45 | $35.09 |
| Annual Wage (2) | $19,150 | $24,120 | $38,160 | $55,010 | $72,980 |
Industries with the highest published employment and wages for this occupation are provided. For a list of all industries with employment in this occupation, see the Create Customized Tables function.
Industries with the highest levels of employment in this occupation:
| Industry | Employment (1) | Percent of industry employment | Hourly mean wage | Annual mean wage (2) |
|---|---|---|---|---|
| Other Amusement and Recreation Industries | 174,250 | 14.12 | $21.22 | $44,130 |
| Civic and Social Organizations | 33,290 | 8.68 | $18.04 | $37,520 |
| Local Government (OES Designation) | 11,460 | 0.21 | $18.42 | $38,310 |
| Other Schools and Instruction | 10,550 | 2.55 | $20.71 | $43,070 |
| Other Personal Services | 4,350 | 1.39 | $18.65 | $38,800 |
Industries with the highest concentration of employment in this occupation:
| Industry | Employment (1) | Percent of industry employment | Hourly mean wage | Annual mean wage (2) |
|---|---|---|---|---|
| Other Amusement and Recreation Industries | 174,250 | 14.12 | $21.22 | $44,130 |
| Civic and Social Organizations | 33,290 | 8.68 | $18.04 | $37,520 |
| Other Schools and Instruction | 10,550 | 2.55 | $20.71 | $43,070 |
| Other Personal Services | 4,350 | 1.39 | $18.65 | $38,800 |
| Spectator Sports | 470 | 0.33 | $15.96 | $33,200 |
Top paying industries for this occupation:
| Industry | Employment (1) | Percent of industry employment | Hourly mean wage | Annual mean wage (2) |
|---|---|---|---|---|
| Performing Arts Companies | (8) | (8) | $31.47 | $65,460 |
| Technical and Trade Schools | (8) | (8) | $29.51 | $61,390 |
| Lessors of Real Estate | (8) | (8) | $27.98 | $58,200 |
| Social Advocacy Organizations | 100 | 0.05 | $27.36 | $56,910 |
| Specialty (except Psychiatric and Substance Abuse) Hospitals | 70 | 0.03 | $25.78 | $53,620 |
States and areas with the highest published employment, location quotients, and wages for this occupation are provided. For a list of all areas with employment in this occupation, see the Create Customized Tables function.
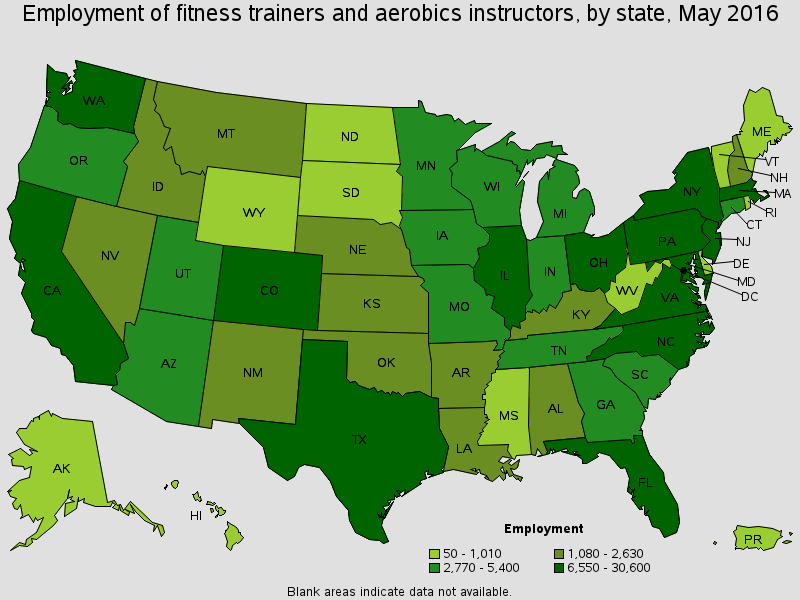
States with the highest employment level in this occupation:
| State | Employment (1) | Employment per thousand jobs | Location quotient (9) | Hourly mean wage | Annual mean wage (2) |
|---|---|---|---|---|---|
| California | 30,600 | 1.92 | 1.05 | $24.16 | $50,260 |
| New York | 18,420 | 2.03 | 1.10 | $29.64 | $61,660 |
| Texas | 14,800 | 1.26 | 0.69 | $20.57 | $42,790 |
| Florida | 13,870 | 1.69 | 0.92 | $18.37 | $38,200 |
| Illinois | 13,350 | 2.26 | 1.23 | $21.13 | $43,960 |
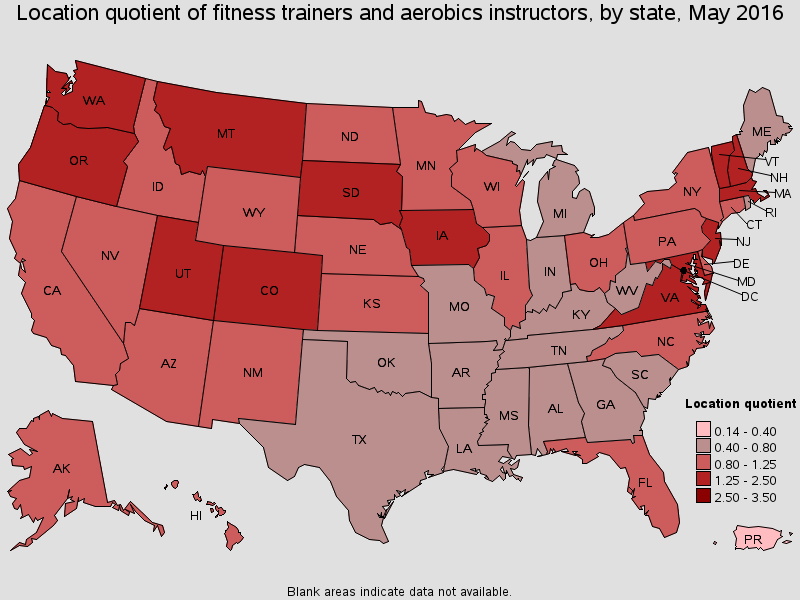
States with the highest concentration of jobs and location quotients in this occupation:
| State | Employment (1) | Employment per thousand jobs | Location quotient (9) | Hourly mean wage | Annual mean wage (2) |
|---|---|---|---|---|---|
| Virginia | 10,890 | 2.90 | 1.58 | $19.15 | $39,820 |
| Massachusetts | 9,990 | 2.89 | 1.58 | $25.47 | $52,980 |
| Colorado | 7,150 | 2.85 | 1.56 | $21.18 | $44,060 |
| New Jersey | 10,940 | 2.77 | 1.51 | $25.44 | $52,920 |
| New Hampshire | 1,770 | 2.75 | 1.50 | $16.47 | $34,250 |
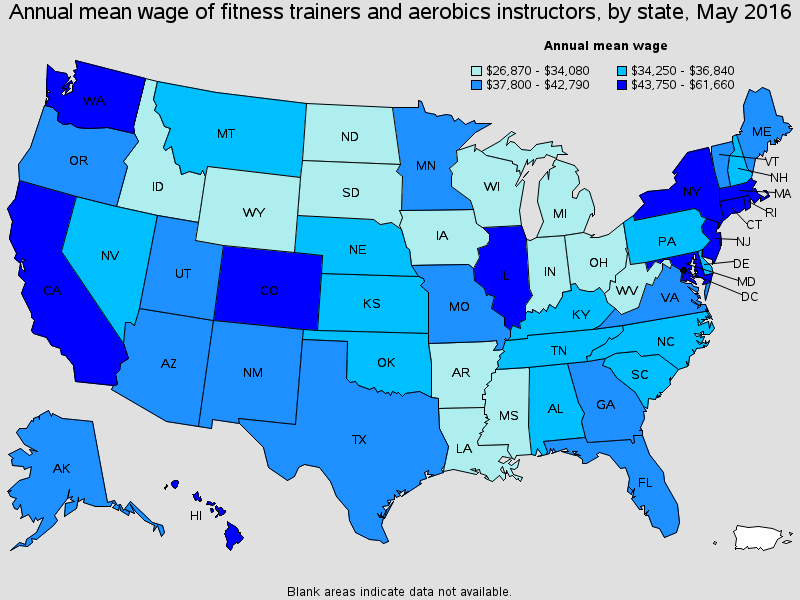
Top paying States for this occupation:
| State | Employment (1) | Employment per thousand jobs | Location quotient (9) | Hourly mean wage | Annual mean wage (2) |
|---|---|---|---|---|---|
| New York | 18,420 | 2.03 | 1.10 | $29.64 | $61,660 |
| District of Columbia | 1,080 | 1.53 | 0.84 | $27.75 | $57,720 |
| Massachusetts | 9,990 | 2.89 | 1.58 | $25.47 | $52,980 |
| New Jersey | 10,940 | 2.77 | 1.51 | $25.44 | $52,920 |
| California | 30,600 | 1.92 | 1.05 | $24.16 | $50,260 |
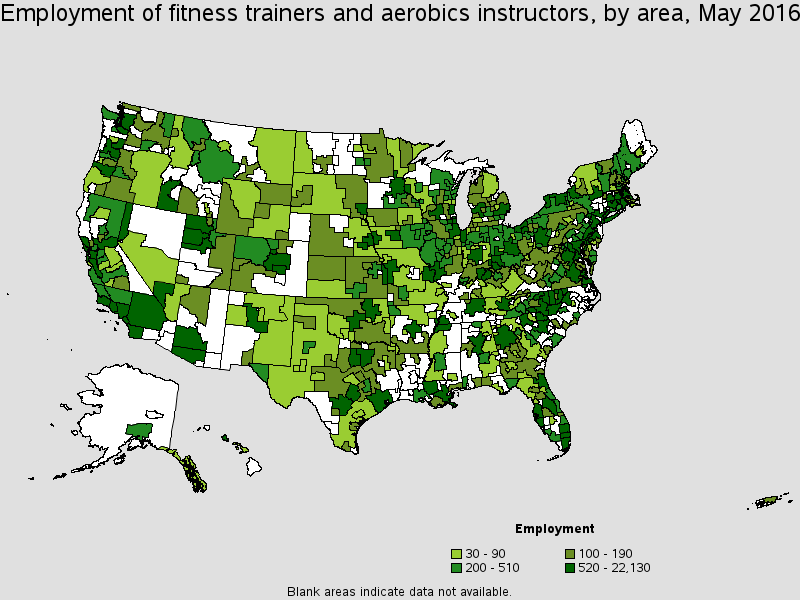
Metropolitan areas with the highest employment level in this occupation:
| Metropolitan area | Employment (1) | Employment per thousand jobs | Location quotient (9) | Hourly mean wage | Annual mean wage (2) |
|---|---|---|---|---|---|
| New York-Jersey City-White Plains, NY-NJ Metropolitan Division | 16,220 | 2.46 | 1.34 | $32.52 | $67,640 |
| Chicago-Naperville-Arlington Heights, IL Metropolitan Division | 9,010 | 2.47 | 1.35 | $22.05 | $45,850 |
| Washington-Arlington-Alexandria, DC-VA-MD-WV Metropolitan Division | 6,830 | 2.74 | 1.49 | $22.48 | $46,760 |
| Los Angeles-Long Beach-Glendale, CA Metropolitan Division | 6,590 | 1.56 | 0.85 | $24.46 | $50,880 |
| Boston-Cambridge-Newton, MA NECTA Division | 5,530 | 3.07 | 1.67 | $27.11 | $56,380 |
| Denver-Aurora-Lakewood, CO | 4,380 | 3.09 | 1.69 | $20.56 | $42,770 |
| Minneapolis-St. Paul-Bloomington, MN-WI | 4,260 | 2.23 | 1.22 | $19.54 | $40,650 |
| Houston-The Woodlands-Sugar Land, TX | 4,250 | 1.45 | 0.79 | $23.43 | $48,730 |
| Seattle-Bellevue-Everett, WA Metropolitan Division | 4,120 | 2.59 | 1.41 | $24.34 | $50,640 |
| Dallas-Plano-Irving, TX Metropolitan Division | 3,990 | 1.64 | 0.90 | $22.10 | $45,960 |
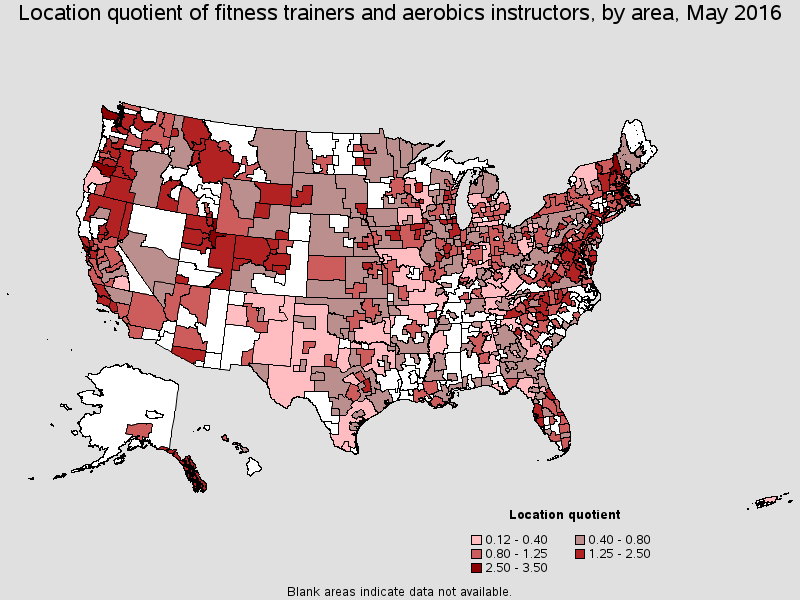
Metropolitan areas with the highest concentration of jobs and location quotients in this occupation:
| Metropolitan area | Employment (1) | Employment per thousand jobs | Location quotient (9) | Hourly mean wage | Annual mean wage (2) |
|---|---|---|---|---|---|
| San Rafael, CA Metropolitan Division | 700 | 6.25 | 3.41 | $33.41 | $69,500 |
| Eugene, OR | 700 | 4.80 | 2.62 | $18.51 | $38,490 |
| Lynn-Saugus-Marblehead, MA NECTA Division | 200 | 4.68 | 2.55 | $24.34 | $50,630 |
| Peabody-Salem-Beverly, MA NECTA Division | 420 | 4.40 | 2.40 | $25.09 | $52,180 |
| Harrisonburg, VA | 260 | 4.21 | 2.30 | $20.00 | $41,590 |
| Boulder, CO | 740 | 4.21 | 2.29 | $27.67 | $57,560 |
| Haverhill-Newburyport-Amesbury Town, MA-NH NECTA Division | 270 | 4.18 | 2.28 | $19.09 | $39,700 |
| Dubuque, IA | 240 | 4.15 | 2.27 | $16.68 | $34,690 |
| Des Moines-West Des Moines, IA | 1,430 | 4.05 | 2.21 | $15.27 | $31,760 |
| Sioux Falls, SD | 600 | 4.04 | 2.21 | $15.46 | $32,150 |
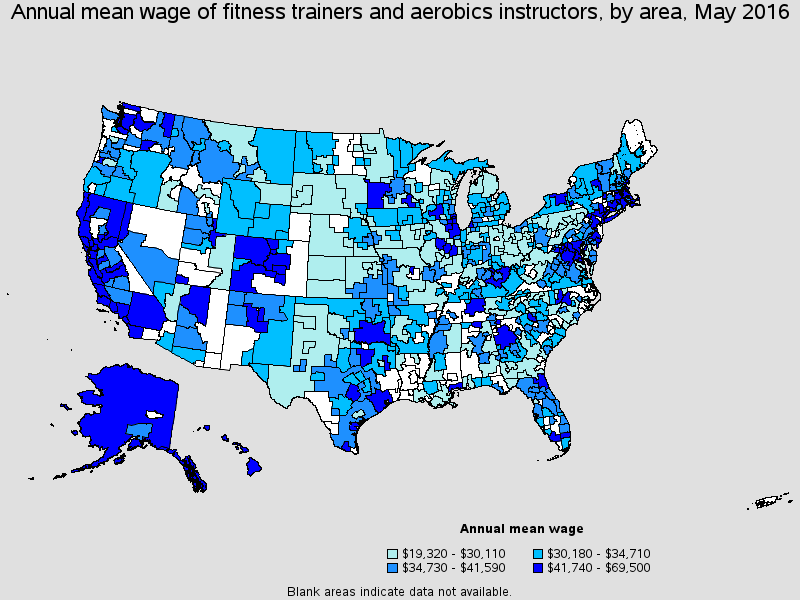
Top paying metropolitan areas for this occupation:
| Metropolitan area | Employment (1) | Employment per thousand jobs | Location quotient (9) | Hourly mean wage | Annual mean wage (2) |
|---|---|---|---|---|---|
| San Rafael, CA Metropolitan Division | 700 | 6.25 | 3.41 | $33.41 | $69,500 |
| New York-Jersey City-White Plains, NY-NJ Metropolitan Division | 16,220 | 2.46 | 1.34 | $32.52 | $67,640 |
| Pittsfield, MA | 110 | 2.81 | 1.53 | $30.10 | $62,600 |
| San Francisco-Redwood City-South San Francisco, CA Metropolitan Division | 2,440 | 2.29 | 1.25 | $28.04 | $58,310 |
| Boulder, CO | 740 | 4.21 | 2.29 | $27.67 | $57,560 |
| Santa Cruz-Watsonville, CA | 90 | 0.92 | 0.50 | $27.60 | $57,410 |
| California-Lexington Park, MD | (8) | (8) | (8) | $27.52 | $57,250 |
| Boston-Cambridge-Newton, MA NECTA Division | 5,530 | 3.07 | 1.67 | $27.11 | $56,380 |
| Nassau County-Suffolk County, NY Metropolitan Division | 2,370 | 1.84 | 1.00 | $26.78 | $55,710 |
| Salinas, CA | 280 | 1.72 | 0.94 | $26.74 | $55,630 |
Nonmetropolitan areas with the highest employment in this occupation:
| Nonmetropolitan area | Employment (1) | Employment per thousand jobs | Location quotient (9) | Hourly mean wage | Annual mean wage (2) |
|---|---|---|---|---|---|
| Piedmont North Carolina nonmetropolitan area | 530 | 2.07 | 1.13 | $12.23 | $25,450 |
| Southeast Iowa nonmetropolitan area | 400 | 1.74 | 0.95 | $12.95 | $26,930 |
| West Northwestern Ohio nonmetropolitan area | 390 | 1.55 | 0.85 | $10.88 | $22,640 |
| Southwest Montana nonmetropolitan area | 360 | 2.69 | 1.47 | $16.98 | $35,320 |
| North Northeastern Ohio non-metropolitan area (non-contiguous) | 340 | 1.04 | 0.57 | $10.64 | $22,130 |
Nonmetropolitan areas with the highest concentration of jobs and location quotients in this occupation:
| Nonmetropolitan area | Employment (1) | Employment per thousand jobs | Location quotient (9) | Hourly mean wage | Annual mean wage (2) |
|---|---|---|---|---|---|
| Wasatch Back nonmetropolitan area | 210 | 6.36 | 3.47 | $20.10 | $41,800 |
| Northern New Hampshire nonmetropolitan area | 210 | 5.75 | 3.13 | $11.19 | $23,280 |
| Northwest Washington nonmetropolitan area | 230 | 4.69 | 2.56 | $18.37 | $38,210 |
| Nantucket Island and Martha's Vineyard nonmetropolitan area | 80 | 4.47 | 2.44 | $32.80 | $68,210 |
| West Montana nonmetropolitan area | 240 | 3.37 | 1.84 | $16.94 | $35,230 |
Top paying nonmetropolitan areas for this occupation:
| Nonmetropolitan area | Employment (1) | Employment per thousand jobs | Location quotient (9) | Hourly mean wage | Annual mean wage (2) |
|---|---|---|---|---|---|
| Nantucket Island and Martha's Vineyard nonmetropolitan area | 80 | 4.47 | 2.44 | $32.80 | $68,210 |
| Hawaii / Kauai nonmetropolitan area | (8) | (8) | (8) | $26.05 | $54,190 |
| Southeast Alaska nonmetropolitan area | 80 | 2.39 | 1.30 | $25.25 | $52,520 |
| Balance of Alaska nonmetropolitan area | (8) | (8) | (8) | $24.67 | $51,320 |
| North Coast Region of California nonmetropolitan area | (8) | (8) | (8) | $24.32 | $50,580 |
These estimates are calculated with data collected from employers in all industry sectors, all metropolitan and nonmetropolitan areas, and all states and the District of Columbia. The top employment and wage figures are provided above. The complete list is available in the downloadable XLS files.
The percentile wage estimate is the value of a wage below which a certain percent of workers fall. The median wage is the 50th percentile wage estimate--50 percent of workers earn less than the median and 50 percent of workers earn more than the median. More about percentile wages.
(1) Estimates for detailed occupations do not sum to the totals because the totals include occupations not shown separately. Estimates do not include self-employed workers.
(2) Annual wages have been calculated by multiplying the hourly mean wage by a "year-round, full-time" hours figure of 2,080 hours; for those occupations where there is not an hourly wage published, the annual wage has been directly calculated from the reported survey data.
(3) The relative standard error (RSE) is a measure of the reliability of a survey statistic. The smaller the relative standard error, the more precise the estimate.
(8) Estimate not released.
(9) The location quotient is the ratio of the area concentration of occupational employment to the national average concentration. A location quotient greater than one indicates the occupation has a higher share of employment than average, and a location quotient less than one indicates the occupation is less prevalent in the area than average.
Other OES estimates and related information:
May 2016 National Occupational Employment and Wage Estimates
May 2016 State Occupational Employment and Wage Estimates
May 2016 Metropolitan and Nonmetropolitan Area Occupational Employment and Wage Estimates
May 2016 National Industry-Specific Occupational Employment and Wage Estimates
Last Modified Date: March 31, 2017