
An official website of the United States government
An official website of the United States government
The .gov means it's official.
Federal government websites often end in .gov or .mil. Before sharing sensitive information,
make sure you're on a federal government site.
The site is secure.
The
https:// ensures that you are connecting to the official website and that any
information you provide is encrypted and transmitted securely.
Sell goods for wholesalers or manufacturers to businesses or groups of individuals. Work requires substantial knowledge of items sold.
Employment estimate and mean wage estimates for this occupation:
| Employment (1) | Employment RSE (3) |
Mean hourly wage |
Mean annual wage (2) |
Wage RSE (3) |
|---|---|---|---|---|
| 1,404,050 | 0.5 % | $32.89 | $68,410 | 0.3 % |
Percentile wage estimates for this occupation:
| Percentile | 10% | 25% | 50% (Median) |
75% | 90% |
|---|---|---|---|---|---|
| Hourly Wage | $13.22 | $18.92 | $27.47 | $39.68 | $58.21 |
| Annual Wage (2) | $27,500 | $39,350 | $57,140 | $82,520 | $121,080 |
Industries with the highest published employment and wages for this occupation are provided. For a list of all industries with employment in this occupation, see the Create Customized Tables function.
Industries with the highest levels of employment in this occupation:
| Industry | Employment (1) | Percent of industry employment | Hourly mean wage | Annual mean wage (2) |
|---|---|---|---|---|
| Wholesale Electronic Markets and Agents and Brokers | 242,450 | 27.31 | $37.66 | $78,330 |
| Machinery, Equipment, and Supplies Merchant Wholesalers | 109,620 | 16.45 | $33.03 | $68,710 |
| Grocery and Related Product Merchant Wholesalers | 84,030 | 11.32 | $31.07 | $64,630 |
| Professional and Commercial Equipment and Supplies Merchant Wholesalers | 56,310 | 9.05 | $32.90 | $68,430 |
| Household Appliances and Electrical and Electronic Goods Merchant Wholesalers | 55,850 | 17.17 | $31.41 | $65,340 |
Industries with the highest concentration of employment in this occupation:
| Industry | Employment (1) | Percent of industry employment | Hourly mean wage | Annual mean wage (2) |
|---|---|---|---|---|
| Wholesale Electronic Markets and Agents and Brokers | 242,450 | 27.31 | $37.66 | $78,330 |
| Beer, Wine, and Distilled Alcoholic Beverage Merchant Wholesalers | 50,280 | 25.86 | $28.82 | $59,950 |
| Paper and Paper Product Merchant Wholesalers | 26,310 | 21.93 | $33.46 | $69,590 |
| Hardware, and Plumbing and Heating Equipment and Supplies Merchant Wholesalers | 51,840 | 21.02 | $30.62 | $63,690 |
| Lumber and Other Construction Materials Merchant Wholesalers | 40,980 | 19.05 | $30.49 | $63,410 |
Top paying industries for this occupation:
| Industry | Employment (1) | Percent of industry employment | Hourly mean wage | Annual mean wage (2) |
|---|---|---|---|---|
| Water, Sewage and Other Systems | 180 | 0.36 | $51.62 | $107,370 |
| Securities and Commodity Contracts Intermediation and Brokerage | (8) | (8) | $46.69 | $97,110 |
| Resin, Synthetic Rubber, and Artificial Synthetic Fibers and Filaments Manufacturing | 1,120 | 1.22 | $44.43 | $92,420 |
| Oil and Gas Extraction | 270 | 0.15 | $44.15 | $91,830 |
| Textile and Fabric Finishing and Fabric Coating Mills | 930 | 3.10 | $43.32 | $90,110 |
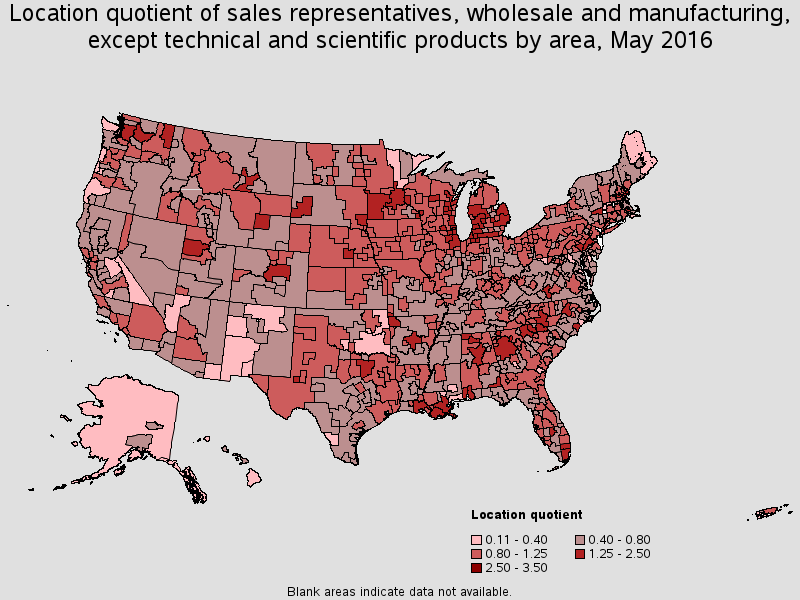
States and areas with the highest published employment, location quotients, and wages for this occupation are provided. For a list of all areas with employment in this occupation, see the Create Customized Tables function.
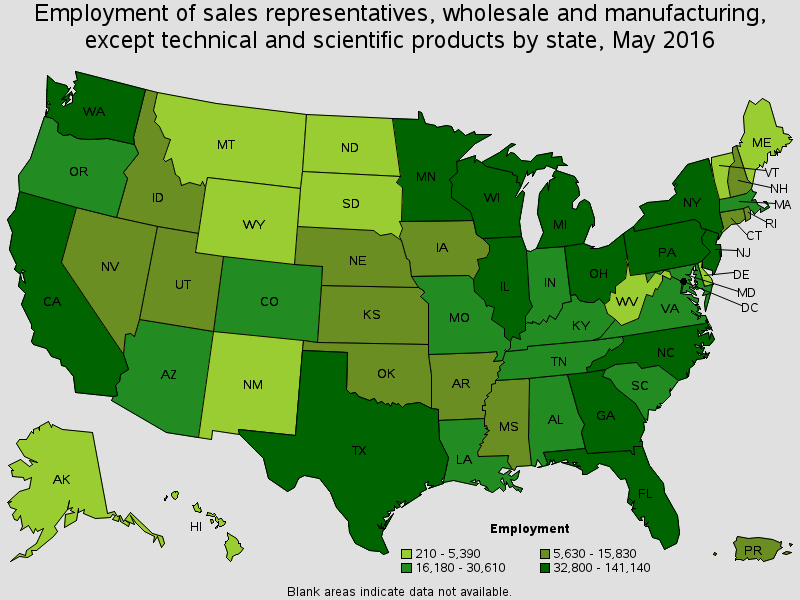
States with the highest employment level in this occupation:
| State | Employment (1) | Employment per thousand jobs | Location quotient (9) | Hourly mean wage | Annual mean wage (2) |
|---|---|---|---|---|---|
| California | 141,140 | 8.84 | 0.88 | $32.42 | $67,440 |
| Texas | 118,160 | 10.06 | 1.01 | $35.93 | $74,740 |
| Florida | 95,130 | 11.57 | 1.16 | $28.65 | $59,580 |
| New York | 87,710 | 9.64 | 0.96 | $34.92 | $72,630 |
| Illinois | 69,240 | 11.73 | 1.17 | $34.77 | $72,320 |
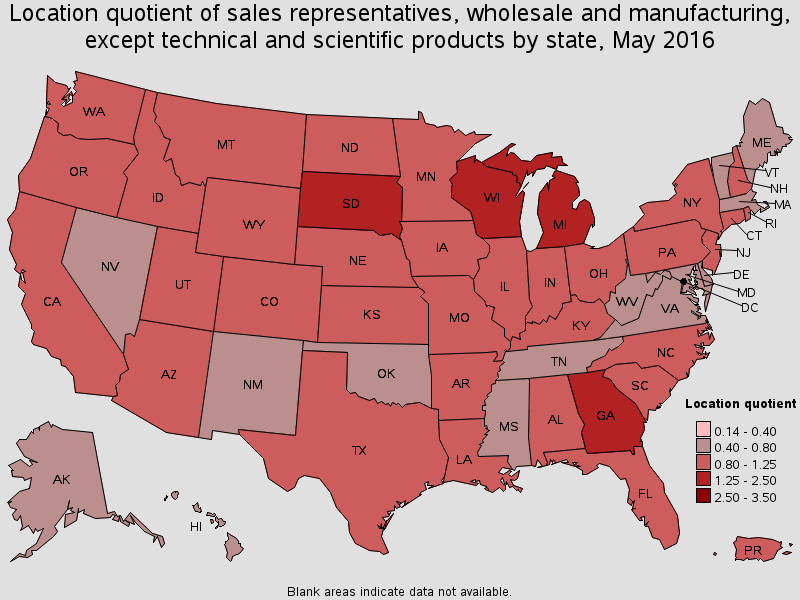
States with the highest concentration of jobs and location quotients in this occupation:
| State | Employment (1) | Employment per thousand jobs | Location quotient (9) | Hourly mean wage | Annual mean wage (2) |
|---|---|---|---|---|---|
| Georgia | 58,500 | 13.88 | 1.39 | $30.57 | $63,590 |
| Wisconsin | 38,650 | 13.78 | 1.38 | $34.31 | $71,370 |
| South Dakota | 5,390 | 12.91 | 1.29 | $29.07 | $60,470 |
| Michigan | 54,300 | 12.89 | 1.29 | $33.38 | $69,430 |
| Alabama | 23,200 | 12.13 | 1.21 | $30.58 | $63,610 |
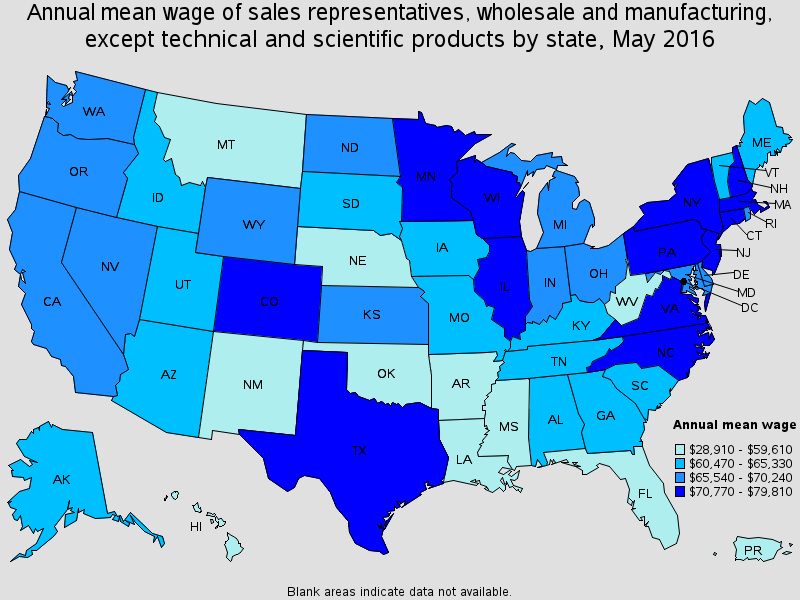
Top paying States for this occupation:
| State | Employment (1) | Employment per thousand jobs | Location quotient (9) | Hourly mean wage | Annual mean wage (2) |
|---|---|---|---|---|---|
| Massachusetts | 24,380 | 7.05 | 0.70 | $38.37 | $79,810 |
| New Jersey | 44,070 | 11.14 | 1.11 | $37.08 | $77,130 |
| Virginia | 29,500 | 7.84 | 0.78 | $36.74 | $76,410 |
| Connecticut | 15,200 | 9.12 | 0.91 | $36.41 | $75,730 |
| Texas | 118,160 | 10.06 | 1.01 | $35.93 | $74,740 |
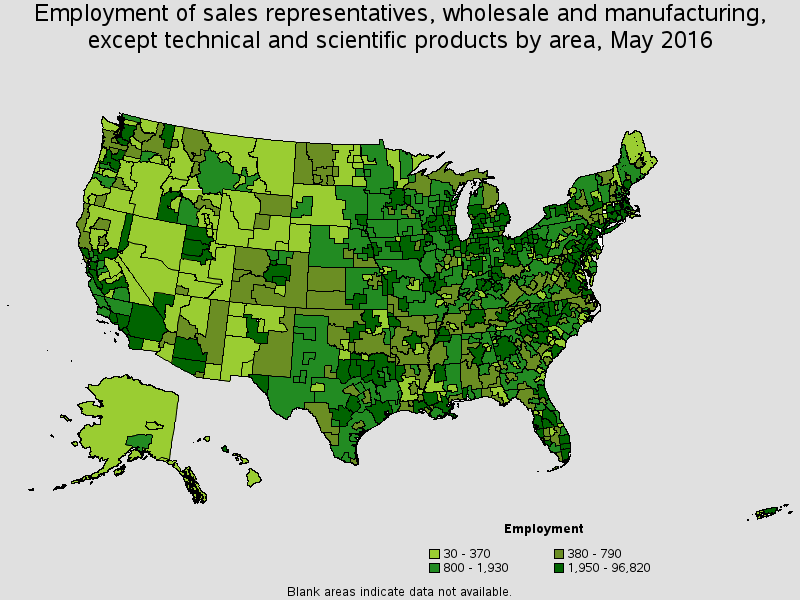
Metropolitan areas with the highest employment level in this occupation:
| Metropolitan area | Employment (1) | Employment per thousand jobs | Location quotient (9) | Hourly mean wage | Annual mean wage (2) |
|---|---|---|---|---|---|
| New York-Jersey City-White Plains, NY-NJ Metropolitan Division | 68,310 | 10.37 | 1.04 | $35.77 | $74,400 |
| Los Angeles-Long Beach-Glendale, CA Metropolitan Division | 46,480 | 11.01 | 1.10 | $30.53 | $63,500 |
| Chicago-Naperville-Arlington Heights, IL Metropolitan Division | 46,140 | 12.68 | 1.27 | $36.23 | $75,370 |
| Atlanta-Sandy Springs-Roswell, GA | 40,920 | 16.02 | 1.60 | $31.69 | $65,910 |
| Houston-The Woodlands-Sugar Land, TX | 33,300 | 11.34 | 1.13 | $36.29 | $75,480 |
| Dallas-Plano-Irving, TX Metropolitan Division | 30,400 | 12.51 | 1.25 | $41.10 | $85,480 |
| Minneapolis-St. Paul-Bloomington, MN-WI | 24,840 | 13.00 | 1.30 | $37.96 | $78,960 |
| Denver-Aurora-Lakewood, CO | 20,760 | 14.66 | 1.47 | $34.33 | $71,400 |
| Seattle-Bellevue-Everett, WA Metropolitan Division | 20,170 | 12.70 | 1.27 | $34.64 | $72,050 |
| Miami-Miami Beach-Kendall, FL Metropolitan Division | 19,380 | 17.21 | 1.72 | $27.67 | $57,540 |
Metropolitan areas with the highest concentration of jobs and location quotients in this occupation:
| Metropolitan area | Employment (1) | Employment per thousand jobs | Location quotient (9) | Hourly mean wage | Annual mean wage (2) |
|---|---|---|---|---|---|
| Appleton, WI | 2,350 | 19.13 | 1.91 | $34.64 | $72,050 |
| Lafayette, LA | 3,640 | 17.82 | 1.78 | $27.77 | $57,750 |
| Fayetteville-Springdale-Rogers, AR-MO | 4,120 | 17.69 | 1.77 | $35.12 | $73,040 |
| Birmingham-Hoover, AL | 8,900 | 17.64 | 1.76 | $33.86 | $70,430 |
| Grand Rapids-Wyoming, MI | 9,690 | 17.54 | 1.75 | $33.77 | $70,230 |
| Elkhart-Goshen, IN | 2,210 | 17.46 | 1.75 | $34.54 | $71,830 |
| Miami-Miami Beach-Kendall, FL Metropolitan Division | 19,380 | 17.21 | 1.72 | $27.67 | $57,540 |
| Dalton, GA | 1,170 | 17.06 | 1.71 | $27.38 | $56,950 |
| Fond du Lac, WI | 770 | 16.96 | 1.70 | $32.90 | $68,440 |
| Milwaukee-Waukesha-West Allis, WI | 14,140 | 16.82 | 1.68 | $37.42 | $77,830 |
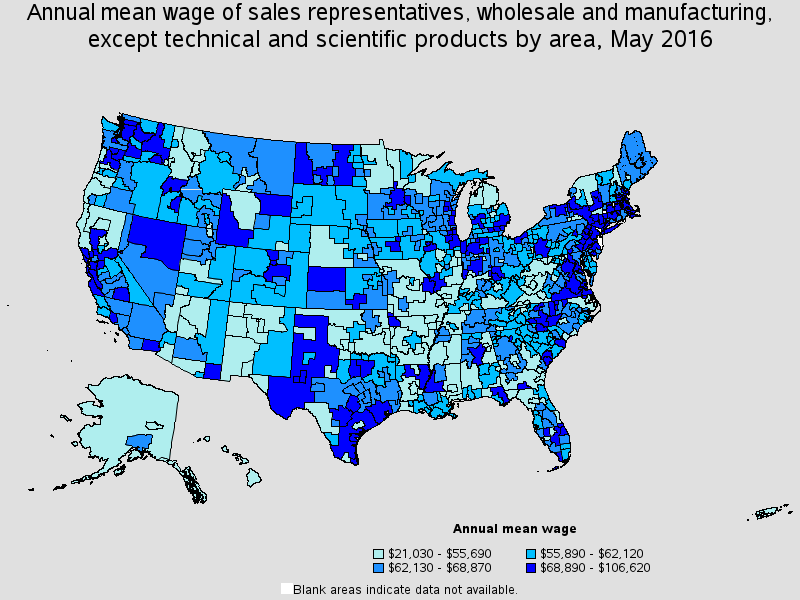
Top paying metropolitan areas for this occupation:
| Metropolitan area | Employment (1) | Employment per thousand jobs | Location quotient (9) | Hourly mean wage | Annual mean wage (2) |
|---|---|---|---|---|---|
| Portsmouth, NH-ME | 1,170 | 12.79 | 1.28 | $51.26 | $106,620 |
| Danbury, CT | 940 | 11.80 | 1.18 | $45.51 | $94,660 |
| Lynn-Saugus-Marblehead, MA NECTA Division | 210 | 4.91 | 0.49 | $44.26 | $92,070 |
| Salinas, CA | 1,050 | 6.36 | 0.64 | $43.39 | $90,250 |
| Peabody-Salem-Beverly, MA NECTA Division | 520 | 5.49 | 0.55 | $43.03 | $89,500 |
| Santa Cruz-Watsonville, CA | 830 | 8.93 | 0.89 | $42.78 | $88,990 |
| Wenatchee, WA | 630 | 14.72 | 1.47 | $42.78 | $88,970 |
| Taunton-Middleborough-Norton, MA NECTA Division | 810 | 13.96 | 1.40 | $41.89 | $87,140 |
| Camden, NJ Metropolitan Division | 5,240 | 10.13 | 1.01 | $41.76 | $86,870 |
| Boulder, CO | 2,020 | 11.46 | 1.15 | $41.22 | $85,730 |
Nonmetropolitan areas with the highest employment in this occupation:
| Nonmetropolitan area | Employment (1) | Employment per thousand jobs | Location quotient (9) | Hourly mean wage | Annual mean wage (2) |
|---|---|---|---|---|---|
| Balance of Lower Peninsula of Michigan nonmetropolitan area | 4,080 | 14.64 | 1.46 | $28.71 | $59,710 |
| North Northeastern Ohio non-metropolitan area (non-contiguous) | 3,250 | 9.83 | 0.98 | $28.27 | $58,800 |
| North Texas nonmetropolitan area | 2,780 | 10.43 | 1.04 | $29.27 | $60,870 |
| South Central Wisconsin nonmetropolitan area | 2,310 | 11.07 | 1.11 | $32.97 | $68,590 |
| Piedmont North Carolina nonmetropolitan area | 2,290 | 8.98 | 0.90 | $33.25 | $69,150 |
Nonmetropolitan areas with the highest concentration of jobs and location quotients in this occupation:
| Nonmetropolitan area | Employment (1) | Employment per thousand jobs | Location quotient (9) | Hourly mean wage | Annual mean wage (2) |
|---|---|---|---|---|---|
| East Central New York nonmetropolitan area | 640 | 18.64 | 1.86 | $25.58 | $53,220 |
| Balance of Lower Peninsula of Michigan nonmetropolitan area | 4,080 | 14.64 | 1.46 | $28.71 | $59,710 |
| Southwest Minnesota nonmetropolitan area | 1,610 | 13.13 | 1.31 | $31.51 | $65,530 |
| Northeast Nebraska nonmetropolitan area | 1,120 | 12.18 | 1.22 | $26.87 | $55,890 |
| North Georgia nonmetropolitan area | 1,920 | 12.12 | 1.21 | $28.96 | $60,250 |
Top paying nonmetropolitan areas for this occupation:
| Nonmetropolitan area | Employment (1) | Employment per thousand jobs | Location quotient (9) | Hourly mean wage | Annual mean wage (2) |
|---|---|---|---|---|---|
| Southside Virginia nonmetropolitan area | 660 | 6.14 | 0.61 | $42.39 | $88,170 |
| Northeast Wyoming nonmetropolitan area | 470 | 9.87 | 0.99 | $42.05 | $87,460 |
| North Valley Region of California nonmetropolitan area | 140 | 4.67 | 0.47 | $39.93 | $83,040 |
| Low Country South Carolina nonmetropolitan area | 270 | 5.77 | 0.58 | $38.70 | $80,510 |
| Far West North Dakota nonmetropolitan area | 470 | 7.18 | 0.72 | $38.06 | $79,170 |
These estimates are calculated with data collected from employers in all industry sectors, all metropolitan and nonmetropolitan areas, and all states and the District of Columbia. The top employment and wage figures are provided above. The complete list is available in the downloadable XLS files.
The percentile wage estimate is the value of a wage below which a certain percent of workers fall. The median wage is the 50th percentile wage estimate--50 percent of workers earn less than the median and 50 percent of workers earn more than the median. More about percentile wages.
(1) Estimates for detailed occupations do not sum to the totals because the totals include occupations not shown separately. Estimates do not include self-employed workers.
(2) Annual wages have been calculated by multiplying the hourly mean wage by a "year-round, full-time" hours figure of 2,080 hours; for those occupations where there is not an hourly wage published, the annual wage has been directly calculated from the reported survey data.
(3) The relative standard error (RSE) is a measure of the reliability of a survey statistic. The smaller the relative standard error, the more precise the estimate.
(8) Estimate not released.
(9) The location quotient is the ratio of the area concentration of occupational employment to the national average concentration. A location quotient greater than one indicates the occupation has a higher share of employment than average, and a location quotient less than one indicates the occupation is less prevalent in the area than average.
Other OES estimates and related information:
May 2016 National Occupational Employment and Wage Estimates
May 2016 State Occupational Employment and Wage Estimates
May 2016 Metropolitan and Nonmetropolitan Area Occupational Employment and Wage Estimates
May 2016 National Industry-Specific Occupational Employment and Wage Estimates
Last Modified Date: March 31, 2017