
An official website of the United States government
An official website of the United States government
The .gov means it's official.
Federal government websites often end in .gov or .mil. Before sharing sensitive information,
make sure you're on a federal government site.
The site is secure.
The
https:// ensures that you are connecting to the official website and that any
information you provide is encrypted and transmitted securely.
Solicit donations or orders for goods or services over the telephone.
Employment estimate and mean wage estimates for this occupation:
| Employment (1) | Employment RSE (3) |
Mean hourly wage |
Mean annual wage (2) |
Wage RSE (3) |
|---|---|---|---|---|
| 215,290 | 2.4 % | $13.06 | $27,170 | 0.7 % |
Percentile wage estimates for this occupation:
| Percentile | 10% | 25% | 50% (Median) |
75% | 90% |
|---|---|---|---|---|---|
| Hourly Wage | $8.81 | $9.80 | $11.69 | $14.66 | $18.90 |
| Annual Wage (2) | $18,330 | $20,370 | $24,300 | $30,480 | $39,310 |
Industries with the highest published employment and wages for this occupation are provided. For a list of all industries with employment in this occupation, see the Create Customized Tables function.
Industries with the highest levels of employment in this occupation:
| Industry | Employment (1) | Percent of industry employment | Hourly mean wage | Annual mean wage (2) |
|---|---|---|---|---|
| Business Support Services | 126,290 | 13.71 | $12.14 | $25,260 |
| Management, Scientific, and Technical Consulting Services | 8,880 | 0.67 | $13.47 | $28,020 |
| Employment Services | 8,810 | 0.24 | $13.16 | $27,380 |
| Depository Credit Intermediation | 4,120 | 0.24 | $15.71 | $32,680 |
| Electronic Shopping and Mail-Order Houses | 3,840 | 1.06 | $13.70 | $28,490 |
Industries with the highest concentration of employment in this occupation:
| Industry | Employment (1) | Percent of industry employment | Hourly mean wage | Annual mean wage (2) |
|---|---|---|---|---|
| Business Support Services | 126,290 | 13.71 | $12.14 | $25,260 |
| Lessors of Nonfinancial Intangible Assets (except Copyrighted Works) | 320 | 1.37 | $13.68 | $28,450 |
| Other Telecommunications | 950 | 1.29 | $12.31 | $25,610 |
| Travel Arrangement and Reservation Services | 2,320 | 1.08 | $12.14 | $25,250 |
| Electronic Shopping and Mail-Order Houses | 3,840 | 1.06 | $13.70 | $28,490 |
Top paying industries for this occupation:
| Industry | Employment (1) | Percent of industry employment | Hourly mean wage | Annual mean wage (2) |
|---|---|---|---|---|
| Specialized Design Services | (8) | (8) | $24.30 | $50,550 |
| Educational Support Services | 30 | 0.02 | $24.01 | $49,940 |
| Business, Professional, Labor, Political, and Similar Organizations | 370 | 0.09 | $22.66 | $47,130 |
| Metal and Mineral (except Petroleum) Merchant Wholesalers | 100 | 0.08 | $20.95 | $43,590 |
| Lumber and Other Construction Materials Merchant Wholesalers | (8) | (8) | $20.42 | $42,460 |
States and areas with the highest published employment, location quotients, and wages for this occupation are provided. For a list of all areas with employment in this occupation, see the Create Customized Tables function.
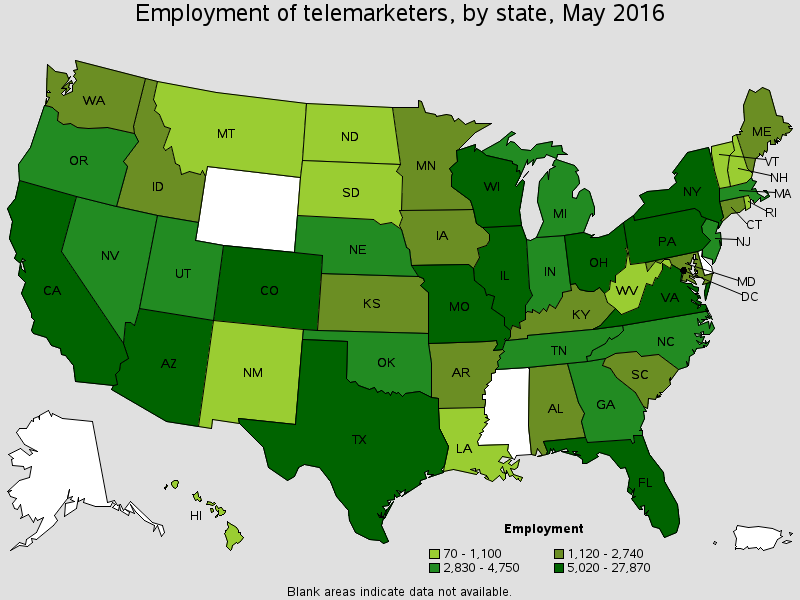
States with the highest employment level in this occupation:
| State | Employment (1) | Employment per thousand jobs | Location quotient (9) | Hourly mean wage | Annual mean wage (2) |
|---|---|---|---|---|---|
| Florida | 27,870 | 3.39 | 2.21 | $12.08 | $25,140 |
| Texas | 21,020 | 1.79 | 1.17 | $13.32 | $27,690 |
| Arizona | 13,850 | 5.22 | 3.40 | $13.15 | $27,360 |
| California | 13,670 | 0.86 | 0.56 | $14.43 | $30,010 |
| Ohio | 13,510 | 2.53 | 1.65 | $11.71 | $24,360 |
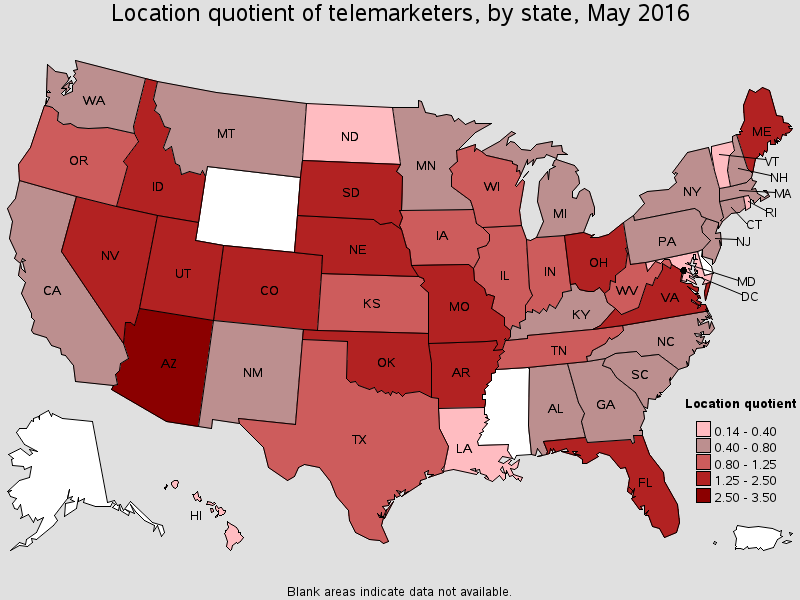
States with the highest concentration of jobs and location quotients in this occupation:
| State | Employment (1) | Employment per thousand jobs | Location quotient (9) | Hourly mean wage | Annual mean wage (2) |
|---|---|---|---|---|---|
| Arizona | 13,850 | 5.22 | 3.40 | $13.15 | $27,360 |
| Utah | 4,750 | 3.45 | 2.25 | $12.45 | $25,890 |
| Florida | 27,870 | 3.39 | 2.21 | $12.08 | $25,140 |
| Nebraska | 3,000 | 3.10 | 2.02 | $12.12 | $25,200 |
| Idaho | 2,020 | 3.04 | 1.98 | $12.00 | $24,970 |
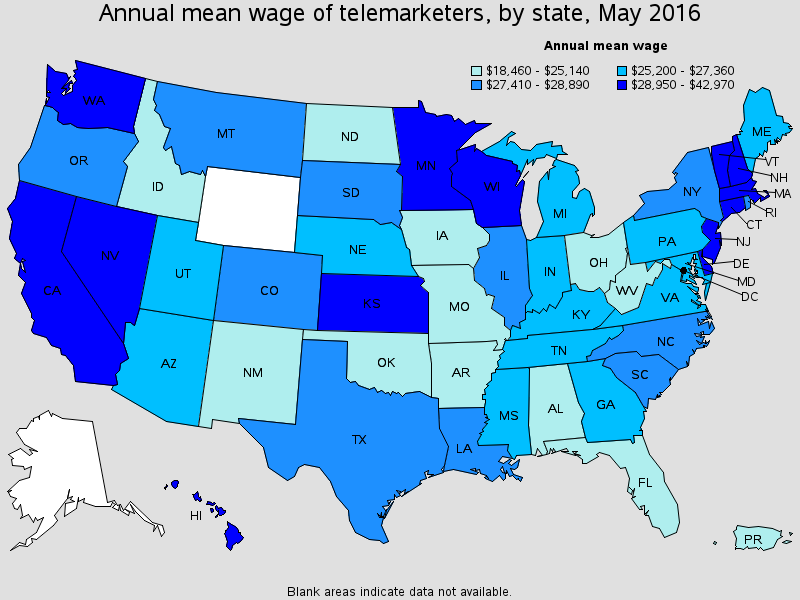
Top paying States for this occupation:
| State | Employment (1) | Employment per thousand jobs | Location quotient (9) | Hourly mean wage | Annual mean wage (2) |
|---|---|---|---|---|---|
| Connecticut | 1,120 | 0.67 | 0.44 | $20.66 | $42,970 |
| Minnesota | 2,660 | 0.95 | 0.62 | $16.62 | $34,570 |
| Massachusetts | 2,830 | 0.82 | 0.53 | $16.43 | $34,180 |
| New Hampshire | 660 | 1.03 | 0.67 | $16.30 | $33,910 |
| Nevada | 3,210 | 2.53 | 1.65 | $15.90 | $33,060 |
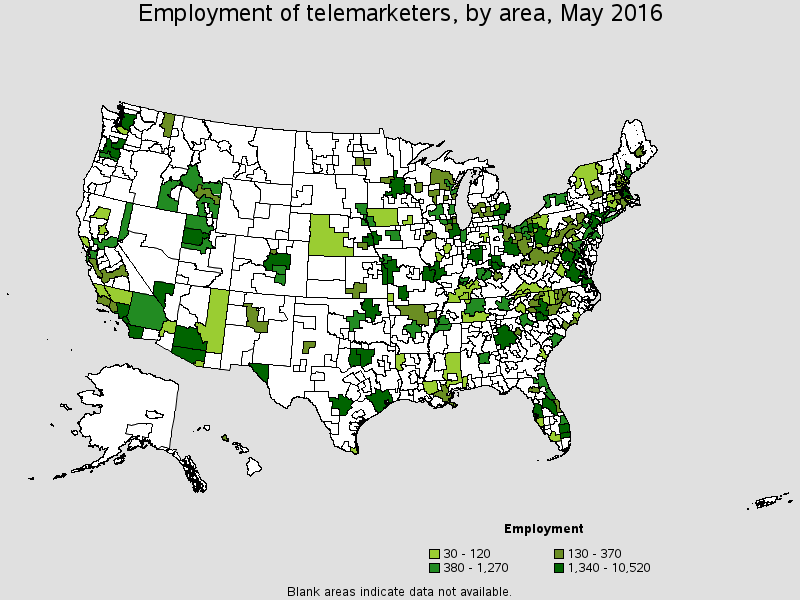
Metropolitan areas with the highest employment level in this occupation:
| Metropolitan area | Employment (1) | Employment per thousand jobs | Location quotient (9) | Hourly mean wage | Annual mean wage (2) |
|---|---|---|---|---|---|
| Phoenix-Mesa-Scottsdale, AZ | 10,520 | 5.44 | 3.54 | $13.55 | $28,190 |
| Orlando-Kissimmee-Sanford, FL | 7,150 | 6.11 | 3.98 | $11.89 | $24,730 |
| Dallas-Plano-Irving, TX Metropolitan Division | 6,590 | 2.71 | 1.77 | $14.08 | $29,290 |
| Fort Lauderdale-Pompano Beach-Deerfield Beach, FL Metropolitan Division | 6,140 | 7.69 | 5.02 | $11.20 | $23,300 |
| Chicago-Naperville-Arlington Heights, IL Metropolitan Division | 5,590 | 1.54 | 1.00 | $13.86 | $28,830 |
| San Antonio-New Braunfels, TX | 5,370 | 5.50 | 3.58 | $13.62 | $28,340 |
| New York-Jersey City-White Plains, NY-NJ Metropolitan Division | 5,160 | 0.78 | 0.51 | $13.77 | $28,640 |
| Los Angeles-Long Beach-Glendale, CA Metropolitan Division | 3,730 | 0.88 | 0.58 | $14.27 | $29,680 |
| Tampa-St. Petersburg-Clearwater, FL | 3,650 | 2.88 | 1.88 | $12.75 | $26,520 |
| St. Louis, MO-IL | 3,420 | 2.54 | 1.66 | $12.06 | $25,090 |
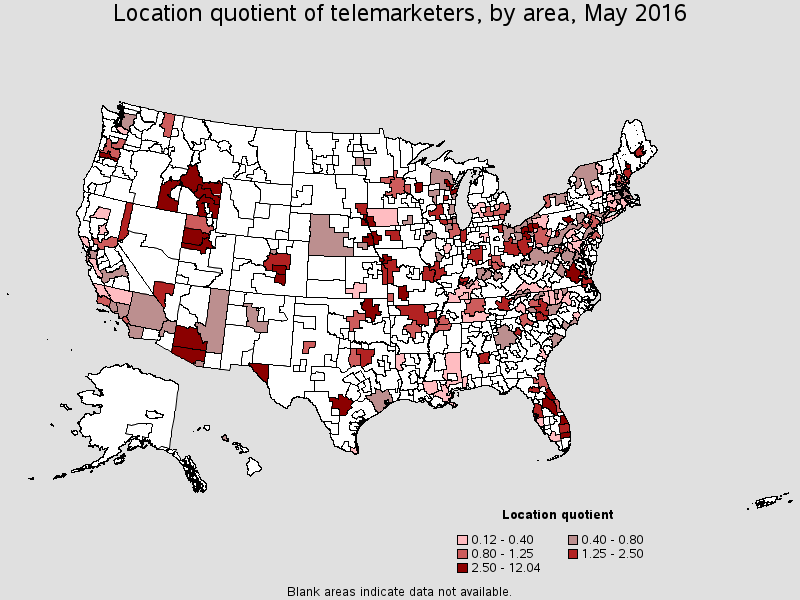
Metropolitan areas with the highest concentration of jobs and location quotients in this occupation:
| Metropolitan area | Employment (1) | Employment per thousand jobs | Location quotient (9) | Hourly mean wage | Annual mean wage (2) |
|---|---|---|---|---|---|
| Pueblo, CO | 1,060 | 18.46 | 12.04 | $10.08 | $20,960 |
| Youngstown-Warren-Boardman, OH-PA | 2,850 | 13.13 | 8.56 | $10.45 | $21,730 |
| St. Joseph, MO-KS | 640 | 12.12 | 7.90 | $9.77 | $20,310 |
| Sioux City, IA-NE-SD | 900 | 10.57 | 6.90 | $11.50 | $23,920 |
| Lewiston-Auburn, ME | 510 | 10.34 | 6.75 | $13.15 | $27,360 |
| Springfield, MO | 2,050 | 10.21 | 6.66 | $9.05 | $18,830 |
| Fort Lauderdale-Pompano Beach-Deerfield Beach, FL Metropolitan Division | 6,140 | 7.69 | 5.02 | $11.20 | $23,300 |
| Tulsa, OK | 2,910 | 6.72 | 4.38 | $11.11 | $23,110 |
| El Paso, TX | 1,980 | 6.66 | 4.35 | $10.40 | $21,620 |
| Williamsport, PA | 320 | 6.32 | 4.12 | $9.70 | $20,180 |
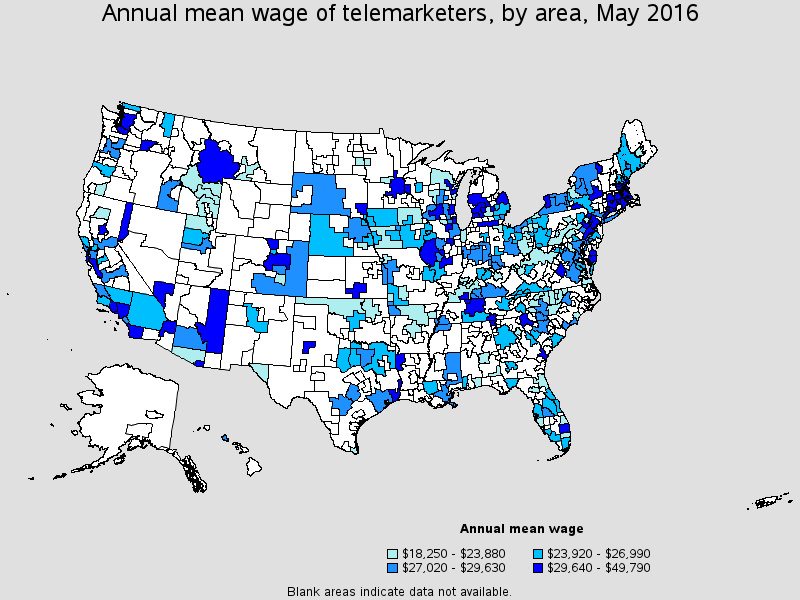
Top paying metropolitan areas for this occupation:
| Metropolitan area | Employment (1) | Employment per thousand jobs | Location quotient (9) | Hourly mean wage | Annual mean wage (2) |
|---|---|---|---|---|---|
| Haverhill-Newburyport-Amesbury Town, MA-NH NECTA Division | 40 | 0.59 | 0.38 | $23.94 | $49,790 |
| Green Bay, WI | 750 | 4.41 | 2.88 | $23.44 | $48,760 |
| Bridgeport-Stamford-Norwalk, CT | 400 | 0.96 | 0.63 | $22.89 | $47,610 |
| New Haven, CT | 380 | 1.36 | 0.89 | $22.27 | $46,330 |
| San Francisco-Redwood City-South San Francisco, CA Metropolitan Division | 1,100 | 1.03 | 0.67 | $20.00 | $41,610 |
| Portsmouth, NH-ME | 140 | 1.49 | 0.97 | $19.31 | $40,170 |
| Kennewick-Richland, WA | (8) | (8) | (8) | $19.04 | $39,610 |
| Oxnard-Thousand Oaks-Ventura, CA | 200 | 0.68 | 0.44 | $18.82 | $39,140 |
| Worcester, MA-CT | 170 | 0.62 | 0.41 | $17.99 | $37,420 |
| Nashua, NH-MA NECTA Division | 130 | 0.99 | 0.64 | $17.98 | $37,400 |
Nonmetropolitan areas with the highest employment in this occupation:
| Nonmetropolitan area | Employment (1) | Employment per thousand jobs | Location quotient (9) | Hourly mean wage | Annual mean wage (2) |
|---|---|---|---|---|---|
| Southeast Idaho nonmetropolitan area | 410 | 8.83 | 5.76 | $10.65 | $22,160 |
| North Arkansas nonmetropolitan area | 310 | 2.63 | 1.72 | $9.97 | $20,730 |
| Eastern Ohio nonmetropolitan area | 280 | 2.05 | 1.34 | $10.97 | $22,820 |
| Southern Pennsylvania nonmetropolitan area | 220 | 1.16 | 0.76 | $11.40 | $23,720 |
| Piedmont North Carolina nonmetropolitan area | 210 | 0.83 | 0.54 | $11.33 | $23,560 |
Nonmetropolitan areas with the highest concentration of jobs and location quotients in this occupation:
| Nonmetropolitan area | Employment (1) | Employment per thousand jobs | Location quotient (9) | Hourly mean wage | Annual mean wage (2) |
|---|---|---|---|---|---|
| Southeast Idaho nonmetropolitan area | 410 | 8.83 | 5.76 | $10.65 | $22,160 |
| North Arkansas nonmetropolitan area | 310 | 2.63 | 1.72 | $9.97 | $20,730 |
| Eastern Ohio nonmetropolitan area | 280 | 2.05 | 1.34 | $10.97 | $22,820 |
| Central New Hampshire nonmetropolitan area | 180 | 1.82 | 1.18 | $12.68 | $26,380 |
| Southern Pennsylvania nonmetropolitan area | 220 | 1.16 | 0.76 | $11.40 | $23,720 |
Top paying nonmetropolitan areas for this occupation:
| Nonmetropolitan area | Employment (1) | Employment per thousand jobs | Location quotient (9) | Hourly mean wage | Annual mean wage (2) |
|---|---|---|---|---|---|
| Arizona nonmetropolitan area | 80 | 0.85 | 0.55 | $19.37 | $40,290 |
| Balance of Lower Peninsula of Michigan nonmetropolitan area | (8) | (8) | (8) | $17.14 | $35,650 |
| Southwest Montana nonmetropolitan area | (8) | (8) | (8) | $15.02 | $31,240 |
| West Central Illinois nonmetropolitan area | (8) | (8) | (8) | $14.38 | $29,900 |
| Central Indiana nonmetropolitan area | (8) | (8) | (8) | $13.90 | $28,910 |
These estimates are calculated with data collected from employers in all industry sectors, all metropolitan and nonmetropolitan areas, and all states and the District of Columbia. The top employment and wage figures are provided above. The complete list is available in the downloadable XLS files.
The percentile wage estimate is the value of a wage below which a certain percent of workers fall. The median wage is the 50th percentile wage estimate--50 percent of workers earn less than the median and 50 percent of workers earn more than the median. More about percentile wages.
(1) Estimates for detailed occupations do not sum to the totals because the totals include occupations not shown separately. Estimates do not include self-employed workers.
(2) Annual wages have been calculated by multiplying the hourly mean wage by a "year-round, full-time" hours figure of 2,080 hours; for those occupations where there is not an hourly wage published, the annual wage has been directly calculated from the reported survey data.
(3) The relative standard error (RSE) is a measure of the reliability of a survey statistic. The smaller the relative standard error, the more precise the estimate.
(8) Estimate not released.
(9) The location quotient is the ratio of the area concentration of occupational employment to the national average concentration. A location quotient greater than one indicates the occupation has a higher share of employment than average, and a location quotient less than one indicates the occupation is less prevalent in the area than average.
Other OES estimates and related information:
May 2016 National Occupational Employment and Wage Estimates
May 2016 State Occupational Employment and Wage Estimates
May 2016 Metropolitan and Nonmetropolitan Area Occupational Employment and Wage Estimates
May 2016 National Industry-Specific Occupational Employment and Wage Estimates
Last Modified Date: March 31, 2017