
An official website of the United States government
An official website of the United States government
The .gov means it's official.
Federal government websites often end in .gov or .mil. Before sharing sensitive information,
make sure you're on a federal government site.
The site is secure.
The
https:// ensures that you are connecting to the official website and that any
information you provide is encrypted and transmitted securely.
Receive and process incoming orders for materials, merchandise, classified ads, or services such as repairs, installations, or rental of facilities. Generally receives orders via mail, phone, fax, or other electronic means. Duties include informing customers of receipt, prices, shipping dates, and delays; preparing contracts; and handling complaints. Excludes "Dispatchers, Except Police, Fire, and Ambulance" (43-5032) who both dispatch and take orders for services.
Employment estimate and mean wage estimates for this occupation:
| Employment (1) | Employment RSE (3) |
Mean hourly wage |
Mean annual wage (2) |
Wage RSE (3) |
|---|---|---|---|---|
| 176,850 | 1.6 % | $16.90 | $35,160 | 0.5 % |
Percentile wage estimates for this occupation:
| Percentile | 10% | 25% | 50% (Median) |
75% | 90% |
|---|---|---|---|---|---|
| Hourly Wage | $10.01 | $12.48 | $16.04 | $20.20 | $25.06 |
| Annual Wage (2) | $20,820 | $25,960 | $33,370 | $42,010 | $52,130 |
Industries with the highest published employment and wages for this occupation are provided. For a list of all industries with employment in this occupation, see the Create Customized Tables function.
Industries with the highest levels of employment in this occupation:
| Industry | Employment (1) | Percent of industry employment | Hourly mean wage | Annual mean wage (2) |
|---|---|---|---|---|
| Electronic Shopping and Mail-Order Houses | 19,690 | 5.41 | $14.45 | $30,050 |
| Building Material and Supplies Dealers | 7,410 | 0.66 | $17.08 | $35,530 |
| Grocery and Related Product Merchant Wholesalers | 7,360 | 0.99 | $16.52 | $34,350 |
| Wholesale Electronic Markets and Agents and Brokers | 7,290 | 0.82 | $18.67 | $38,840 |
| Machinery, Equipment, and Supplies Merchant Wholesalers | 7,270 | 1.09 | $20.97 | $43,630 |
Industries with the highest concentration of employment in this occupation:
| Industry | Employment (1) | Percent of industry employment | Hourly mean wage | Annual mean wage (2) |
|---|---|---|---|---|
| Electronic Shopping and Mail-Order Houses | 19,690 | 5.41 | $14.45 | $30,050 |
| Apparel, Piece Goods, and Notions Merchant Wholesalers | 3,200 | 2.15 | $15.87 | $33,000 |
| Furniture and Home Furnishing Merchant Wholesalers | 1,960 | 1.85 | $18.26 | $37,980 |
| Drugs and Druggists' Sundries Merchant Wholesalers | 3,220 | 1.62 | $15.81 | $32,890 |
| Paper and Paper Product Merchant Wholesalers | 1,720 | 1.44 | $18.05 | $37,530 |
Top paying industries for this occupation:
| Industry | Employment (1) | Percent of industry employment | Hourly mean wage | Annual mean wage (2) |
|---|---|---|---|---|
| Electric Power Generation, Transmission and Distribution | 220 | 0.06 | $26.65 | $55,430 |
| Support Activities for Mining | (8) | (8) | $25.61 | $53,260 |
| Oil and Gas Extraction | 130 | 0.07 | $23.47 | $48,810 |
| Urban Transit Systems | 60 | 0.12 | $23.45 | $48,780 |
| Office Furniture (including Fixtures) Manufacturing | 520 | 0.48 | $23.18 | $48,210 |
States and areas with the highest published employment, location quotients, and wages for this occupation are provided. For a list of all areas with employment in this occupation, see the Create Customized Tables function.
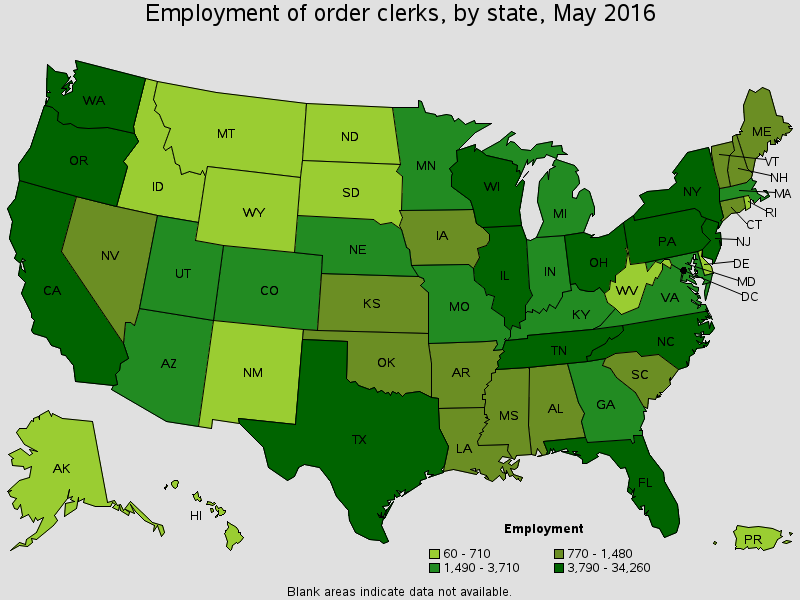
States with the highest employment level in this occupation:
| State | Employment (1) | Employment per thousand jobs | Location quotient (9) | Hourly mean wage | Annual mean wage (2) |
|---|---|---|---|---|---|
| California | 34,260 | 2.15 | 1.70 | $17.53 | $36,470 |
| Texas | 22,100 | 1.88 | 1.49 | $18.76 | $39,020 |
| Ohio | 10,050 | 1.88 | 1.49 | $16.57 | $34,470 |
| Florida | 7,890 | 0.96 | 0.76 | $14.64 | $30,460 |
| Illinois | 7,370 | 1.25 | 0.99 | $17.29 | $35,950 |
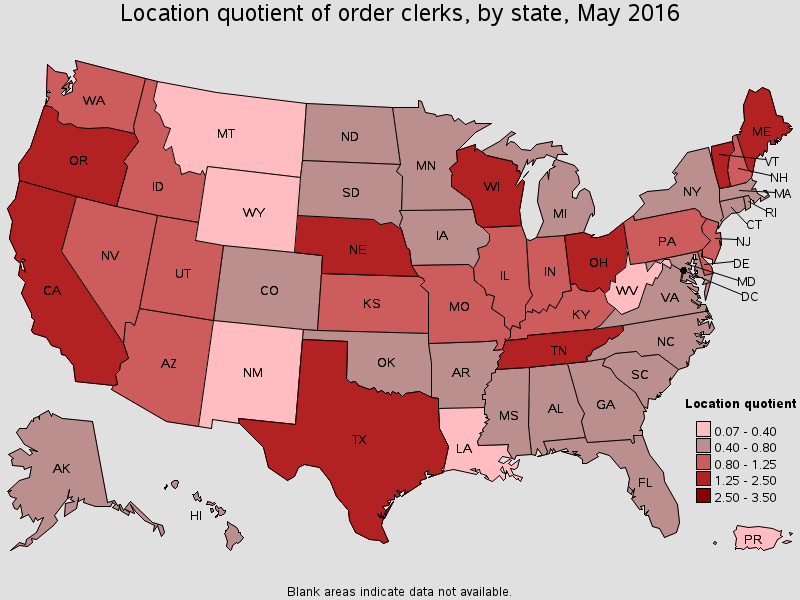
States with the highest concentration of jobs and location quotients in this occupation:
| State | Employment (1) | Employment per thousand jobs | Location quotient (9) | Hourly mean wage | Annual mean wage (2) |
|---|---|---|---|---|---|
| Vermont | 790 | 2.58 | 2.05 | $17.48 | $36,370 |
| Nebraska | 2,420 | 2.50 | 1.99 | $15.48 | $32,190 |
| Oregon | 4,350 | 2.43 | 1.93 | $16.79 | $34,910 |
| California | 34,260 | 2.15 | 1.70 | $17.53 | $36,470 |
| Maine | 1,230 | 2.06 | 1.64 | $15.45 | $32,130 |
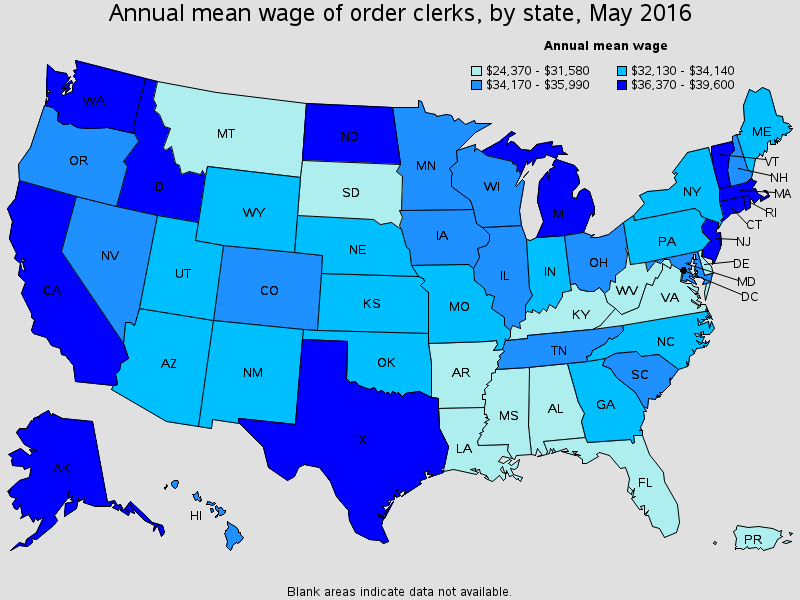
Top paying States for this occupation:
| State | Employment (1) | Employment per thousand jobs | Location quotient (9) | Hourly mean wage | Annual mean wage (2) |
|---|---|---|---|---|---|
| North Dakota | 320 | 0.76 | 0.61 | $19.04 | $39,600 |
| Massachusetts | 2,760 | 0.80 | 0.63 | $18.92 | $39,360 |
| Texas | 22,100 | 1.88 | 1.49 | $18.76 | $39,020 |
| Connecticut | 1,410 | 0.84 | 0.67 | $18.37 | $38,210 |
| Idaho | 710 | 1.07 | 0.85 | $18.16 | $37,770 |
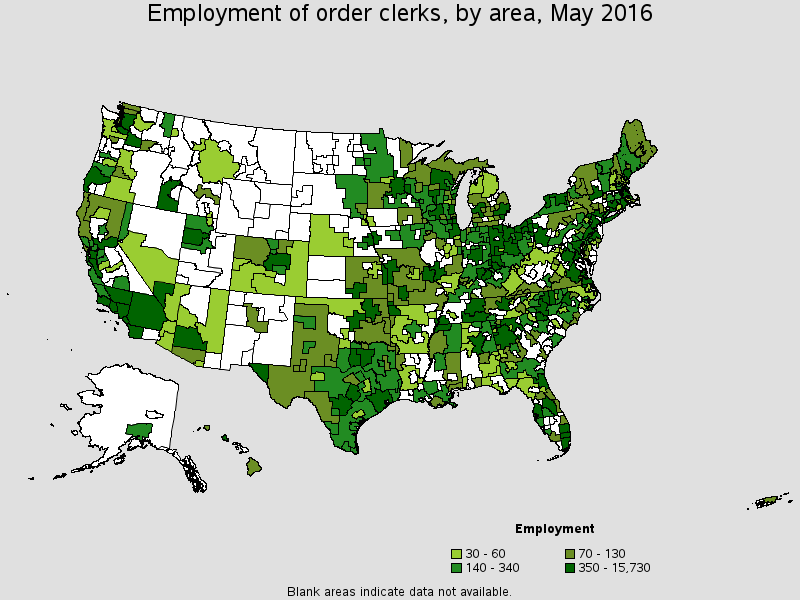
Metropolitan areas with the highest employment level in this occupation:
| Metropolitan area | Employment (1) | Employment per thousand jobs | Location quotient (9) | Hourly mean wage | Annual mean wage (2) |
|---|---|---|---|---|---|
| Los Angeles-Long Beach-Glendale, CA Metropolitan Division | 11,990 | 2.84 | 2.26 | $16.62 | $34,570 |
| Dallas-Plano-Irving, TX Metropolitan Division | 6,630 | 2.73 | 2.17 | $18.34 | $38,150 |
| Houston-The Woodlands-Sugar Land, TX | 6,040 | 2.06 | 1.63 | $22.06 | $45,880 |
| New York-Jersey City-White Plains, NY-NJ Metropolitan Division | 6,020 | 0.91 | 0.73 | $17.11 | $35,580 |
| Chicago-Naperville-Arlington Heights, IL Metropolitan Division | 4,400 | 1.21 | 0.96 | $17.80 | $37,020 |
| Anaheim-Santa Ana-Irvine, CA Metropolitan Division | 3,730 | 2.39 | 1.89 | $16.89 | $35,140 |
| Riverside-San Bernardino-Ontario, CA | 3,250 | 2.38 | 1.89 | $17.32 | $36,020 |
| San Jose-Sunnyvale-Santa Clara, CA | 2,740 | 2.62 | 2.08 | $19.48 | $40,520 |
| Phoenix-Mesa-Scottsdale, AZ | 2,730 | 1.41 | 1.12 | $15.89 | $33,060 |
| San Diego-Carlsbad, CA | 2,440 | 1.76 | 1.40 | $18.25 | $37,970 |
Metropolitan areas with the highest concentration of jobs and location quotients in this occupation:
| Metropolitan area | Employment (1) | Employment per thousand jobs | Location quotient (9) | Hourly mean wage | Annual mean wage (2) |
|---|---|---|---|---|---|
| Danville, IL | 260 | 9.97 | 7.91 | $16.74 | $34,820 |
| Yakima, WA | 380 | 4.44 | 3.52 | $17.28 | $35,930 |
| Omaha-Council Bluffs, NE-IA | 2,070 | 4.28 | 3.39 | $15.74 | $32,740 |
| Madison, WI | 1,470 | 3.84 | 3.05 | $16.01 | $33,310 |
| Oshkosh-Neenah, WI | 330 | 3.64 | 2.89 | $15.55 | $32,350 |
| Mansfield, OH | 180 | 3.46 | 2.74 | $14.87 | $30,920 |
| Portland-South Portland, ME | 630 | 3.14 | 2.49 | $16.24 | $33,780 |
| La Crosse-Onalaska, WI-MN | 210 | 2.94 | 2.34 | $16.87 | $35,100 |
| Los Angeles-Long Beach-Glendale, CA Metropolitan Division | 11,990 | 2.84 | 2.26 | $16.62 | $34,570 |
| Longview, WA | 100 | 2.73 | 2.17 | $18.19 | $37,840 |
Top paying metropolitan areas for this occupation:
| Metropolitan area | Employment (1) | Employment per thousand jobs | Location quotient (9) | Hourly mean wage | Annual mean wage (2) |
|---|---|---|---|---|---|
| Houston-The Woodlands-Sugar Land, TX | 6,040 | 2.06 | 1.63 | $22.06 | $45,880 |
| Grand Rapids-Wyoming, MI | 700 | 1.26 | 1.00 | $21.54 | $44,810 |
| Midland, TX | 120 | 1.33 | 1.06 | $21.37 | $44,460 |
| Trenton, NJ | 190 | 0.86 | 0.68 | $20.79 | $43,250 |
| Boise City, ID | 440 | 1.48 | 1.18 | $20.78 | $43,230 |
| Peabody-Salem-Beverly, MA NECTA Division | (8) | (8) | (8) | $20.63 | $42,910 |
| Santa Rosa, CA | 320 | 1.65 | 1.31 | $20.63 | $42,910 |
| Odessa, TX | 120 | 1.83 | 1.45 | $20.59 | $42,820 |
| Pittsfield, MA | 70 | 1.69 | 1.34 | $20.41 | $42,450 |
| San Francisco-Redwood City-South San Francisco, CA Metropolitan Division | 1,790 | 1.68 | 1.33 | $20.37 | $42,380 |
Nonmetropolitan areas with the highest employment in this occupation:
| Nonmetropolitan area | Employment (1) | Employment per thousand jobs | Location quotient (9) | Hourly mean wage | Annual mean wage (2) |
|---|---|---|---|---|---|
| North Georgia nonmetropolitan area | 480 | 3.02 | 2.39 | $14.27 | $29,690 |
| North Northeastern Ohio non-metropolitan area (non-contiguous) | 470 | 1.42 | 1.13 | $14.79 | $30,750 |
| Northeastern Wisconsin nonmetropolitan area | 470 | 2.30 | 1.82 | $13.79 | $28,690 |
| West Northwestern Ohio nonmetropolitan area | 460 | 1.81 | 1.43 | $17.11 | $35,590 |
| South Coast Oregon nonmetropolitan area | 420 | 6.50 | 5.16 | $11.46 | $23,830 |
Nonmetropolitan areas with the highest concentration of jobs and location quotients in this occupation:
| Nonmetropolitan area | Employment (1) | Employment per thousand jobs | Location quotient (9) | Hourly mean wage | Annual mean wage (2) |
|---|---|---|---|---|---|
| South Coast Oregon nonmetropolitan area | 420 | 6.50 | 5.16 | $11.46 | $23,830 |
| South Central Tennessee nonmetropolitan area | 390 | 3.60 | 2.86 | $13.99 | $29,090 |
| Southern Vermont nonmetropolitan area | 330 | 3.05 | 2.42 | $15.75 | $32,760 |
| North Georgia nonmetropolitan area | 480 | 3.02 | 2.39 | $14.27 | $29,690 |
| Northern New Hampshire nonmetropolitan area | 100 | 2.61 | 2.07 | $13.90 | $28,910 |
Top paying nonmetropolitan areas for this occupation:
| Nonmetropolitan area | Employment (1) | Employment per thousand jobs | Location quotient (9) | Hourly mean wage | Annual mean wage (2) |
|---|---|---|---|---|---|
| West Central New Hampshire nonmetropolitan area | 30 | 0.50 | 0.39 | $20.76 | $43,180 |
| North Nevada nonmetropolitan area | (8) | (8) | (8) | $20.38 | $42,400 |
| Coastal Plains Region of Texas nonmetropolitan area | 210 | 1.41 | 1.12 | $18.77 | $39,050 |
| Eastern Oregon nonmetropolitan area | (8) | (8) | (8) | $18.76 | $39,020 |
| Northwest Lower Peninsula of Michigan nonmetropolitan area | 50 | 0.43 | 0.35 | $18.12 | $37,690 |
These estimates are calculated with data collected from employers in all industry sectors, all metropolitan and nonmetropolitan areas, and all states and the District of Columbia. The top employment and wage figures are provided above. The complete list is available in the downloadable XLS files.
The percentile wage estimate is the value of a wage below which a certain percent of workers fall. The median wage is the 50th percentile wage estimate--50 percent of workers earn less than the median and 50 percent of workers earn more than the median. More about percentile wages.
(1) Estimates for detailed occupations do not sum to the totals because the totals include occupations not shown separately. Estimates do not include self-employed workers.
(2) Annual wages have been calculated by multiplying the hourly mean wage by a "year-round, full-time" hours figure of 2,080 hours; for those occupations where there is not an hourly wage published, the annual wage has been directly calculated from the reported survey data.
(3) The relative standard error (RSE) is a measure of the reliability of a survey statistic. The smaller the relative standard error, the more precise the estimate.
(8) Estimate not released.
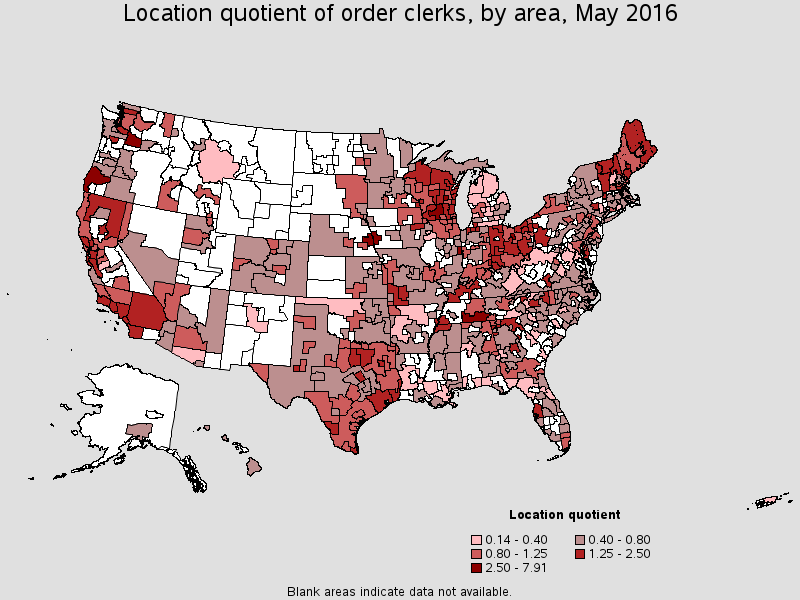
(9) The location quotient is the ratio of the area concentration of occupational employment to the national average concentration. A location quotient greater than one indicates the occupation has a higher share of employment than average, and a location quotient less than one indicates the occupation is less prevalent in the area than average.
Other OES estimates and related information:
May 2016 National Occupational Employment and Wage Estimates
May 2016 State Occupational Employment and Wage Estimates
May 2016 Metropolitan and Nonmetropolitan Area Occupational Employment and Wage Estimates
May 2016 National Industry-Specific Occupational Employment and Wage Estimates
Last Modified Date: March 31, 2017