
An official website of the United States government
 United States Department of Labor
An official website of the United States government
United States Department of Labor

The .gov means it's official.
Federal government websites often end in .gov or .mil. Before sharing sensitive information,
make sure you're on a federal government site.

The site is secure.
The
https:// ensures that you are connecting to the official website and that any
information you provide is encrypted and transmitted securely.


Operate radio, telephone, or computer equipment at emergency response centers. Receive reports from the public of crimes, disturbances, fires, and medical or police emergencies. Relay information to law enforcement and emergency response personnel. May maintain contact with caller until responders arrive.
Employment estimate and mean wage estimates for this occupation:
| Employment (1) | Employment RSE (3) |
Mean hourly wage |
Mean annual wage (2) |
Wage RSE (3) |
|---|---|---|---|---|
| 95,170 | 0.9 % | $19.74 | $41,070 | 0.4 % |
Percentile wage estimates for this occupation:
| Percentile | 10% | 25% | 50% (Median) |
75% | 90% |
|---|---|---|---|---|---|
| Hourly Wage | $12.07 | $14.82 | $18.69 | $23.83 | $29.46 |
| Annual Wage (2) | $25,100 | $30,830 | $38,870 | $49,570 | $61,270 |
Industries with the highest published employment and wages for this occupation are provided. For a list of all industries with employment in this occupation, see the Create Customized Tables function.
Industries with the highest levels of employment in this occupation:
| Industry | Employment (1) | Percent of industry employment | Hourly mean wage | Annual mean wage (2) |
|---|---|---|---|---|
| Local Government (OES Designation) | 76,810 | 1.43 | $19.80 | $41,170 |
| Other Ambulatory Health Care Services | 6,200 | 2.15 | $18.33 | $38,120 |
| State Government (OES Designation) | 5,900 | 0.27 | $22.15 | $46,070 |
| Colleges, Universities, and Professional Schools | 2,100 | 0.07 | $18.98 | $39,470 |
| General Medical and Surgical Hospitals | 2,000 | 0.04 | $17.60 | $36,600 |
Industries with the highest concentration of employment in this occupation:
| Industry | Employment (1) | Percent of industry employment | Hourly mean wage | Annual mean wage (2) |
|---|---|---|---|---|
| Other Ambulatory Health Care Services | 6,200 | 2.15 | $18.33 | $38,120 |
| Local Government (OES Designation) | 76,810 | 1.43 | $19.80 | $41,170 |
| State Government (OES Designation) | 5,900 | 0.27 | $22.15 | $46,070 |
| Colleges, Universities, and Professional Schools | 2,100 | 0.07 | $18.98 | $39,470 |
| Investigation and Security Services | 480 | 0.05 | $17.67 | $36,750 |
Top paying industries for this occupation:
| Industry | Employment (1) | Percent of industry employment | Hourly mean wage | Annual mean wage (2) |
|---|---|---|---|---|
| Scientific Research and Development Services | 50 | 0.01 | $25.86 | $53,790 |
| State Government (OES Designation) | 5,900 | 0.27 | $22.15 | $46,070 |
| Psychiatric and Substance Abuse Hospitals | 70 | 0.03 | $21.83 | $45,410 |
| Offices of Physicians | 90 | (7) | $21.67 | $45,070 |
| Local Government (OES Designation) | 76,810 | 1.43 | $19.80 | $41,170 |
States and areas with the highest published employment, location quotients, and wages for this occupation are provided. For a list of all areas with employment in this occupation, see the Create Customized Tables function.
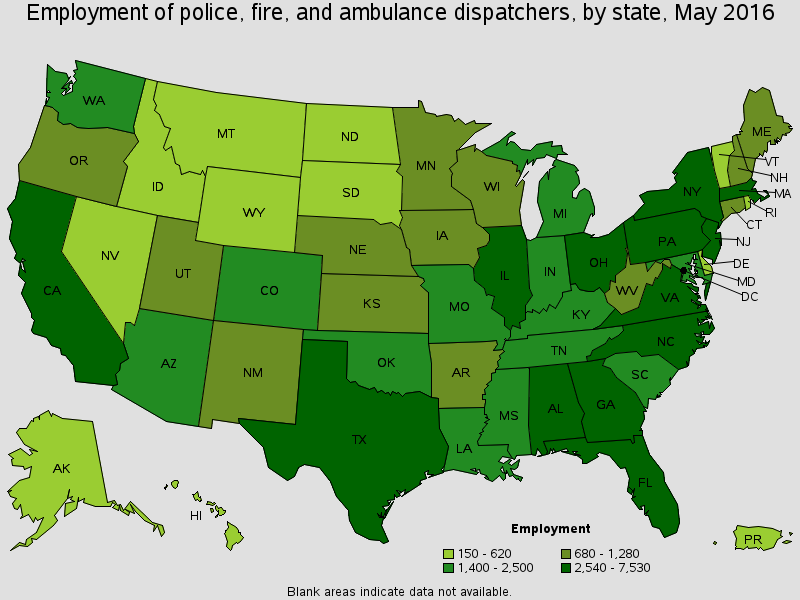
States with the highest employment level in this occupation:
| State | Employment (1) | Employment per thousand jobs | Location quotient (9) | Hourly mean wage | Annual mean wage (2) |
|---|---|---|---|---|---|
| Texas | 7,530 | 0.64 | 0.95 | $17.70 | $36,820 |
| California | 6,680 | 0.42 | 0.62 | $28.87 | $60,040 |
| Florida | 6,120 | 0.74 | 1.10 | $19.23 | $39,990 |
| Ohio | 4,250 | 0.80 | 1.17 | $20.09 | $41,800 |
| New Jersey | 4,190 | 1.06 | 1.56 | $21.69 | $45,110 |
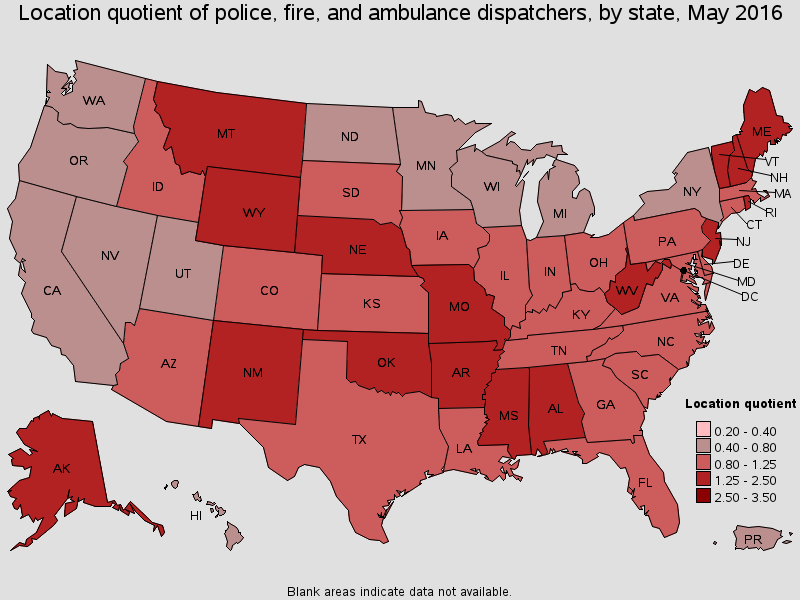
States with the highest concentration of jobs and location quotients in this occupation:
| State | Employment (1) | Employment per thousand jobs | Location quotient (9) | Hourly mean wage | Annual mean wage (2) |
|---|---|---|---|---|---|
| Alabama | 2,540 | 1.33 | 1.96 | $15.42 | $32,080 |
| West Virginia | 900 | 1.29 | 1.90 | $13.89 | $28,900 |
| Mississippi | 1,400 | 1.25 | 1.84 | $12.28 | $25,550 |
| Maine | 700 | 1.18 | 1.74 | $19.14 | $39,800 |
| New Hampshire | 730 | 1.14 | 1.68 | $20.45 | $42,540 |
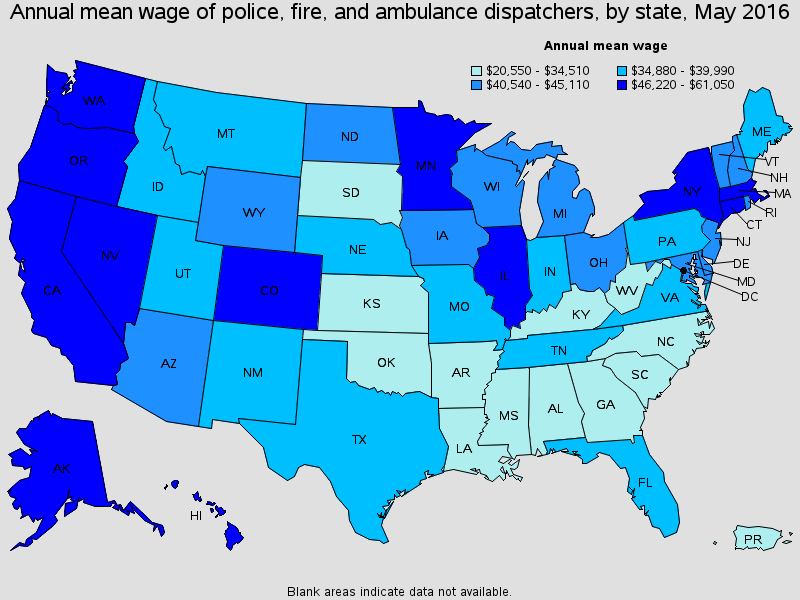
Top paying States for this occupation:
| State | Employment (1) | Employment per thousand jobs | Location quotient (9) | Hourly mean wage | Annual mean wage (2) |
|---|---|---|---|---|---|
| District of Columbia | 150 | 0.21 | 0.31 | $29.35 | $61,050 |
| California | 6,680 | 0.42 | 0.62 | $28.87 | $60,040 |
| Nevada | 620 | 0.49 | 0.72 | $27.84 | $57,910 |
| Oregon | 850 | 0.47 | 0.70 | $26.30 | $54,710 |
| Washington | 1,420 | 0.46 | 0.68 | $26.26 | $54,630 |
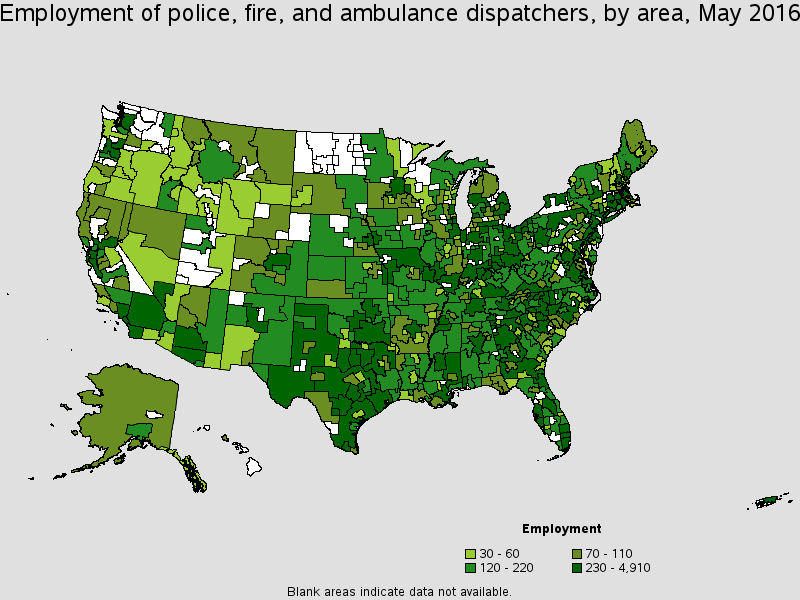
Metropolitan areas with the highest employment level in this occupation:
| Metropolitan area | Employment (1) | Employment per thousand jobs | Location quotient (9) | Hourly mean wage | Annual mean wage (2) |
|---|---|---|---|---|---|
| New York-Jersey City-White Plains, NY-NJ Metropolitan Division | 2,720 | 0.41 | 0.61 | $21.45 | $44,620 |
| Chicago-Naperville-Arlington Heights, IL Metropolitan Division | 1,760 | 0.48 | 0.71 | $27.05 | $56,260 |
| Houston-The Woodlands-Sugar Land, TX | 1,290 | 0.44 | 0.65 | $18.65 | $38,800 |
| Atlanta-Sandy Springs-Roswell, GA | 1,280 | 0.50 | 0.74 | $16.69 | $34,710 |
| Washington-Arlington-Alexandria, DC-VA-MD-WV Metropolitan Division | 1,160 | 0.46 | 0.69 | $23.72 | $49,350 |
| Nassau County-Suffolk County, NY Metropolitan Division | 1,090 | 0.85 | 1.25 | $24.50 | $50,960 |
| Phoenix-Mesa-Scottsdale, AZ | 1,090 | 0.56 | 0.83 | $22.72 | $47,260 |
| Dallas-Plano-Irving, TX Metropolitan Division | 1,030 | 0.43 | 0.63 | $20.13 | $41,870 |
| Los Angeles-Long Beach-Glendale, CA Metropolitan Division | 1,010 | 0.24 | 0.35 | $28.15 | $58,540 |
| Boston-Cambridge-Newton, MA NECTA Division | 1,000 | 0.56 | 0.82 | $23.57 | $49,020 |
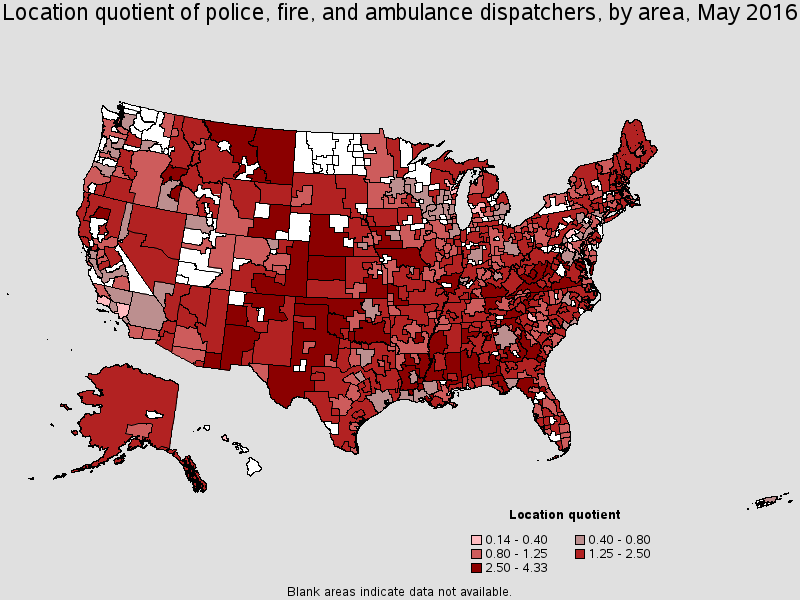
Metropolitan areas with the highest concentration of jobs and location quotients in this occupation:
| Metropolitan area | Employment (1) | Employment per thousand jobs | Location quotient (9) | Hourly mean wage | Annual mean wage (2) |
|---|---|---|---|---|---|
| Anniston-Oxford-Jacksonville, AL | 100 | 2.37 | 3.50 | $15.74 | $32,730 |
| The Villages, FL | 50 | 2.02 | 2.98 | $13.51 | $28,100 |
| Dothan, AL | 110 | 1.99 | 2.94 | $13.65 | $28,380 |
| Gadsden, AL | 70 | 1.90 | 2.81 | $13.35 | $27,760 |
| Beckley, WV | 80 | 1.90 | 2.80 | $11.45 | $23,820 |
| Hinesville, GA | 30 | 1.79 | 2.65 | $13.58 | $28,250 |
| Sierra Vista-Douglas, AZ | 60 | 1.77 | 2.60 | $21.48 | $44,670 |
| Pine Bluff, AR | 50 | 1.73 | 2.56 | $12.02 | $25,010 |
| Redding, CA | 100 | 1.72 | 2.54 | $24.93 | $51,860 |
| Atlantic City-Hammonton, NJ | 220 | 1.72 | 2.54 | $22.84 | $47,520 |
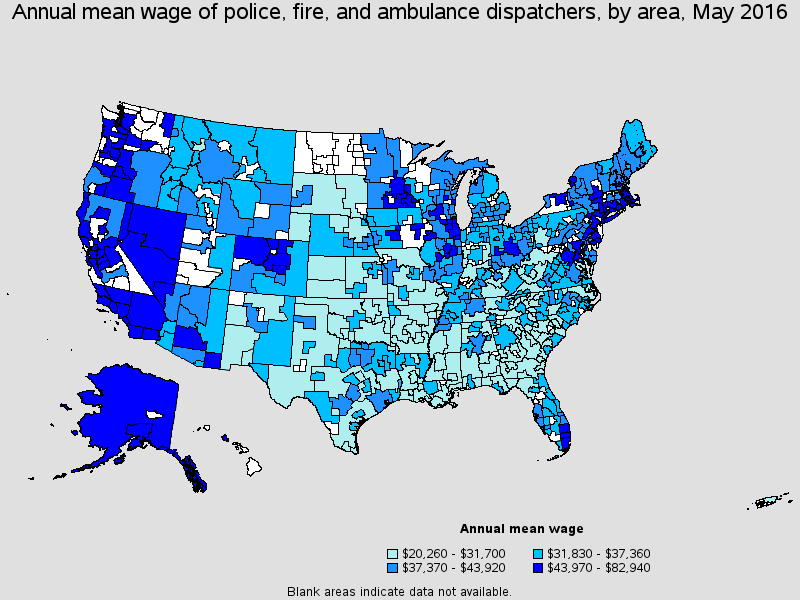
Top paying metropolitan areas for this occupation:
| Metropolitan area | Employment (1) | Employment per thousand jobs | Location quotient (9) | Hourly mean wage | Annual mean wage (2) |
|---|---|---|---|---|---|
| San Jose-Sunnyvale-Santa Clara, CA | 390 | 0.37 | 0.54 | $39.87 | $82,940 |
| Oakland-Hayward-Berkeley, CA Metropolitan Division | 420 | 0.39 | 0.57 | $35.13 | $73,060 |
| Santa Cruz-Watsonville, CA | 60 | 0.63 | 0.93 | $33.08 | $68,810 |
| Springfield, IL | 80 | 0.78 | 1.15 | $32.15 | $66,880 |
| Santa Maria-Santa Barbara, CA | 40 | 0.23 | 0.34 | $32.04 | $66,630 |
| San Francisco-Redwood City-South San Francisco, CA Metropolitan Division | 290 | 0.27 | 0.40 | $31.94 | $66,440 |
| Anaheim-Santa Ana-Irvine, CA Metropolitan Division | 470 | 0.30 | 0.45 | $31.07 | $64,620 |
| Tacoma-Lakewood, WA Metropolitan Division | 160 | 0.57 | 0.85 | $29.96 | $62,320 |
| Las Vegas-Henderson-Paradise, NV | 390 | 0.42 | 0.62 | $29.84 | $62,070 |
| Portland-Vancouver-Hillsboro, OR-WA | 360 | 0.32 | 0.47 | $29.19 | $60,720 |
Nonmetropolitan areas with the highest employment in this occupation:
| Nonmetropolitan area | Employment (1) | Employment per thousand jobs | Location quotient (9) | Hourly mean wage | Annual mean wage (2) |
|---|---|---|---|---|---|
| South Central Kentucky nonmetropolitan area | 390 | 2.30 | 3.39 | $13.08 | $27,200 |
| North Northeastern Ohio non-metropolitan area (non-contiguous) | 370 | 1.11 | 1.64 | $17.70 | $36,820 |
| North Georgia nonmetropolitan area | 350 | 2.21 | 3.26 | $13.63 | $28,340 |
| Southeast Oklahoma nonmetropolitan area | 350 | 2.05 | 3.03 | $13.45 | $27,970 |
| West Texas nonmetropolitan area | 350 | 1.77 | 2.62 | $14.24 | $29,610 |
Nonmetropolitan areas with the highest concentration of jobs and location quotients in this occupation:
| Nonmetropolitan area | Employment (1) | Employment per thousand jobs | Location quotient (9) | Hourly mean wage | Annual mean wage (2) |
|---|---|---|---|---|---|
| North Missouri nonmetropolitan area | 320 | 2.94 | 4.33 | $14.04 | $29,190 |
| South Illinois nonmetropolitan area | 270 | 2.93 | 4.32 | $16.70 | $34,730 |
| Southwest Louisiana nonmetropolitan area | 170 | 2.87 | 4.23 | $14.72 | $30,620 |
| East Montana nonmetropolitan area | 90 | 2.83 | 4.17 | $16.27 | $33,840 |
| Southern West Virginia nonmetropolitan area | 210 | 2.73 | 4.03 | $12.21 | $25,390 |
Top paying nonmetropolitan areas for this occupation:
| Nonmetropolitan area | Employment (1) | Employment per thousand jobs | Location quotient (9) | Hourly mean wage | Annual mean wage (2) |
|---|---|---|---|---|---|
| Connecticut nonmetropolitan area | 40 | 1.26 | 1.85 | $26.50 | $55,130 |
| Mother Lode Region of California nonmetropolitan area | 50 | 1.31 | 1.93 | $25.52 | $53,070 |
| North Coast Region of California nonmetropolitan area | 110 | 1.14 | 1.68 | $24.88 | $51,740 |
| Southeast Alaska nonmetropolitan area | 50 | 1.43 | 2.11 | $24.65 | $51,270 |
| Nantucket Island and Martha's Vineyard nonmetropolitan area | 40 | 2.15 | 3.17 | $23.81 | $49,530 |
These estimates are calculated with data collected from employers in all industry sectors, all metropolitan and nonmetropolitan areas, and all states and the District of Columbia. The top employment and wage figures are provided above. The complete list is available in the downloadable XLS files.
The percentile wage estimate is the value of a wage below which a certain percent of workers fall. The median wage is the 50th percentile wage estimate--50 percent of workers earn less than the median and 50 percent of workers earn more than the median. More about percentile wages.
(1) Estimates for detailed occupations do not sum to the totals because the totals include occupations not shown separately. Estimates do not include self-employed workers.
(2) Annual wages have been calculated by multiplying the hourly mean wage by a "year-round, full-time" hours figure of 2,080 hours; for those occupations where there is not an hourly wage published, the annual wage has been directly calculated from the reported survey data.
(3) The relative standard error (RSE) is a measure of the reliability of a survey statistic. The smaller the relative standard error, the more precise the estimate.
(7) The value is less than .005 percent of industry employment.
(9) The location quotient is the ratio of the area concentration of occupational employment to the national average concentration. A location quotient greater than one indicates the occupation has a higher share of employment than average, and a location quotient less than one indicates the occupation is less prevalent in the area than average.
Other OES estimates and related information:
May 2016 National Occupational Employment and Wage Estimates
May 2016 State Occupational Employment and Wage Estimates
May 2016 Metropolitan and Nonmetropolitan Area Occupational Employment and Wage Estimates
May 2016 National Industry-Specific Occupational Employment and Wage Estimates
Last Modified Date: March 31, 2017