
An official website of the United States government
An official website of the United States government
The .gov means it's official.
Federal government websites often end in .gov or .mil. Before sharing sensitive information,
make sure you're on a federal government site.
The site is secure.
The
https:// ensures that you are connecting to the official website and that any
information you provide is encrypted and transmitted securely.
Perform secretarial duties using legal terminology, procedures, and documents. Prepare legal papers and correspondence, such as summonses, complaints, motions, and subpoenas. May also assist with legal research.
Employment estimate and mean wage estimates for this occupation:
| Employment (1) | Employment RSE (3) |
Mean hourly wage |
Mean annual wage (2) |
Wage RSE (3) |
|---|---|---|---|---|
| 191,200 | 1.5 % | $23.03 | $47,900 | 0.8 % |
Percentile wage estimates for this occupation:
| Percentile | 10% | 25% | 50% (Median) |
75% | 90% |
|---|---|---|---|---|---|
| Hourly Wage | $12.97 | $16.11 | $21.24 | $28.56 | $36.31 |
| Annual Wage (2) | $26,970 | $33,510 | $44,180 | $59,410 | $75,530 |
Industries with the highest published employment and wages for this occupation are provided. For a list of all industries with employment in this occupation, see the Create Customized Tables function.
Industries with the highest levels of employment in this occupation:
| Industry | Employment (1) | Percent of industry employment | Hourly mean wage | Annual mean wage (2) |
|---|---|---|---|---|
| Legal Services | 161,590 | 14.39 | $23.15 | $48,140 |
| Local Government (OES Designation) | 10,770 | 0.20 | $21.27 | $44,240 |
| State Government (OES Designation) | 8,880 | 0.41 | $21.33 | $44,370 |
| Employment Services | 1,710 | 0.05 | $21.51 | $44,740 |
| Insurance Carriers | 1,620 | 0.14 | $25.90 | $53,860 |
Industries with the highest concentration of employment in this occupation:
| Industry | Employment (1) | Percent of industry employment | Hourly mean wage | Annual mean wage (2) |
|---|---|---|---|---|
| Legal Services | 161,590 | 14.39 | $23.15 | $48,140 |
| Other Investment Pools and Funds | 70 | 1.19 | $21.18 | $44,050 |
| State Government (OES Designation) | 8,880 | 0.41 | $21.33 | $44,370 |
| Local Government (OES Designation) | 10,770 | 0.20 | $21.27 | $44,240 |
| Insurance Carriers | 1,620 | 0.14 | $25.90 | $53,860 |
Top paying industries for this occupation:
| Industry | Employment (1) | Percent of industry employment | Hourly mean wage | Annual mean wage (2) |
|---|---|---|---|---|
| Natural Gas Distribution | 30 | 0.03 | $36.55 | $76,030 |
| Navigational, Measuring, Electromedical, and Control Instruments Manufacturing | 50 | 0.01 | $30.83 | $64,130 |
| Architectural, Engineering, and Related Services | 50 | (7) | $29.94 | $62,270 |
| Securities and Commodity Contracts Intermediation and Brokerage | 40 | 0.01 | $29.21 | $60,750 |
| Professional and Commercial Equipment and Supplies Merchant Wholesalers | 30 | (7) | $29.11 | $60,540 |
States and areas with the highest published employment, location quotients, and wages for this occupation are provided. For a list of all areas with employment in this occupation, see the Create Customized Tables function.
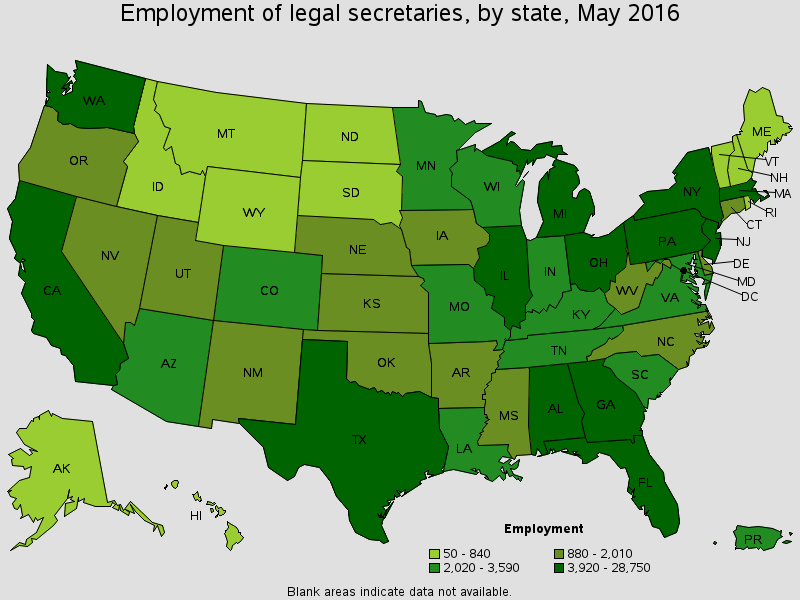
States with the highest employment level in this occupation:
| State | Employment (1) | Employment per thousand jobs | Location quotient (9) | Hourly mean wage | Annual mean wage (2) |
|---|---|---|---|---|---|
| California | 28,750 | 1.80 | 1.32 | $26.20 | $54,500 |
| New York | 14,840 | 1.63 | 1.20 | $30.31 | $63,050 |
| Texas | 14,010 | 1.19 | 0.88 | $21.53 | $44,790 |
| Florida | 10,410 | 1.27 | 0.93 | $20.25 | $42,130 |
| Pennsylvania | 9,630 | 1.68 | 1.23 | $22.09 | $45,940 |
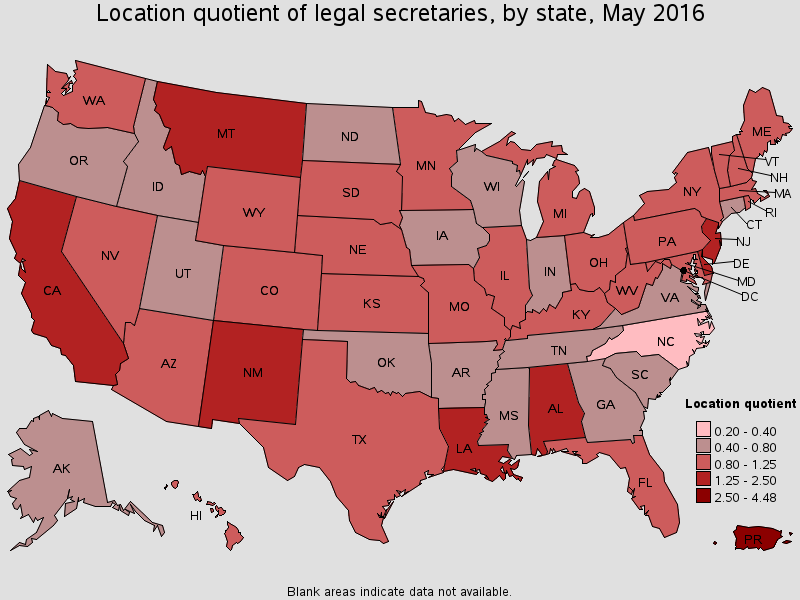
States with the highest concentration of jobs and location quotients in this occupation:
| State | Employment (1) | Employment per thousand jobs | Location quotient (9) | Hourly mean wage | Annual mean wage (2) |
|---|---|---|---|---|---|
| District of Columbia | 4,290 | 6.10 | 4.48 | $39.22 | $81,590 |
| New Jersey | 8,990 | 2.27 | 1.67 | $22.63 | $47,070 |
| Alabama | 3,960 | 2.07 | 1.52 | $18.48 | $38,430 |
| Delaware | 880 | 2.00 | 1.47 | $25.84 | $53,750 |
| New Mexico | 1,550 | 1.92 | 1.41 | $17.74 | $36,900 |
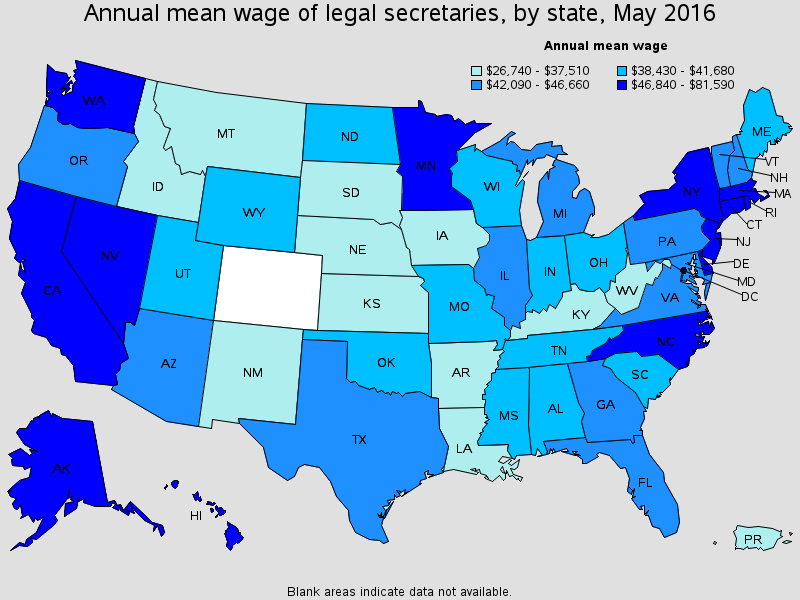
Top paying States for this occupation:
| State | Employment (1) | Employment per thousand jobs | Location quotient (9) | Hourly mean wage | Annual mean wage (2) |
|---|---|---|---|---|---|
| District of Columbia | 4,290 | 6.10 | 4.48 | $39.22 | $81,590 |
| New York | 14,840 | 1.63 | 1.20 | $30.31 | $63,050 |
| California | 28,750 | 1.80 | 1.32 | $26.20 | $54,500 |
| Delaware | 880 | 2.00 | 1.47 | $25.84 | $53,750 |
| Massachusetts | 4,220 | 1.22 | 0.90 | $25.71 | $53,480 |
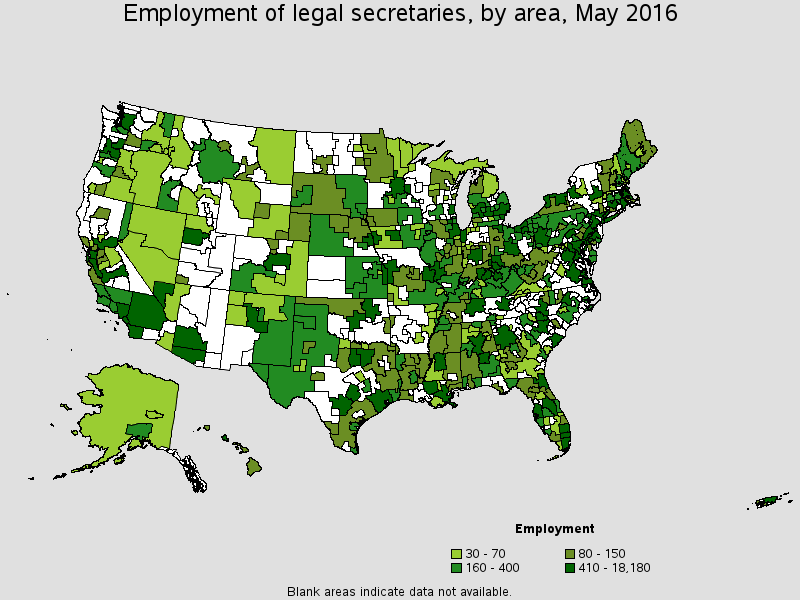
Metropolitan areas with the highest employment level in this occupation:
| Metropolitan area | Employment (1) | Employment per thousand jobs | Location quotient (9) | Hourly mean wage | Annual mean wage (2) |
|---|---|---|---|---|---|
| New York-Jersey City-White Plains, NY-NJ Metropolitan Division | 12,730 | 1.93 | 1.42 | $30.58 | $63,620 |
| Los Angeles-Long Beach-Glendale, CA Metropolitan Division | 11,280 | 2.67 | 1.96 | $26.60 | $55,340 |
| Chicago-Naperville-Arlington Heights, IL Metropolitan Division | 6,690 | 1.84 | 1.35 | $23.74 | $49,370 |
| Washington-Arlington-Alexandria, DC-VA-MD-WV Metropolitan Division | 5,680 | 2.28 | 1.67 | $35.92 | $74,710 |
| Dallas-Plano-Irving, TX Metropolitan Division | 3,960 | 1.63 | 1.20 | $25.08 | $52,160 |
| Philadelphia, PA Metropolitan Division | 3,910 | 4.39 | 3.22 | $23.70 | $49,300 |
| Anaheim-Santa Ana-Irvine, CA Metropolitan Division | 3,510 | 2.24 | 1.65 | $23.73 | $49,370 |
| Newark, NJ-PA Metropolitan Division | 3,430 | 2.96 | 2.17 | $23.03 | $47,900 |
| Houston-The Woodlands-Sugar Land, TX | 3,310 | 1.13 | 0.83 | $23.26 | $48,390 |
| Atlanta-Sandy Springs-Roswell, GA | 2,830 | 1.11 | 0.81 | $23.46 | $48,790 |
Metropolitan areas with the highest concentration of jobs and location quotients in this occupation:
| Metropolitan area | Employment (1) | Employment per thousand jobs | Location quotient (9) | Hourly mean wage | Annual mean wage (2) |
|---|---|---|---|---|---|
| Philadelphia, PA Metropolitan Division | 3,910 | 4.39 | 3.22 | $23.70 | $49,300 |
| Missoula, MT | 210 | 3.62 | 2.66 | $14.87 | $30,930 |
| Dothan, AL | 190 | 3.45 | 2.54 | $16.67 | $34,680 |
| Santa Fe, NM | 210 | 3.41 | 2.50 | $20.02 | $41,640 |
| Alexandria, LA | 190 | 3.17 | 2.33 | $17.34 | $36,070 |
| Great Falls, MT | 110 | 3.01 | 2.21 | $17.14 | $35,640 |
| Montgomery, AL | 490 | 2.99 | 2.19 | $18.78 | $39,050 |
| Wheeling, WV-OH | 190 | 2.98 | 2.19 | $16.43 | $34,180 |
| Newark, NJ-PA Metropolitan Division | 3,430 | 2.96 | 2.17 | $23.03 | $47,900 |
| Topeka, KS | 320 | 2.88 | 2.11 | $14.53 | $30,220 |
Top paying metropolitan areas for this occupation:
| Metropolitan area | Employment (1) | Employment per thousand jobs | Location quotient (9) | Hourly mean wage | Annual mean wage (2) |
|---|---|---|---|---|---|
| Washington-Arlington-Alexandria, DC-VA-MD-WV Metropolitan Division | 5,680 | 2.28 | 1.67 | $35.92 | $74,710 |
| San Rafael, CA Metropolitan Division | (8) | (8) | (8) | $35.70 | $74,260 |
| San Francisco-Redwood City-South San Francisco, CA Metropolitan Division | 2,660 | 2.50 | 1.83 | $35.01 | $72,820 |
| San Jose-Sunnyvale-Santa Clara, CA | 1,080 | 1.03 | 0.76 | $32.70 | $68,010 |
| New York-Jersey City-White Plains, NY-NJ Metropolitan Division | 12,730 | 1.93 | 1.42 | $30.58 | $63,620 |
| Boston-Cambridge-Newton, MA NECTA Division | 2,540 | 1.41 | 1.03 | $28.66 | $59,620 |
| Utica-Rome, NY | 50 | 0.44 | 0.32 | $28.32 | $58,910 |
| Oakland-Hayward-Berkeley, CA Metropolitan Division | 1,050 | 0.97 | 0.71 | $28.30 | $58,850 |
| Nassau County-Suffolk County, NY Metropolitan Division | 1,890 | 1.47 | 1.08 | $28.02 | $58,290 |
| Rockford, IL | 110 | 0.77 | 0.57 | $27.89 | $58,010 |
Nonmetropolitan areas with the highest employment in this occupation:
| Nonmetropolitan area | Employment (1) | Employment per thousand jobs | Location quotient (9) | Hourly mean wage | Annual mean wage (2) |
|---|---|---|---|---|---|
| Balance of Lower Peninsula of Michigan nonmetropolitan area | 400 | 1.45 | 1.06 | $14.03 | $29,180 |
| North Northeastern Ohio non-metropolitan area (non-contiguous) | 370 | 1.11 | 0.81 | $15.18 | $31,580 |
| South Central Kentucky nonmetropolitan area | 310 | 1.84 | 1.35 | $13.37 | $27,810 |
| Central Kentucky nonmetropolitan area | 310 | 1.70 | 1.25 | $11.10 | $23,090 |
| West Central Illinois nonmetropolitan area | 280 | 1.58 | 1.16 | $16.54 | $34,400 |
Nonmetropolitan areas with the highest concentration of jobs and location quotients in this occupation:
| Nonmetropolitan area | Employment (1) | Employment per thousand jobs | Location quotient (9) | Hourly mean wage | Annual mean wage (2) |
|---|---|---|---|---|---|
| Southeast Alabama nonmetropolitan area | 260 | 3.06 | 2.25 | $14.82 | $30,830 |
| Southwest Colorado nonmetropolitan area | 260 | 2.72 | 2.00 | $19.18 | $39,900 |
| Northwest Nebraska nonmetropolitan area | 100 | 2.55 | 1.87 | $17.98 | $37,390 |
| Northeast Iowa nonmetropolitan area | 230 | 2.32 | 1.70 | $14.13 | $29,390 |
| South Illinois nonmetropolitan area | 210 | 2.30 | 1.69 | (8) | (8) |
Top paying nonmetropolitan areas for this occupation:
| Nonmetropolitan area | Employment (1) | Employment per thousand jobs | Location quotient (9) | Hourly mean wage | Annual mean wage (2) |
|---|---|---|---|---|---|
| North Coast Region of California nonmetropolitan area | (8) | (8) | (8) | $24.36 | $50,660 |
| Balance of Alaska nonmetropolitan area | 50 | 0.67 | 0.49 | $23.53 | $48,940 |
| South Nevada nonmetropolitan area | 30 | 0.65 | 0.48 | $22.20 | $46,170 |
| Northwestern Wisconsin nonmetropolitan area | (8) | (8) | (8) | $22.14 | $46,050 |
| Central New Hampshire nonmetropolitan area | 220 | 2.25 | 1.65 | $22.11 | $45,990 |
These estimates are calculated with data collected from employers in all industry sectors, all metropolitan and nonmetropolitan areas, and all states and the District of Columbia. The top employment and wage figures are provided above. The complete list is available in the downloadable XLS files.
The percentile wage estimate is the value of a wage below which a certain percent of workers fall. The median wage is the 50th percentile wage estimate--50 percent of workers earn less than the median and 50 percent of workers earn more than the median. More about percentile wages.
(1) Estimates for detailed occupations do not sum to the totals because the totals include occupations not shown separately. Estimates do not include self-employed workers.
(2) Annual wages have been calculated by multiplying the hourly mean wage by a "year-round, full-time" hours figure of 2,080 hours; for those occupations where there is not an hourly wage published, the annual wage has been directly calculated from the reported survey data.
(3) The relative standard error (RSE) is a measure of the reliability of a survey statistic. The smaller the relative standard error, the more precise the estimate.
(7) The value is less than .005 percent of industry employment.
(8) Estimate not released.
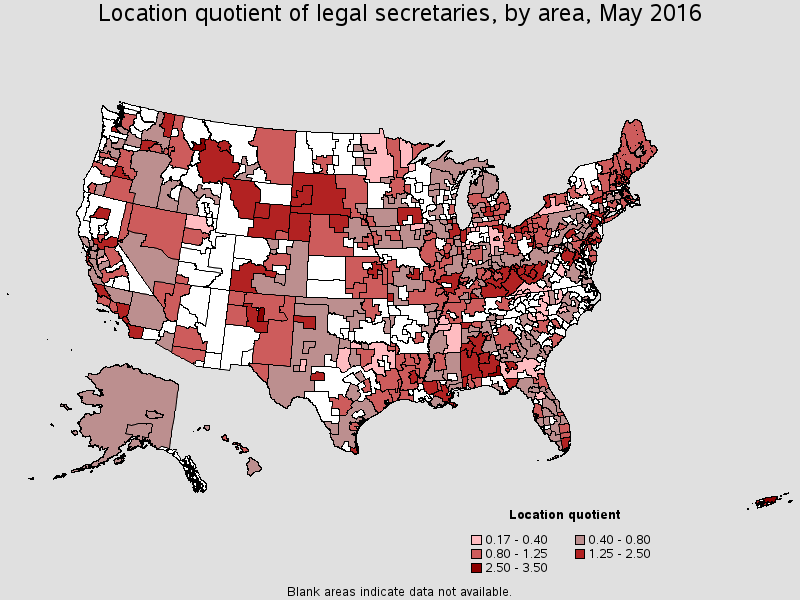
(9) The location quotient is the ratio of the area concentration of occupational employment to the national average concentration. A location quotient greater than one indicates the occupation has a higher share of employment than average, and a location quotient less than one indicates the occupation is less prevalent in the area than average.
Other OES estimates and related information:
May 2016 National Occupational Employment and Wage Estimates
May 2016 State Occupational Employment and Wage Estimates
May 2016 Metropolitan and Nonmetropolitan Area Occupational Employment and Wage Estimates
May 2016 National Industry-Specific Occupational Employment and Wage Estimates
Last Modified Date: March 31, 2017