
An official website of the United States government
An official website of the United States government
The .gov means it's official.
Federal government websites often end in .gov or .mil. Before sharing sensitive information,
make sure you're on a federal government site.
The site is secure.
The
https:// ensures that you are connecting to the official website and that any
information you provide is encrypted and transmitted securely.
Perform duties too varied and diverse to be classified in any specific office clerical occupation, requiring knowledge of office systems and procedures. Clerical duties may be assigned in accordance with the office procedures of individual establishments and may include a combination of answering telephones, bookkeeping, typing or word processing, stenography, office machine operation, and filing.
Employment estimate and mean wage estimates for this occupation:
| Employment (1) | Employment RSE (3) |
Mean hourly wage |
Mean annual wage (2) |
Wage RSE (3) |
|---|---|---|---|---|
| 2,955,550 | 0.4 % | $15.87 | $33,010 | 0.2 % |
Percentile wage estimates for this occupation:
| Percentile | 10% | 25% | 50% (Median) |
75% | 90% |
|---|---|---|---|---|---|
| Hourly Wage | $9.28 | $11.20 | $14.70 | $19.01 | $24.24 |
| Annual Wage (2) | $19,300 | $23,300 | $30,580 | $39,530 | $50,410 |
Industries with the highest published employment and wages for this occupation are provided. For a list of all industries with employment in this occupation, see the Create Customized Tables function.
Industries with the highest levels of employment in this occupation:
| Industry | Employment (1) | Percent of industry employment | Hourly mean wage | Annual mean wage (2) |
|---|---|---|---|---|
| Local Government (OES Designation) | 170,820 | 3.18 | $16.77 | $34,890 |
| Employment Services | 151,190 | 4.18 | $14.50 | $30,160 |
| Colleges, Universities, and Professional Schools | 135,430 | 4.50 | $15.03 | $31,270 |
| Elementary and Secondary Schools | 118,690 | 1.41 | $15.22 | $31,660 |
| State Government (OES Designation) | 80,960 | 3.70 | $16.18 | $33,660 |
Industries with the highest concentration of employment in this occupation:
| Industry | Employment (1) | Percent of industry employment | Hourly mean wage | Annual mean wage (2) |
|---|---|---|---|---|
| Offices of Real Estate Agents and Brokers | 34,590 | 11.51 | $15.30 | $31,820 |
| Office Administrative Services | 37,610 | 7.81 | $15.50 | $32,240 |
| Agents and Managers for Artists, Athletes, Entertainers, and Other Public Figures | 1,770 | 7.37 | $15.73 | $32,710 |
| Other Investment Pools and Funds | 400 | 6.93 | $14.75 | $30,680 |
| Death Care Services | 8,710 | 6.38 | $14.37 | $29,890 |
Top paying industries for this occupation:
| Industry | Employment (1) | Percent of industry employment | Hourly mean wage | Annual mean wage (2) |
|---|---|---|---|---|
| Natural Gas Distribution | 3,100 | 2.74 | $27.19 | $56,560 |
| Postal Service | 1,260 | 0.20 | $27.11 | $56,390 |
| Alumina and Aluminum Production and Processing | 530 | 0.91 | $21.76 | $45,260 |
| Motor Vehicle Manufacturing | 380 | 0.18 | $21.74 | $45,220 |
| Wired Telecommunications Carriers | 5,470 | 0.95 | $21.02 | $43,710 |
States and areas with the highest published employment, location quotients, and wages for this occupation are provided. For a list of all areas with employment in this occupation, see the Create Customized Tables function.
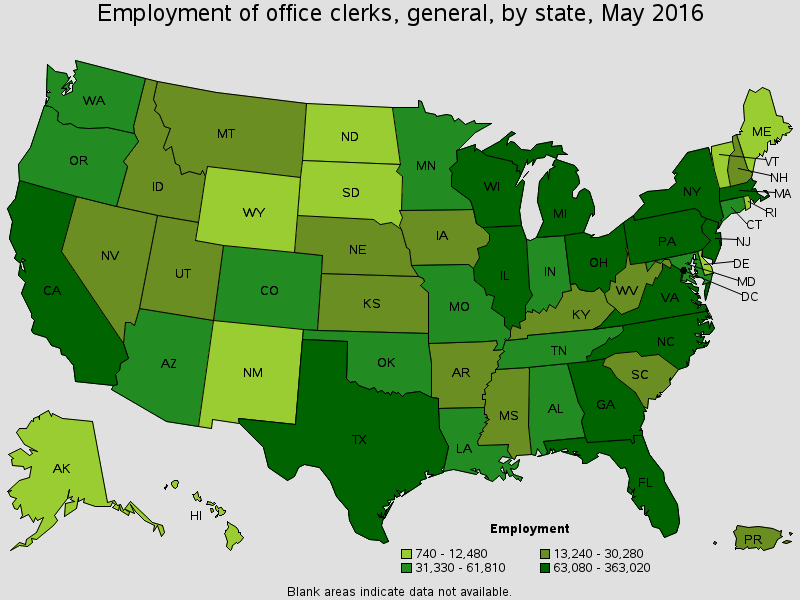
States with the highest employment level in this occupation:
| State | Employment (1) | Employment per thousand jobs | Location quotient (9) | Hourly mean wage | Annual mean wage (2) |
|---|---|---|---|---|---|
| Texas | 363,020 | 30.91 | 1.47 | $16.53 | $34,380 |
| California | 320,890 | 20.10 | 0.95 | $16.96 | $35,270 |
| New York | 188,240 | 20.69 | 0.98 | $15.91 | $33,090 |
| Florida | 163,290 | 19.86 | 0.94 | $14.25 | $29,630 |
| Pennsylvania | 143,570 | 24.98 | 1.19 | $15.72 | $32,710 |
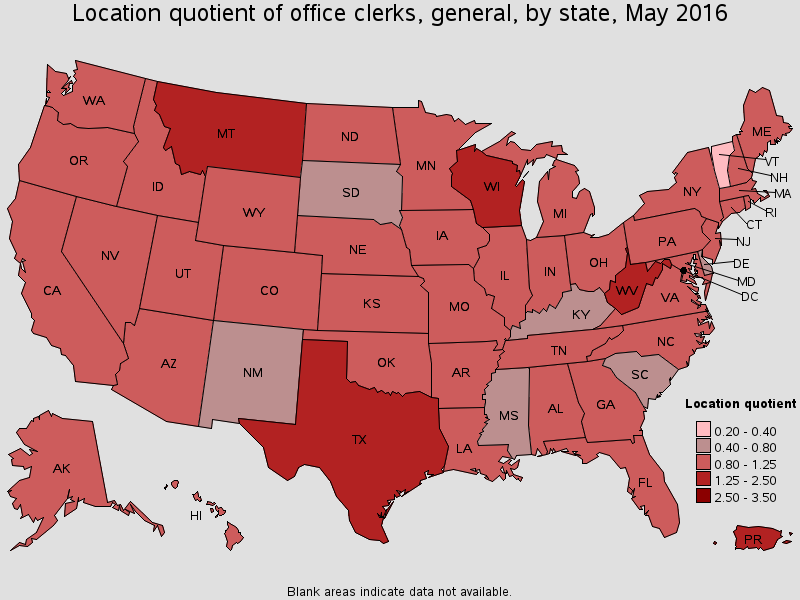
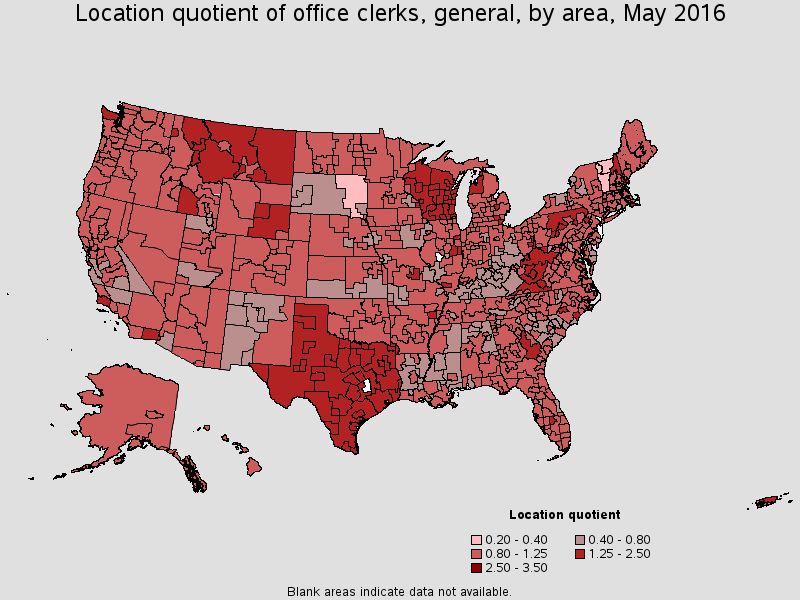
States with the highest concentration of jobs and location quotients in this occupation:
| State | Employment (1) | Employment per thousand jobs | Location quotient (9) | Hourly mean wage | Annual mean wage (2) |
|---|---|---|---|---|---|
| West Virginia | 24,630 | 35.31 | 1.68 | $13.34 | $27,750 |
| Texas | 363,020 | 30.91 | 1.47 | $16.53 | $34,380 |
| Wisconsin | 84,250 | 30.04 | 1.43 | $16.12 | $33,520 |
| Montana | 13,240 | 29.12 | 1.38 | $14.73 | $30,630 |
| Pennsylvania | 143,570 | 24.98 | 1.19 | $15.72 | $32,710 |
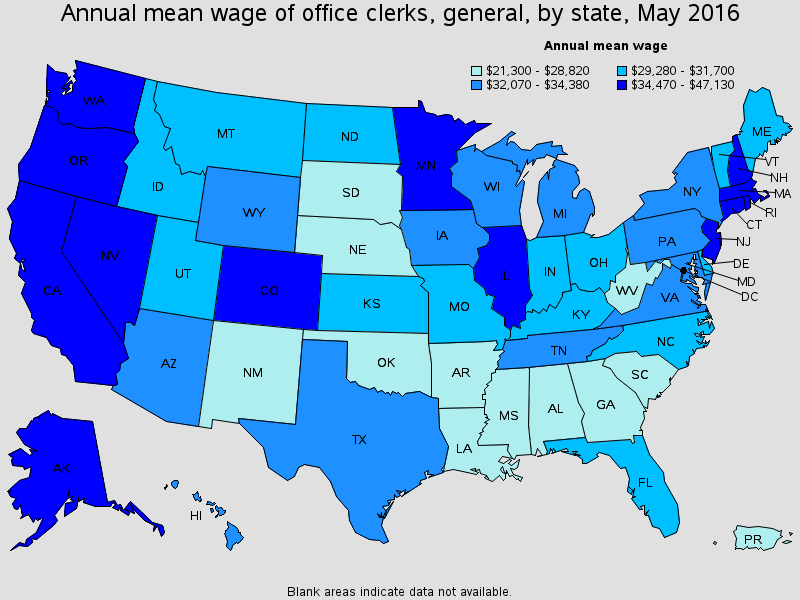
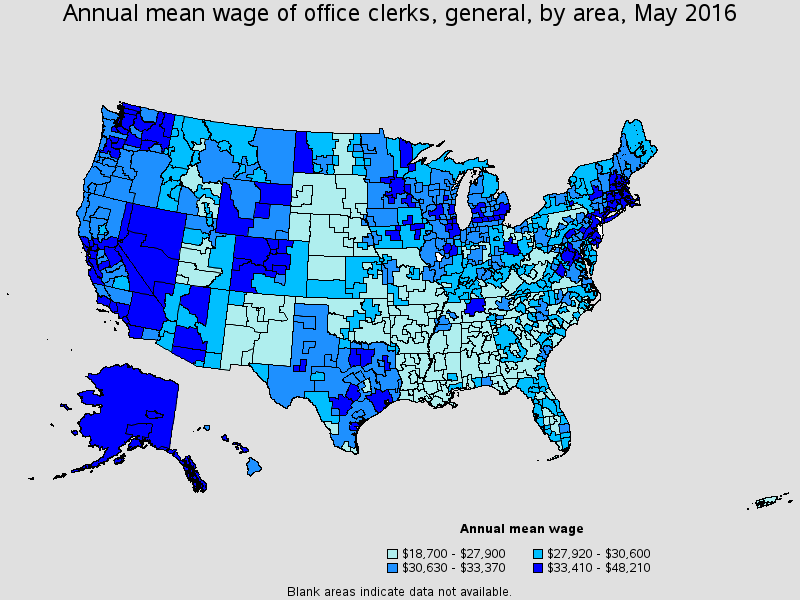
Top paying States for this occupation:
| State | Employment (1) | Employment per thousand jobs | Location quotient (9) | Hourly mean wage | Annual mean wage (2) |
|---|---|---|---|---|---|
| Alaska | 6,810 | 21.04 | 1.00 | $22.66 | $47,130 |
| District of Columbia | 10,000 | 14.23 | 0.68 | $20.08 | $41,770 |
| Colorado | 44,650 | 17.81 | 0.85 | $18.54 | $38,570 |
| Massachusetts | 63,080 | 18.23 | 0.87 | $18.24 | $37,940 |
| Connecticut | 32,340 | 19.41 | 0.92 | $18.21 | $37,870 |
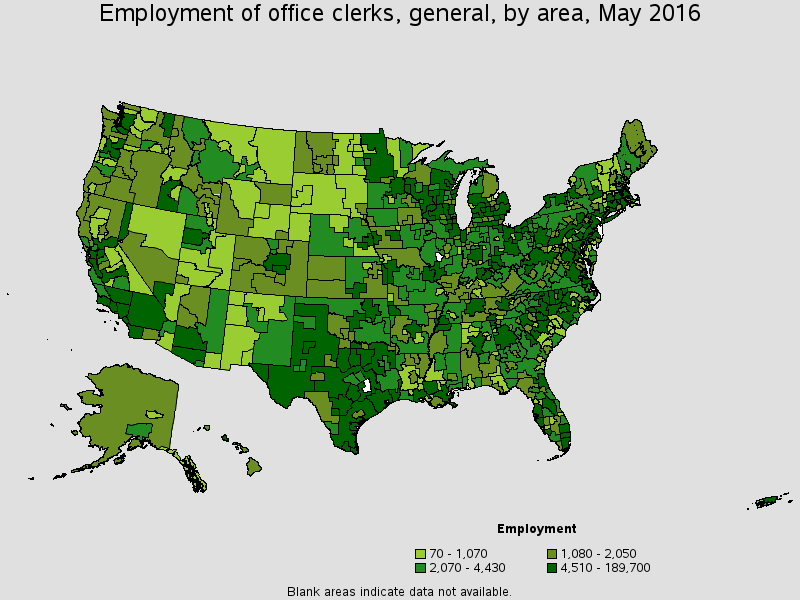
Metropolitan areas with the highest employment level in this occupation:
| Metropolitan area | Employment (1) | Employment per thousand jobs | Location quotient (9) | Hourly mean wage | Annual mean wage (2) |
|---|---|---|---|---|---|
| New York-Jersey City-White Plains, NY-NJ Metropolitan Division | 139,320 | 21.15 | 1.00 | $16.36 | $34,030 |
| Los Angeles-Long Beach-Glendale, CA Metropolitan Division | 93,630 | 22.18 | 1.05 | $16.17 | $33,640 |
| Chicago-Naperville-Arlington Heights, IL Metropolitan Division | 87,660 | 24.09 | 1.14 | $17.63 | $36,680 |
| Houston-The Woodlands-Sugar Land, TX | 86,090 | 29.33 | 1.39 | $17.85 | $37,130 |
| Dallas-Plano-Irving, TX Metropolitan Division | 73,650 | 30.31 | 1.44 | $17.02 | $35,400 |
| Washington-Arlington-Alexandria, DC-VA-MD-WV Metropolitan Division | 47,070 | 18.90 | 0.90 | $18.94 | $39,390 |
| Atlanta-Sandy Springs-Roswell, GA | 46,830 | 18.34 | 0.87 | $14.63 | $30,430 |
| Phoenix-Mesa-Scottsdale, AZ | 36,220 | 18.72 | 0.89 | $16.91 | $35,170 |
| Minneapolis-St. Paul-Bloomington, MN-WI | 35,880 | 18.78 | 0.89 | $17.51 | $36,430 |
| Austin-Round Rock, TX | 30,800 | 31.91 | 1.52 | $17.18 | $35,740 |
Metropolitan areas with the highest concentration of jobs and location quotients in this occupation:
| Metropolitan area | Employment (1) | Employment per thousand jobs | Location quotient (9) | Hourly mean wage | Annual mean wage (2) |
|---|---|---|---|---|---|
| Laredo, TX | 4,370 | 44.75 | 2.13 | $13.00 | $27,040 |
| Victoria, TX | 1,720 | 41.28 | 1.96 | $15.19 | $31,600 |
| Lubbock, TX | 5,780 | 41.22 | 1.96 | $15.70 | $32,650 |
| Charleston, WV | 4,620 | 40.59 | 1.93 | $14.37 | $29,890 |
| Ann Arbor, MI | 8,170 | 38.74 | 1.84 | $17.41 | $36,220 |
| Brownsville-Harlingen, TX | 5,110 | 37.12 | 1.76 | $12.83 | $26,690 |
| State College, PA | 2,510 | 36.76 | 1.75 | $15.19 | $31,600 |
| Midland, TX | 3,120 | 36.10 | 1.72 | $19.28 | $40,100 |
| Jefferson City, MO | 2,570 | 35.70 | 1.70 | $14.22 | $29,580 |
| El Paso, TX | 10,580 | 35.57 | 1.69 | $14.58 | $30,330 |
Top paying metropolitan areas for this occupation:
| Metropolitan area | Employment (1) | Employment per thousand jobs | Location quotient (9) | Hourly mean wage | Annual mean wage (2) |
|---|---|---|---|---|---|
| Anchorage, AK | 3,630 | 20.60 | 0.98 | $22.84 | $47,500 |
| Fairbanks, AK | 790 | 21.28 | 1.01 | $22.47 | $46,750 |
| San Rafael, CA Metropolitan Division | 1,940 | 17.36 | 0.82 | $21.30 | $44,290 |
| San Jose-Sunnyvale-Santa Clara, CA | 14,930 | 14.28 | 0.68 | $20.85 | $43,360 |
| San Francisco-Redwood City-South San Francisco, CA Metropolitan Division | 16,460 | 15.43 | 0.73 | $20.77 | $43,210 |
| Odessa, TX | 2,130 | 31.33 | 1.49 | $20.00 | $41,590 |
| Boulder, CO | 3,000 | 17.03 | 0.81 | $19.85 | $41,290 |
| Carson City, NV | 750 | 26.91 | 1.28 | $19.83 | $41,250 |
| Trenton, NJ | 3,880 | 17.16 | 0.81 | $19.62 | $40,810 |
| Boston-Cambridge-Newton, MA NECTA Division | 30,180 | 16.74 | 0.80 | $19.56 | $40,690 |
Nonmetropolitan areas with the highest employment in this occupation:
| Nonmetropolitan area | Employment (1) | Employment per thousand jobs | Location quotient (9) | Hourly mean wage | Annual mean wage (2) |
|---|---|---|---|---|---|
| North Texas nonmetropolitan area | 8,930 | 33.53 | 1.59 | $15.03 | $31,260 |
| Northeastern Wisconsin nonmetropolitan area | 6,670 | 32.95 | 1.57 | $15.40 | $32,030 |
| West Texas nonmetropolitan area | 6,620 | 34.06 | 1.62 | $14.85 | $30,890 |
| South Central Wisconsin nonmetropolitan area | 6,330 | 30.36 | 1.44 | $15.48 | $32,200 |
| Hill Country Region of Texas nonmetropolitan area | 6,260 | 32.37 | 1.54 | $15.30 | $31,810 |
Nonmetropolitan areas with the highest concentration of jobs and location quotients in this occupation:
| Nonmetropolitan area | Employment (1) | Employment per thousand jobs | Location quotient (9) | Hourly mean wage | Annual mean wage (2) |
|---|---|---|---|---|---|
| Southern West Virginia nonmetropolitan area | 3,160 | 41.82 | 1.99 | $12.08 | $25,130 |
| Northern West Virginia nonmetropolitan area | 5,250 | 36.11 | 1.72 | $13.05 | $27,140 |
| West Texas nonmetropolitan area | 6,620 | 34.06 | 1.62 | $14.85 | $30,890 |
| North Texas nonmetropolitan area | 8,930 | 33.53 | 1.59 | $15.03 | $31,260 |
| Western Wisconsin nonmetropolitan area | 4,670 | 33.39 | 1.59 | $14.83 | $30,850 |
Top paying nonmetropolitan areas for this occupation:
| Nonmetropolitan area | Employment (1) | Employment per thousand jobs | Location quotient (9) | Hourly mean wage | Annual mean wage (2) |
|---|---|---|---|---|---|
| Balance of Alaska nonmetropolitan area | 1,530 | 20.78 | 0.99 | $23.18 | $48,210 |
| Southeast Alaska nonmetropolitan area | 820 | 23.35 | 1.11 | $20.71 | $43,080 |
| Northwest Colorado nonmetropolitan area | 1,960 | 17.05 | 0.81 | $20.70 | $43,050 |
| Nantucket Island and Martha's Vineyard nonmetropolitan area | 480 | 27.57 | 1.31 | $20.38 | $42,390 |
| Eastern Sierra Region of California nonmetropolitan area | 190 | 14.33 | 0.68 | $19.60 | $40,770 |
These estimates are calculated with data collected from employers in all industry sectors, all metropolitan and nonmetropolitan areas, and all states and the District of Columbia. The top employment and wage figures are provided above. The complete list is available in the downloadable XLS files.
The percentile wage estimate is the value of a wage below which a certain percent of workers fall. The median wage is the 50th percentile wage estimate--50 percent of workers earn less than the median and 50 percent of workers earn more than the median. More about percentile wages.
(1) Estimates for detailed occupations do not sum to the totals because the totals include occupations not shown separately. Estimates do not include self-employed workers.
(2) Annual wages have been calculated by multiplying the hourly mean wage by a "year-round, full-time" hours figure of 2,080 hours; for those occupations where there is not an hourly wage published, the annual wage has been directly calculated from the reported survey data.
(3) The relative standard error (RSE) is a measure of the reliability of a survey statistic. The smaller the relative standard error, the more precise the estimate.
(9) The location quotient is the ratio of the area concentration of occupational employment to the national average concentration. A location quotient greater than one indicates the occupation has a higher share of employment than average, and a location quotient less than one indicates the occupation is less prevalent in the area than average.
Other OES estimates and related information:
May 2016 National Occupational Employment and Wage Estimates
May 2016 State Occupational Employment and Wage Estimates
May 2016 Metropolitan and Nonmetropolitan Area Occupational Employment and Wage Estimates
May 2016 National Industry-Specific Occupational Employment and Wage Estimates
Last Modified Date: March 31, 2017