
An official website of the United States government
An official website of the United States government
The .gov means it's official.
Federal government websites often end in .gov or .mil. Before sharing sensitive information,
make sure you're on a federal government site.
The site is secure.
The
https:// ensures that you are connecting to the official website and that any
information you provide is encrypted and transmitted securely.
Fabricate, assemble, install, and repair sheet metal products and equipment, such as ducts, control boxes, drainpipes, and furnace casings. Work may involve any of the following: setting up and operating fabricating machines to cut, bend, and straighten sheet metal; shaping metal over anvils, blocks, or forms using hammer; operating soldering and welding equipment to join sheet metal parts; or inspecting, assembling, and smoothing seams and joints of burred surfaces. Includes sheet metal duct installers who install prefabricated sheet metal ducts used for heating, air conditioning, or other purposes.
Employment estimate and mean wage estimates for this occupation:
| Employment (1) | Employment RSE (3) |
Mean hourly wage |
Mean annual wage (2) |
Wage RSE (3) |
|---|---|---|---|---|
| 134,450 | 2.1 % | $24.56 | $51,080 | 0.9 % |
Percentile wage estimates for this occupation:
| Percentile | 10% | 25% | 50% (Median) |
75% | 90% |
|---|---|---|---|---|---|
| Hourly Wage | $12.81 | $16.50 | $22.57 | $30.20 | $41.03 |
| Annual Wage (2) | $26,640 | $34,320 | $46,940 | $62,820 | $85,340 |
Industries with the highest published employment and wages for this occupation are provided. For a list of all industries with employment in this occupation, see the Create Customized Tables function.
Industries with the highest levels of employment in this occupation:
| Industry | Employment (1) | Percent of industry employment | Hourly mean wage | Annual mean wage (2) |
|---|---|---|---|---|
| Building Equipment Contractors | 66,110 | 3.32 | $26.46 | $55,030 |
| Architectural and Structural Metals Manufacturing | 18,930 | 5.11 | $21.50 | $44,730 |
| Foundation, Structure, and Building Exterior Contractors | 15,710 | 1.86 | $22.61 | $47,030 |
| Federal Executive Branch (OES Designation) | 6,540 | 0.32 | $26.51 | $55,150 |
| Employment Services | 3,170 | 0.09 | $19.14 | $39,810 |
Industries with the highest concentration of employment in this occupation:
| Industry | Employment (1) | Percent of industry employment | Hourly mean wage | Annual mean wage (2) |
|---|---|---|---|---|
| Architectural and Structural Metals Manufacturing | 18,930 | 5.11 | $21.50 | $44,730 |
| Building Equipment Contractors | 66,110 | 3.32 | $26.46 | $55,030 |
| Ventilation, Heating, Air-Conditioning, and Commercial Refrigeration Equipment Manufacturing | 2,560 | 1.99 | $19.42 | $40,390 |
| Foundation, Structure, and Building Exterior Contractors | 15,710 | 1.86 | $22.61 | $47,030 |
| Ship and Boat Building | 1,850 | 1.36 | $24.22 | $50,370 |
Top paying industries for this occupation:
| Industry | Employment (1) | Percent of industry employment | Hourly mean wage | Annual mean wage (2) |
|---|---|---|---|---|
| Professional and Commercial Equipment and Supplies Merchant Wholesalers | (8) | (8) | $41.13 | $85,550 |
| Local Government (OES Designation) | 390 | 0.01 | $35.57 | $73,990 |
| State Government (OES Designation) | 110 | (7) | $34.71 | $72,190 |
| General Medical and Surgical Hospitals | 70 | (7) | $34.50 | $71,770 |
| Management of Companies and Enterprises | (8) | (8) | $30.01 | $62,430 |
States and areas with the highest published employment, location quotients, and wages for this occupation are provided. For a list of all areas with employment in this occupation, see the Create Customized Tables function.

States with the highest employment level in this occupation:
| State | Employment (1) | Employment per thousand jobs | Location quotient (9) | Hourly mean wage | Annual mean wage (2) |
|---|---|---|---|---|---|
| California | 13,050 | 0.82 | 0.85 | $28.37 | $59,000 |
| Texas | 11,090 | 0.94 | 0.99 | $19.27 | $40,080 |
| New York | 8,130 | 0.89 | 0.93 | $31.20 | $64,900 |
| Florida | 7,460 | 0.91 | 0.95 | $18.48 | $38,440 |
| Georgia | 4,400 | 1.04 | 1.09 | $20.96 | $43,590 |
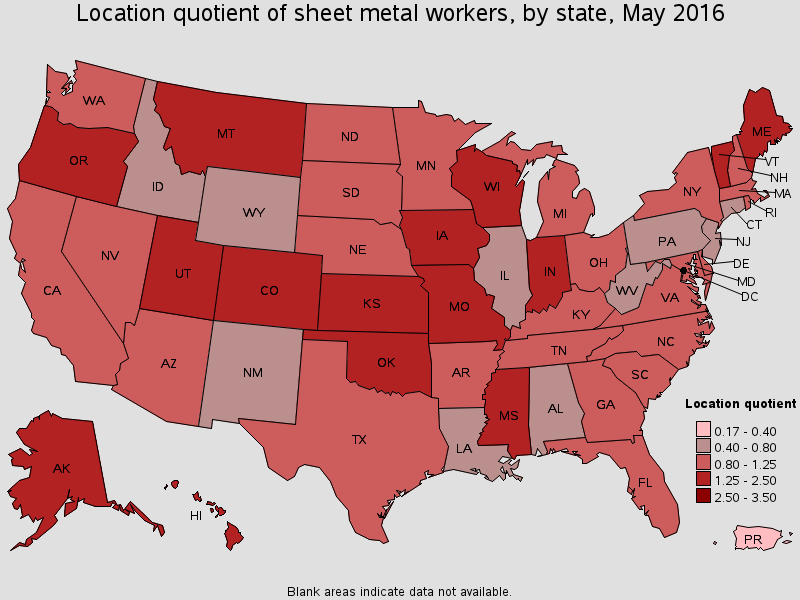
States with the highest concentration of jobs and location quotients in this occupation:
| State | Employment (1) | Employment per thousand jobs | Location quotient (9) | Hourly mean wage | Annual mean wage (2) |
|---|---|---|---|---|---|
| Oklahoma | 3,360 | 2.12 | 2.21 | $23.02 | $47,890 |
| Mississippi | 1,810 | 1.62 | 1.69 | $18.03 | $37,510 |
| Kansas | 2,170 | 1.58 | 1.65 | $24.30 | $50,540 |
| Hawaii | 970 | 1.53 | 1.60 | $32.24 | $67,050 |
| Utah | 2,060 | 1.50 | 1.57 | $22.36 | $46,510 |
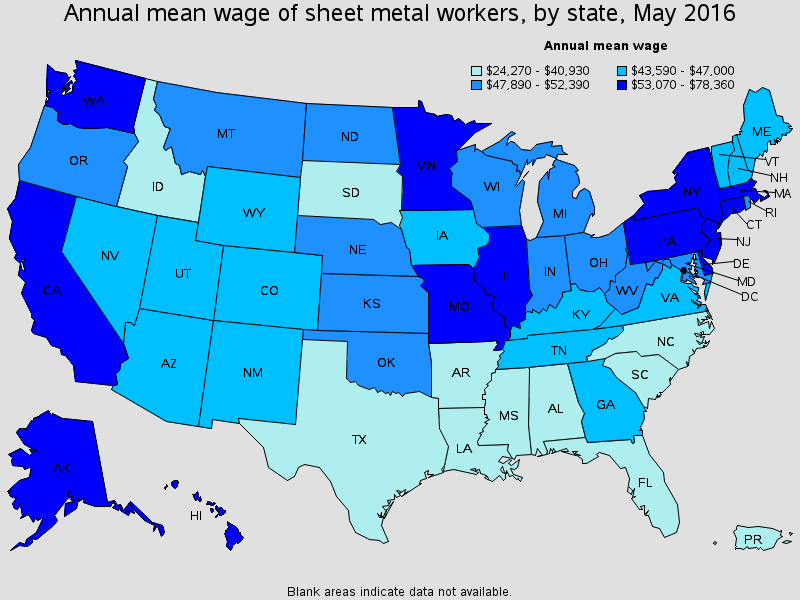
Top paying States for this occupation:
| State | Employment (1) | Employment per thousand jobs | Location quotient (9) | Hourly mean wage | Annual mean wage (2) |
|---|---|---|---|---|---|
| Alaska | 450 | 1.40 | 1.46 | $37.68 | $78,360 |
| Illinois | 4,120 | 0.70 | 0.73 | $36.01 | $74,890 |
| Hawaii | 970 | 1.53 | 1.60 | $32.24 | $67,050 |
| Minnesota | 2,860 | 1.02 | 1.06 | $31.32 | $65,140 |
| New York | 8,130 | 0.89 | 0.93 | $31.20 | $64,900 |
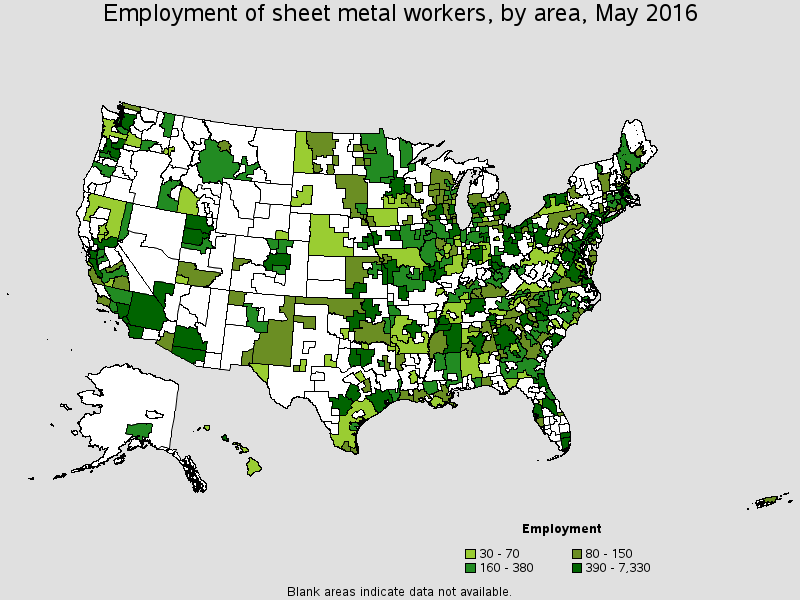
Metropolitan areas with the highest employment level in this occupation:
| Metropolitan area | Employment (1) | Employment per thousand jobs | Location quotient (9) | Hourly mean wage | Annual mean wage (2) |
|---|---|---|---|---|---|
| New York-Jersey City-White Plains, NY-NJ Metropolitan Division | 4,510 | 0.68 | 0.71 | $33.15 | $68,950 |
| Houston-The Woodlands-Sugar Land, TX | 3,210 | 1.09 | 1.14 | $22.03 | $45,810 |
| Dallas-Plano-Irving, TX Metropolitan Division | 2,640 | 1.09 | 1.13 | $15.38 | $31,990 |
| Chicago-Naperville-Arlington Heights, IL Metropolitan Division | 2,580 | 0.71 | 0.74 | $38.72 | $80,530 |
| Oklahoma City, OK | 2,490 | 4.10 | 4.28 | $23.72 | $49,330 |
| Boston-Cambridge-Newton, MA NECTA Division | 2,310 | 1.28 | 1.34 | $35.50 | $73,840 |
| San Diego-Carlsbad, CA | 2,220 | 1.60 | 1.67 | $26.76 | $55,660 |
| Phoenix-Mesa-Scottsdale, AZ | 2,140 | 1.11 | 1.15 | $21.65 | $45,030 |
| Indianapolis-Carmel-Anderson, IN | 2,140 | 2.10 | 2.20 | $22.50 | $46,800 |
| St. Louis, MO-IL | 2,120 | 1.58 | 1.65 | $31.08 | $64,650 |

Metropolitan areas with the highest concentration of jobs and location quotients in this occupation:
| Metropolitan area | Employment (1) | Employment per thousand jobs | Location quotient (9) | Hourly mean wage | Annual mean wage (2) |
|---|---|---|---|---|---|
| Warner Robins, GA | 1,210 | 17.57 | 18.35 | $26.01 | $54,110 |
| Oklahoma City, OK | 2,490 | 4.10 | 4.28 | $23.72 | $49,330 |
| Ogden-Clearfield, UT | 820 | 3.39 | 3.54 | $23.09 | $48,020 |
| St. Cloud, MN | 330 | 3.20 | 3.34 | $21.84 | $45,420 |
| Greeley, CO | 310 | 3.18 | 3.32 | $21.21 | $44,120 |
| Harrisonburg, VA | 190 | 3.11 | 3.25 | $20.34 | $42,300 |
| Muskegon, MI | 190 | 3.06 | 3.20 | $24.37 | $50,680 |
| Bremerton-Silverdale, WA | 240 | 2.90 | 3.03 | $27.77 | $57,760 |
| Jacksonville, NC | 130 | 2.79 | 2.91 | $20.74 | $43,140 |
| Appleton, WI | 340 | 2.73 | 2.85 | $27.86 | $57,950 |
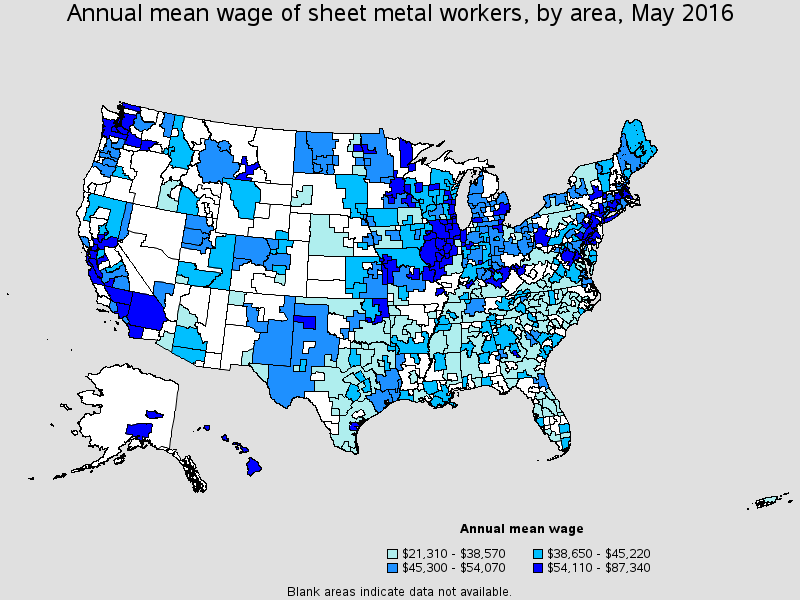
Top paying metropolitan areas for this occupation:
| Metropolitan area | Employment (1) | Employment per thousand jobs | Location quotient (9) | Hourly mean wage | Annual mean wage (2) |
|---|---|---|---|---|---|
| Olympia-Tumwater, WA | (8) | (8) | (8) | $41.99 | $87,340 |
| Santa Cruz-Watsonville, CA | 40 | 0.47 | 0.49 | $40.43 | $84,100 |
| Anchorage, AK | 270 | 1.55 | 1.62 | $39.62 | $82,420 |
| Lake County-Kenosha County, IL-WI Metropolitan Division | 130 | 0.32 | 0.33 | $38.80 | $80,710 |
| Chicago-Naperville-Arlington Heights, IL Metropolitan Division | 2,580 | 0.71 | 0.74 | $38.72 | $80,530 |
| Kennewick-Richland, WA | 170 | 1.61 | 1.68 | $38.41 | $79,900 |
| Elgin, IL Metropolitan Division | (8) | (8) | (8) | $38.03 | $79,110 |
| Bellingham, WA | 100 | 1.18 | 1.23 | $37.91 | $78,850 |
| Cape Girardeau, MO-IL | 50 | 1.16 | 1.22 | $37.19 | $77,350 |
| Vineland-Bridgeton, NJ | 100 | 1.60 | 1.67 | $36.00 | $74,880 |
Nonmetropolitan areas with the highest employment in this occupation:
| Nonmetropolitan area | Employment (1) | Employment per thousand jobs | Location quotient (9) | Hourly mean wage | Annual mean wage (2) |
|---|---|---|---|---|---|
| Northeast Mississippi nonmetropolitan area | 450 | 1.97 | 2.06 | $14.81 | $30,810 |
| North Northeastern Ohio non-metropolitan area (non-contiguous) | 430 | 1.31 | 1.36 | $16.83 | $35,010 |
| Northern Indiana nonmetropolitan area | 370 | 1.71 | 1.78 | $24.40 | $50,740 |
| Southwest Maine nonmetropolitan area | 340 | 1.77 | 1.84 | $24.58 | $51,130 |
| Southeast Iowa nonmetropolitan area | 340 | 1.47 | 1.53 | $18.84 | $39,180 |
Nonmetropolitan areas with the highest concentration of jobs and location quotients in this occupation:
| Nonmetropolitan area | Employment (1) | Employment per thousand jobs | Location quotient (9) | Hourly mean wage | Annual mean wage (2) |
|---|---|---|---|---|---|
| Southwest Utah nonmetropolitan area | 90 | 3.98 | 4.16 | $18.65 | $38,800 |
| Southeast Mississippi nonmetropolitan area | 300 | 1.99 | 2.08 | $15.33 | $31,880 |
| Northeast Mississippi nonmetropolitan area | 450 | 1.97 | 2.06 | $14.81 | $30,810 |
| Central Missouri nonmetropolitan area | 290 | 1.84 | 1.92 | $24.51 | $50,970 |
| Southwest Montana nonmetropolitan area | 240 | 1.83 | 1.91 | $21.89 | $45,520 |
Top paying nonmetropolitan areas for this occupation:
| Nonmetropolitan area | Employment (1) | Employment per thousand jobs | Location quotient (9) | Hourly mean wage | Annual mean wage (2) |
|---|---|---|---|---|---|
| Southwest Washington nonmetropolitan area | 30 | 0.54 | 0.56 | $36.13 | $75,150 |
| Hawaii / Kauai nonmetropolitan area | 60 | 0.65 | 0.68 | $32.11 | $66,780 |
| Northwest Illinois nonmetropolitan area | 230 | 1.67 | 1.75 | $30.69 | $63,830 |
| West Central Illinois nonmetropolitan area | 200 | 1.15 | 1.20 | $30.19 | $62,800 |
| Central Kentucky nonmetropolitan area | 190 | 1.02 | 1.07 | $27.21 | $56,600 |
These estimates are calculated with data collected from employers in all industry sectors, all metropolitan and nonmetropolitan areas, and all states and the District of Columbia. The top employment and wage figures are provided above. The complete list is available in the downloadable XLS files.
The percentile wage estimate is the value of a wage below which a certain percent of workers fall. The median wage is the 50th percentile wage estimate--50 percent of workers earn less than the median and 50 percent of workers earn more than the median. More about percentile wages.
(1) Estimates for detailed occupations do not sum to the totals because the totals include occupations not shown separately. Estimates do not include self-employed workers.
(2) Annual wages have been calculated by multiplying the hourly mean wage by a "year-round, full-time" hours figure of 2,080 hours; for those occupations where there is not an hourly wage published, the annual wage has been directly calculated from the reported survey data.
(3) The relative standard error (RSE) is a measure of the reliability of a survey statistic. The smaller the relative standard error, the more precise the estimate.
(7) The value is less than .005 percent of industry employment.
(8) Estimate not released.
(9) The location quotient is the ratio of the area concentration of occupational employment to the national average concentration. A location quotient greater than one indicates the occupation has a higher share of employment than average, and a location quotient less than one indicates the occupation is less prevalent in the area than average.
Other OES estimates and related information:
May 2016 National Occupational Employment and Wage Estimates
May 2016 State Occupational Employment and Wage Estimates
May 2016 Metropolitan and Nonmetropolitan Area Occupational Employment and Wage Estimates
May 2016 National Industry-Specific Occupational Employment and Wage Estimates
Last Modified Date: March 31, 2017