
An official website of the United States government
An official website of the United States government
The .gov means it's official.
Federal government websites often end in .gov or .mil. Before sharing sensitive information,
make sure you're on a federal government site.
The site is secure.
The
https:// ensures that you are connecting to the official website and that any
information you provide is encrypted and transmitted securely.
Set up, operate, or tend welding, soldering, or brazing machines or robots that weld, braze, solder, or heat treat metal products, components, or assemblies. Includes workers who operate laser cutters or laser-beam machines.
Employment estimate and mean wage estimates for this occupation:
| Employment (1) | Employment RSE (3) |
Mean hourly wage |
Mean annual wage (2) |
Wage RSE (3) |
|---|---|---|---|---|
| 46,920 | 5.2 % | $18.45 | $38,380 | 1.0 % |
Percentile wage estimates for this occupation:
| Percentile | 10% | 25% | 50% (Median) |
75% | 90% |
|---|---|---|---|---|---|
| Hourly Wage | $12.05 | $14.47 | $17.78 | $22.03 | $26.10 |
| Annual Wage (2) | $25,070 | $30,090 | $36,980 | $45,820 | $54,300 |
Industries with the highest published employment and wages for this occupation are provided. For a list of all industries with employment in this occupation, see the Create Customized Tables function.
Industries with the highest levels of employment in this occupation:
| Industry | Employment (1) | Percent of industry employment | Hourly mean wage | Annual mean wage (2) |
|---|---|---|---|---|
| Motor Vehicle Parts Manufacturing | 7,030 | 1.21 | $16.94 | $35,230 |
| Architectural and Structural Metals Manufacturing | 4,690 | 1.26 | $19.25 | $40,040 |
| Agriculture, Construction, and Mining Machinery Manufacturing | 3,780 | 1.76 | $20.21 | $42,040 |
| Ship and Boat Building | 2,030 | 1.49 | $22.46 | $46,720 |
| Boiler, Tank, and Shipping Container Manufacturing | 1,790 | 1.92 | $20.69 | $43,040 |
Industries with the highest concentration of employment in this occupation:
| Industry | Employment (1) | Percent of industry employment | Hourly mean wage | Annual mean wage (2) |
|---|---|---|---|---|
| Boiler, Tank, and Shipping Container Manufacturing | 1,790 | 1.92 | $20.69 | $43,040 |
| Spring and Wire Product Manufacturing | 820 | 1.91 | $17.26 | $35,910 |
| Agriculture, Construction, and Mining Machinery Manufacturing | 3,780 | 1.76 | $20.21 | $42,040 |
| Ship and Boat Building | 2,030 | 1.49 | $22.46 | $46,720 |
| Ventilation, Heating, Air-Conditioning, and Commercial Refrigeration Equipment Manufacturing | 1,760 | 1.37 | $16.84 | $35,030 |
Top paying industries for this occupation:
| Industry | Employment (1) | Percent of industry employment | Hourly mean wage | Annual mean wage (2) |
|---|---|---|---|---|
| Electric Power Generation, Transmission and Distribution | 30 | 0.01 | $37.55 | $78,110 |
| Ship and Boat Building | 2,030 | 1.49 | $22.46 | $46,720 |
| Aerospace Product and Parts Manufacturing | 770 | 0.16 | $22.10 | $45,980 |
| Scientific Research and Development Services | 30 | 0.01 | $21.95 | $45,650 |
| Building Equipment Contractors | (8) | (8) | $21.77 | $45,280 |
States and areas with the highest published employment, location quotients, and wages for this occupation are provided. For a list of all areas with employment in this occupation, see the Create Customized Tables function.
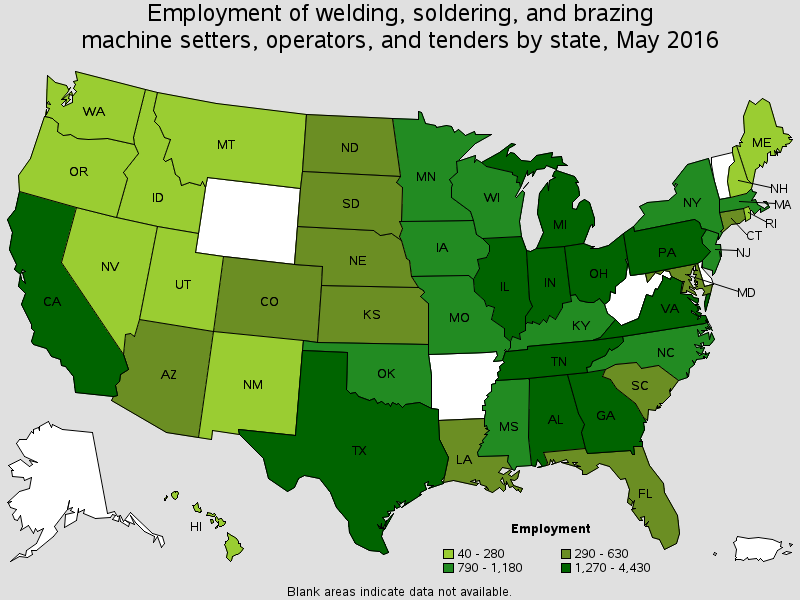
States with the highest employment level in this occupation:
| State | Employment (1) | Employment per thousand jobs | Location quotient (9) | Hourly mean wage | Annual mean wage (2) |
|---|---|---|---|---|---|
| Pennsylvania | 4,430 | 0.77 | 2.30 | $17.25 | $35,890 |
| Tennessee | 3,260 | 1.13 | 3.37 | $18.63 | $38,760 |
| Michigan | 3,120 | 0.74 | 2.21 | $18.07 | $37,580 |
| California | 3,100 | 0.19 | 0.58 | $19.59 | $40,760 |
| Ohio | 3,020 | 0.56 | 1.69 | $19.53 | $40,620 |
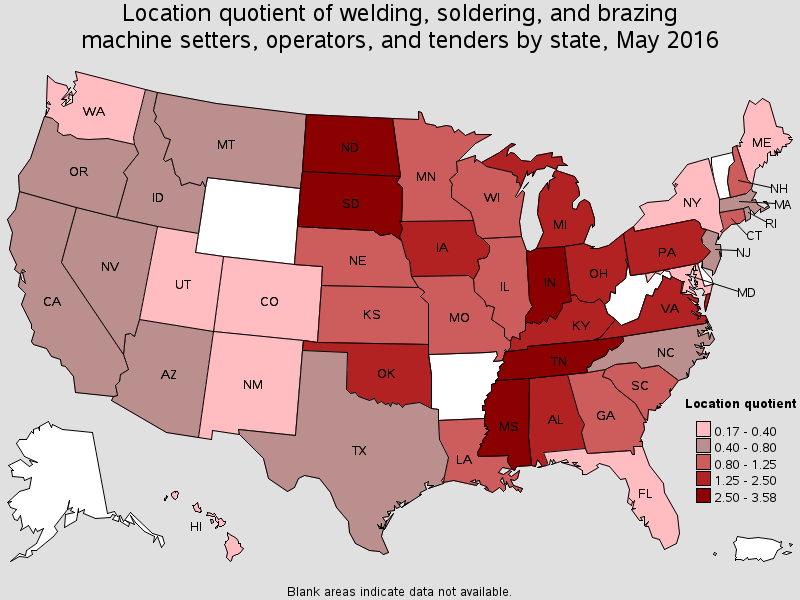
States with the highest concentration of jobs and location quotients in this occupation:
| State | Employment (1) | Employment per thousand jobs | Location quotient (9) | Hourly mean wage | Annual mean wage (2) |
|---|---|---|---|---|---|
| North Dakota | 510 | 1.20 | 3.58 | $22.01 | $45,780 |
| Tennessee | 3,260 | 1.13 | 3.37 | $18.63 | $38,760 |
| South Dakota | 390 | 0.94 | 2.81 | $19.54 | $40,640 |
| Mississippi | 1,040 | 0.94 | 2.80 | $18.10 | $37,640 |
| Indiana | 2,650 | 0.89 | 2.65 | $15.75 | $32,750 |

Top paying States for this occupation:
| State | Employment (1) | Employment per thousand jobs | Location quotient (9) | Hourly mean wage | Annual mean wage (2) |
|---|---|---|---|---|---|
| Hawaii | 50 | 0.09 | 0.26 | $26.00 | $54,080 |
| Washington | 200 | 0.07 | 0.20 | $22.74 | $47,310 |
| North Dakota | 510 | 1.20 | 3.58 | $22.01 | $45,780 |
| Massachusetts | 920 | 0.27 | 0.79 | $21.52 | $44,750 |
| Virginia | 1,730 | 0.46 | 1.37 | $21.09 | $43,880 |
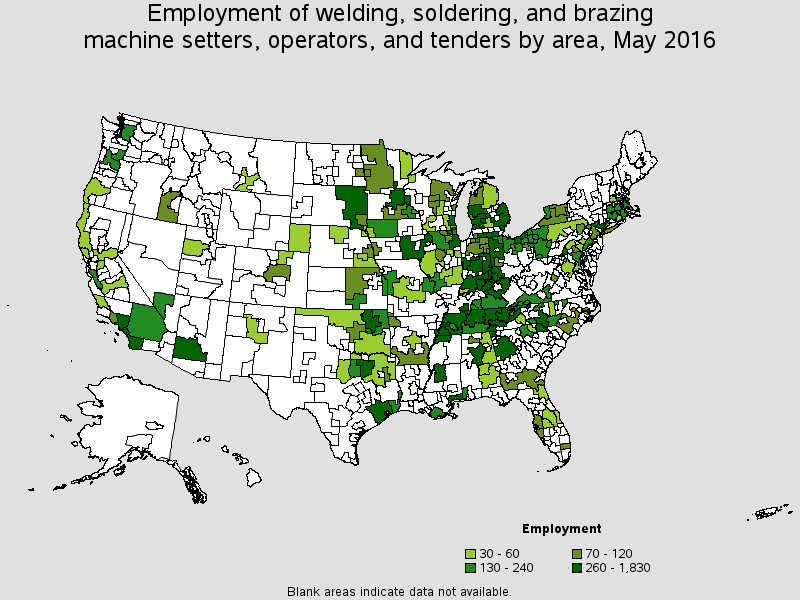
Metropolitan areas with the highest employment level in this occupation:
| Metropolitan area | Employment (1) | Employment per thousand jobs | Location quotient (9) | Hourly mean wage | Annual mean wage (2) |
|---|---|---|---|---|---|
| Houston-The Woodlands-Sugar Land, TX | 1,160 | 0.39 | 1.18 | $20.89 | $43,440 |
| Warren-Troy-Farmington Hills, MI Metropolitan Division | 1,150 | 0.96 | 2.86 | $16.83 | $35,000 |
| Los Angeles-Long Beach-Glendale, CA Metropolitan Division | 980 | 0.23 | 0.70 | $19.55 | $40,670 |
| Detroit-Dearborn-Livonia, MI Metropolitan Division | 680 | 0.94 | 2.82 | $23.81 | $49,530 |
| Grand Rapids-Wyoming, MI | 630 | 1.14 | 3.42 | $17.81 | $37,040 |
| Indianapolis-Carmel-Anderson, IN | 610 | 0.60 | 1.80 | $15.57 | $32,380 |
| Chicago-Naperville-Arlington Heights, IL Metropolitan Division | 550 | 0.15 | 0.46 | $17.68 | $36,780 |
| Anaheim-Santa Ana-Irvine, CA Metropolitan Division | 540 | 0.35 | 1.04 | $17.37 | $36,120 |
| Phoenix-Mesa-Scottsdale, AZ | 540 | 0.28 | 0.83 | $18.11 | $37,680 |
| Louisville/Jefferson County, KY-IN | 500 | 0.78 | 2.34 | $15.41 | $32,040 |

Metropolitan areas with the highest concentration of jobs and location quotients in this occupation:
| Metropolitan area | Employment (1) | Employment per thousand jobs | Location quotient (9) | Hourly mean wage | Annual mean wage (2) |
|---|---|---|---|---|---|
| Chambersburg-Waynesboro, PA | 310 | 5.41 | 16.19 | (8) | (8) |
| Clarksville, TN-KY | 410 | 4.85 | 14.52 | $19.99 | $41,570 |
| Morristown, TN | 120 | 2.84 | 8.50 | $18.67 | $38,840 |
| Gulfport-Biloxi-Pascagoula, MS | 390 | 2.64 | 7.89 | $21.81 | $45,370 |
| Bowling Green, KY | 170 | 2.42 | 7.23 | $17.86 | $37,150 |
| Houma-Thibodaux, LA | 210 | 2.33 | 6.96 | $16.69 | $34,720 |
| Jackson, TN | 140 | 2.15 | 6.42 | $17.97 | $37,390 |
| Staunton-Waynesboro, VA | 90 | 1.90 | 5.68 | $17.08 | $35,530 |
| Kingsport-Bristol-Bristol, TN-VA | 200 | 1.72 | 5.14 | $17.61 | $36,640 |
| Chattanooga, TN-GA | 370 | 1.56 | 4.66 | $21.85 | $45,450 |
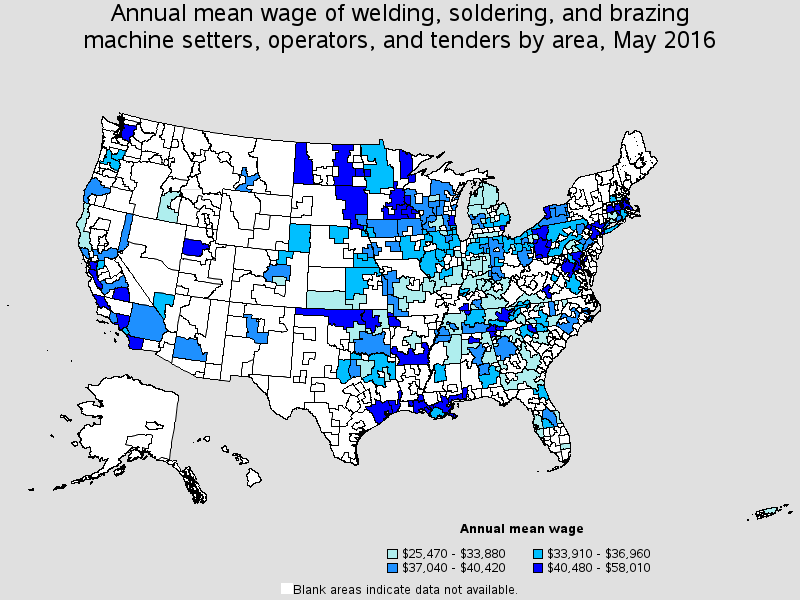
Top paying metropolitan areas for this occupation:
| Metropolitan area | Employment (1) | Employment per thousand jobs | Location quotient (9) | Hourly mean wage | Annual mean wage (2) |
|---|---|---|---|---|---|
| Brockton-Bridgewater-Easton, MA NECTA Division | (8) | (8) | (8) | $27.89 | $58,010 |
| Milwaukee-Waukesha-West Allis, WI | 430 | 0.51 | 1.52 | $25.67 | $53,390 |
| Seattle-Bellevue-Everett, WA Metropolitan Division | 140 | 0.09 | 0.26 | $23.99 | $49,910 |
| Detroit-Dearborn-Livonia, MI Metropolitan Division | 680 | 0.94 | 2.82 | $23.81 | $49,530 |
| Buffalo-Cheektowaga-Niagara Falls, NY | 130 | 0.23 | 0.69 | $23.48 | $48,840 |
| Newark, NJ-PA Metropolitan Division | 100 | 0.09 | 0.26 | $23.27 | $48,400 |
| San Luis Obispo-Paso Robles-Arroyo Grande, CA | 60 | 0.50 | 1.51 | $23.04 | $47,920 |
| San Diego-Carlsbad, CA | 370 | 0.27 | 0.80 | $22.87 | $47,580 |
| Beaumont-Port Arthur, TX | 200 | 1.25 | 3.74 | $22.46 | $46,730 |
| Pittsburgh, PA | 170 | 0.15 | 0.46 | $22.28 | $46,350 |
Nonmetropolitan areas with the highest employment in this occupation:
| Nonmetropolitan area | Employment (1) | Employment per thousand jobs | Location quotient (9) | Hourly mean wage | Annual mean wage (2) |
|---|---|---|---|---|---|
| West Northwestern Ohio nonmetropolitan area | 630 | 2.51 | 7.51 | $19.38 | $40,310 |
| Southern Indiana nonmetropolitan area | 510 | 2.75 | 8.23 | $14.75 | $30,670 |
| Central Indiana nonmetropolitan area | 460 | 2.87 | 8.60 | $14.56 | $30,280 |
| Central Kentucky nonmetropolitan area | 340 | 1.89 | 5.65 | $16.15 | $33,580 |
| East Tennessee nonmetropolitan area | 340 | 2.56 | 7.66 | $17.34 | $36,070 |
Nonmetropolitan areas with the highest concentration of jobs and location quotients in this occupation:
| Nonmetropolitan area | Employment (1) | Employment per thousand jobs | Location quotient (9) | Hourly mean wage | Annual mean wage (2) |
|---|---|---|---|---|---|
| North Central Tennessee nonmetropolitan area | 320 | 2.99 | 8.93 | $14.78 | $30,730 |
| Central Indiana nonmetropolitan area | 460 | 2.87 | 8.60 | $14.56 | $30,280 |
| Southern Indiana nonmetropolitan area | 510 | 2.75 | 8.23 | $14.75 | $30,670 |
| East Tennessee nonmetropolitan area | 340 | 2.56 | 7.66 | $17.34 | $36,070 |
| West Northwestern Ohio nonmetropolitan area | 630 | 2.51 | 7.51 | $19.38 | $40,310 |
Top paying nonmetropolitan areas for this occupation:
| Nonmetropolitan area | Employment (1) | Employment per thousand jobs | Location quotient (9) | Hourly mean wage | Annual mean wage (2) |
|---|---|---|---|---|---|
| Far West North Dakota nonmetropolitan area | (8) | (8) | (8) | $23.94 | $49,780 |
| Western Pennsylvania nonmetropolitan area | 140 | 0.89 | 2.66 | $22.93 | $47,700 |
| East Central North Dakota nonmetropolitan area | (8) | (8) | (8) | $22.89 | $47,620 |
| Southwest Louisiana nonmetropolitan area | (8) | (8) | (8) | $21.82 | $45,380 |
| South Arkansas nonmetropolitan area | 80 | 0.84 | 2.52 | $21.71 | $45,150 |
These estimates are calculated with data collected from employers in all industry sectors, all metropolitan and nonmetropolitan areas, and all states and the District of Columbia. The top employment and wage figures are provided above. The complete list is available in the downloadable XLS files.
The percentile wage estimate is the value of a wage below which a certain percent of workers fall. The median wage is the 50th percentile wage estimate--50 percent of workers earn less than the median and 50 percent of workers earn more than the median. More about percentile wages.
(1) Estimates for detailed occupations do not sum to the totals because the totals include occupations not shown separately. Estimates do not include self-employed workers.
(2) Annual wages have been calculated by multiplying the hourly mean wage by a "year-round, full-time" hours figure of 2,080 hours; for those occupations where there is not an hourly wage published, the annual wage has been directly calculated from the reported survey data.
(3) The relative standard error (RSE) is a measure of the reliability of a survey statistic. The smaller the relative standard error, the more precise the estimate.
(8) Estimate not released.
(9) The location quotient is the ratio of the area concentration of occupational employment to the national average concentration. A location quotient greater than one indicates the occupation has a higher share of employment than average, and a location quotient less than one indicates the occupation is less prevalent in the area than average.
Other OES estimates and related information:
May 2016 National Occupational Employment and Wage Estimates
May 2016 State Occupational Employment and Wage Estimates
May 2016 Metropolitan and Nonmetropolitan Area Occupational Employment and Wage Estimates
May 2016 National Industry-Specific Occupational Employment and Wage Estimates
Last Modified Date: March 31, 2017