
An official website of the United States government
An official website of the United States government
The .gov means it's official.
Federal government websites often end in .gov or .mil. Before sharing sensitive information,
make sure you're on a federal government site.
The site is secure.
The
https:// ensures that you are connecting to the official website and that any
information you provide is encrypted and transmitted securely.
This major group comprises the following occupations: First-Line Supervisors of Gaming Workers ; First-Line Supervisors of Personal Service Workers ; Animal Trainers ; Nonfarm Animal Caretakers ; Gaming Dealers ; Gaming and Sports Book Writers and Runners ; Gaming Service Workers, All Other ; Motion Picture Projectionists ; Ushers, Lobby Attendants, and Ticket Takers ; Amusement and Recreation Attendants ; Costume Attendants ; Locker Room, Coatroom, and Dressing Room Attendants ; Entertainment Attendants and Related Workers, All Other ; Embalmers ; Funeral Attendants ; Morticians, Undertakers, and Funeral Directors ; Barbers ; Hairdressers, Hairstylists, and Cosmetologists ; Makeup Artists, Theatrical and Performance ; Manicurists and Pedicurists ; Shampooers ; Skincare Specialists ; Baggage Porters and Bellhops ; Concierges ; Tour and Travel Guides ; Childcare Workers ; Personal Care Aides ; Fitness Trainers and Aerobics Instructors ; Recreation Workers ; Residential Advisors ; Personal Care and Service Workers, All Other
Employment estimate and mean wage estimates for this major group:
| Employment (1) | Employment RSE (3) |
Mean hourly wage |
Mean annual wage (2) |
Wage RSE (3) |
|---|---|---|---|---|
| 5,159,100 | 0.5 % | $13.11 | $27,270 | 0.2 % |
Percentile wage estimates for this major group:
| Percentile | 10% | 25% | 50% (Median) |
75% | 90% |
|---|---|---|---|---|---|
| Hourly Wage | $8.70 | $9.74 | $11.35 | $14.27 | $19.79 |
| Annual Wage (2) | $18,100 | $20,270 | $23,610 | $29,680 | $41,150 |
Industries with the highest published employment and wages for this occupation are provided. For a list of all industries with employment in this occupation, see the Create Customized Tables function.
Industries with the highest levels of employment in this occupation:
| Industry | Employment (1) | Percent of industry employment | Hourly mean wage | Annual mean wage (2) |
|---|---|---|---|---|
| Individual and Family Services | 1,232,270 | 53.48 | $12.02 | $25,010 |
| Personal Care Services | 511,740 | 72.65 | $14.38 | $29,910 |
| Other Amusement and Recreation Industries | 461,230 | 36.25 | $15.89 | $33,050 |
| Home Health Care Services | 323,380 | 23.16 | $10.51 | $21,850 |
| Child Day Care Services | 297,720 | 33.76 | $10.99 | $22,860 |
Industries with the highest concentration of employment in this occupation:
| Industry | Employment (1) | Percent of industry employment | Hourly mean wage | Annual mean wage (2) |
|---|---|---|---|---|
| Personal Care Services | 511,740 | 72.65 | $14.38 | $29,910 |
| Individual and Family Services | 1,232,270 | 53.48 | $12.02 | $25,010 |
| Death Care Services | 65,210 | 47.69 | $19.02 | $39,570 |
| Residential Intellectual and Developmental Disability, Mental Health, and Substance Abuse Facilities | 281,280 | 44.87 | $12.40 | $25,790 |
| Other Amusement and Recreation Industries | 461,230 | 36.25 | $15.89 | $33,050 |
Top paying industries for this occupation:
| Industry | Employment (1) | Percent of industry employment | Hourly mean wage | Annual mean wage (2) |
|---|---|---|---|---|
| Federal Executive Branch (OES Designation) | 3,960 | 0.20 | $23.12 | $48,080 |
| Other Miscellaneous Manufacturing | 30 | 0.01 | $22.92 | $47,680 |
| Death Care Services | 65,210 | 47.69 | $19.02 | $39,570 |
| Clothing Stores | 800 | 0.08 | $18.92 | $39,360 |
| Rail Transportation | 840 | 0.36 | $18.84 | $39,200 |
States and areas with the highest published employment, location quotients, and wages for this occupation are provided. For a list of all areas with employment in this occupation, see the Create Customized Tables function.
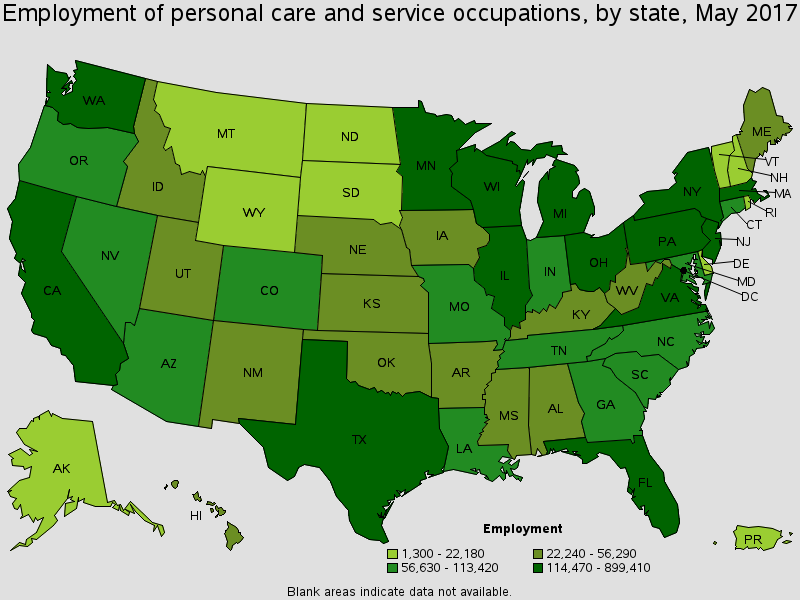
States with the highest employment level in this occupation:
| State | Employment (1) | Employment per thousand jobs | Location quotient (9) | Hourly mean wage | Annual mean wage (2) |
|---|---|---|---|---|---|
| California | 899,410 | 53.87 | 1.49 | $13.85 | $28,810 |
| New York | 405,750 | 44.07 | 1.22 | $14.84 | $30,860 |
| Texas | 397,120 | 33.40 | 0.92 | $11.11 | $23,100 |
| Pennsylvania | 248,200 | 42.93 | 1.19 | $12.36 | $25,710 |
| Florida | 243,940 | 28.98 | 0.80 | $12.90 | $26,840 |
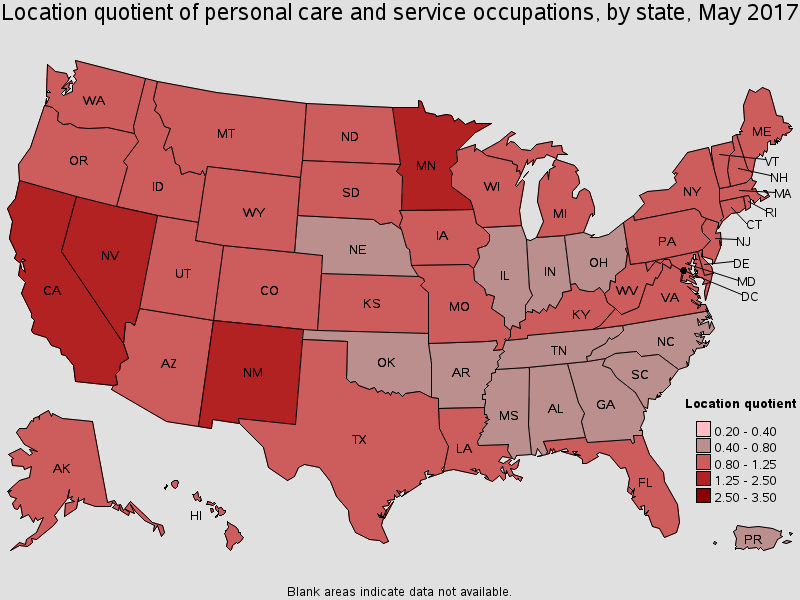
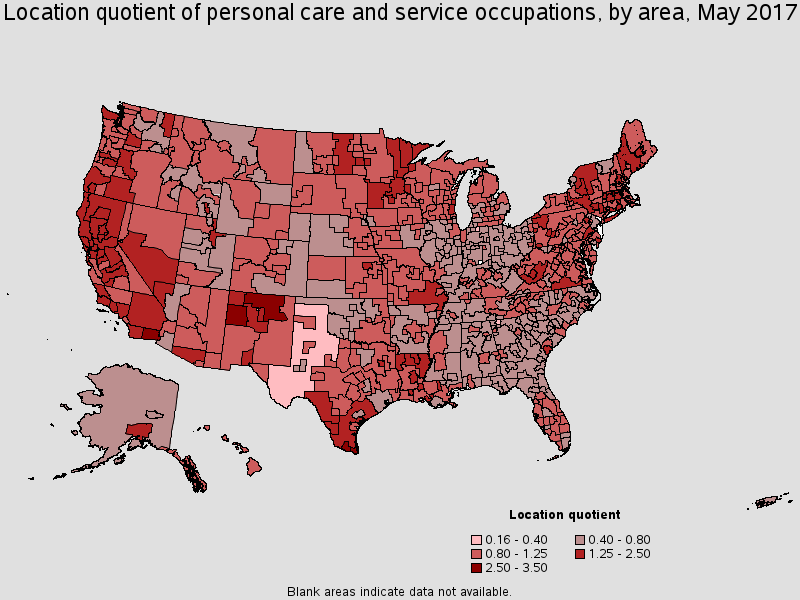
States with the highest concentration of jobs and location quotients in this occupation:
| State | Employment (1) | Employment per thousand jobs | Location quotient (9) | Hourly mean wage | Annual mean wage (2) |
|---|---|---|---|---|---|
| Nevada | 75,610 | 57.71 | 1.59 | $13.21 | $27,480 |
| California | 899,410 | 53.87 | 1.49 | $13.85 | $28,810 |
| New Mexico | 39,960 | 49.88 | 1.38 | $11.04 | $22,970 |
| Minnesota | 139,210 | 49.05 | 1.36 | $13.34 | $27,750 |
| Massachusetts | 157,030 | 44.51 | 1.23 | $15.68 | $32,620 |
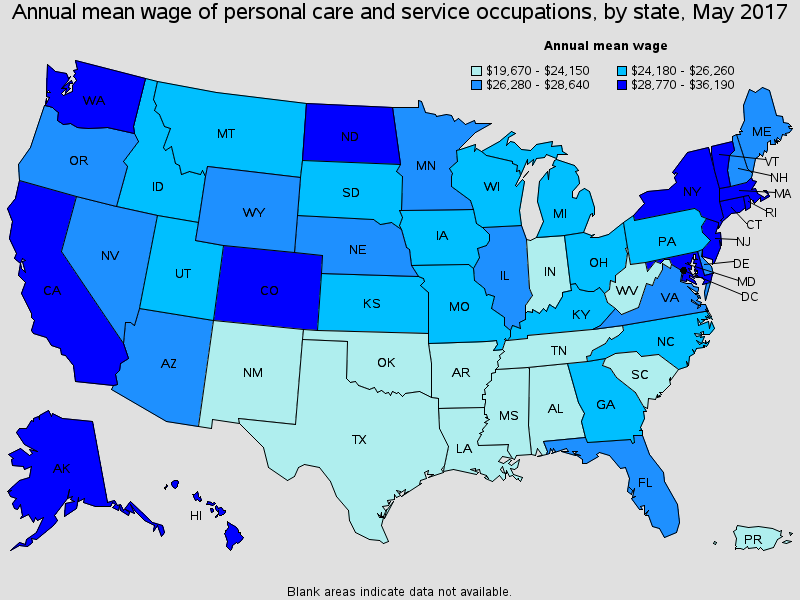
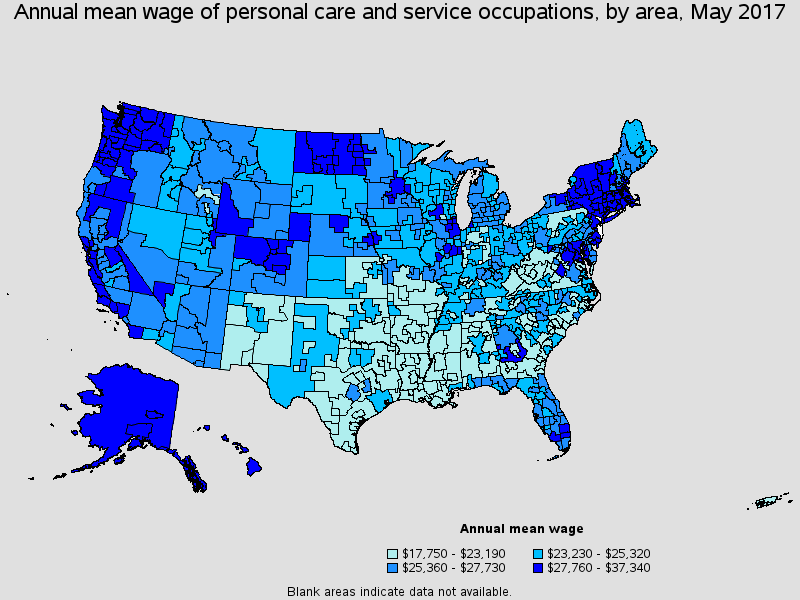
Top paying States for this occupation:
| State | Employment (1) | Employment per thousand jobs | Location quotient (9) | Hourly mean wage | Annual mean wage (2) |
|---|---|---|---|---|---|
| District of Columbia | 14,930 | 21.08 | 0.58 | $17.40 | $36,190 |
| Massachusetts | 157,030 | 44.51 | 1.23 | $15.68 | $32,620 |
| Washington | 118,650 | 37.23 | 1.03 | $15.64 | $32,540 |
| Alaska | 11,700 | 36.76 | 1.02 | $15.48 | $32,200 |
| New Jersey | 119,070 | 29.71 | 0.82 | $15.40 | $32,040 |
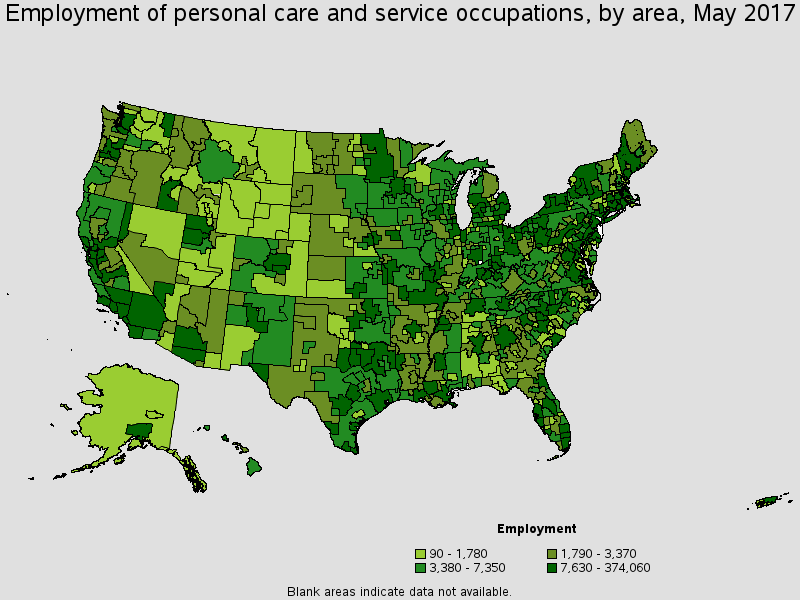
Metropolitan areas with the highest employment level in this occupation:
| Metropolitan area | Employment (1) | Employment per thousand jobs | Location quotient (9) | Hourly mean wage | Annual mean wage (2) |
|---|---|---|---|---|---|
| Los Angeles-Long Beach-Glendale, CA Metropolitan Division | 293,160 | 66.16 | 1.83 | $14.26 | $29,650 |
| New York-Jersey City-White Plains, NY-NJ Metropolitan Division | 271,970 | 40.63 | 1.12 | $15.59 | $32,430 |
| Chicago-Naperville-Arlington Heights, IL Metropolitan Division | 111,500 | 30.44 | 0.84 | $13.38 | $27,840 |
| Minneapolis-St. Paul-Bloomington, MN-WI | 97,210 | 50.31 | 1.39 | $13.54 | $28,160 |
| Riverside-San Bernardino-Ontario, CA | 81,210 | 56.58 | 1.56 | $12.75 | $26,520 |
| Houston-The Woodlands-Sugar Land, TX | 80,490 | 27.48 | 0.76 | $11.86 | $24,670 |
| Washington-Arlington-Alexandria, DC-VA-MD-WV Metropolitan Division | 74,190 | 29.45 | 0.81 | $15.06 | $31,330 |
| Phoenix-Mesa-Scottsdale, AZ | 68,510 | 34.60 | 0.96 | $13.10 | $27,250 |
| Boston-Cambridge-Newton, MA NECTA Division | 67,770 | 36.83 | 1.02 | $16.85 | $35,040 |
| San Diego-Carlsbad, CA | 67,080 | 46.80 | 1.29 | $14.13 | $29,390 |
Metropolitan areas with the highest concentration of jobs and location quotients in this occupation:
| Metropolitan area | Employment (1) | Employment per thousand jobs | Location quotient (9) | Hourly mean wage | Annual mean wage (2) |
|---|---|---|---|---|---|
| Brownsville-Harlingen, TX | 16,200 | 115.99 | 3.20 | $9.36 | $19,480 |
| McAllen-Edinburg-Mission, TX | 26,050 | 102.49 | 2.83 | $9.26 | $19,260 |
| El Centro, CA | 5,470 | 90.74 | 2.51 | $11.41 | $23,730 |
| Laredo, TX | 8,070 | 82.78 | 2.29 | $9.27 | $19,280 |
| Redding, CA | 5,170 | 79.99 | 2.21 | $12.56 | $26,130 |
| Chico, CA | 6,200 | 77.35 | 2.14 | $12.33 | $25,650 |
| Atlantic City-Hammonton, NJ | 9,060 | 72.44 | 2.00 | $14.25 | $29,650 |
| Mankato-North Mankato, MN | 3,630 | 69.25 | 1.91 | $13.48 | $28,050 |
| Hanford-Corcoran, CA | 2,880 | 68.43 | 1.89 | $11.69 | $24,320 |
| Springfield, MA-CT | 22,360 | 68.12 | 1.88 | $14.10 | $29,330 |
Top paying metropolitan areas for this occupation:
| Metropolitan area | Employment (1) | Employment per thousand jobs | Location quotient (9) | Hourly mean wage | Annual mean wage (2) |
|---|---|---|---|---|---|
| San Rafael, CA Metropolitan Division | 7,070 | 61.57 | 1.70 | $17.95 | $37,340 |
| Boulder, CO | 5,360 | 30.01 | 0.83 | $17.75 | $36,910 |
| Vineland-Bridgeton, NJ | 1,360 | 23.10 | 0.64 | $17.15 | $35,680 |
| Wenatchee, WA | 1,210 | 26.39 | 0.73 | $17.12 | $35,600 |
| Boston-Cambridge-Newton, MA NECTA Division | 67,770 | 36.83 | 1.02 | $16.85 | $35,040 |
| Fairbanks, AK | 910 | 24.73 | 0.68 | $16.68 | $34,700 |
| Seattle-Bellevue-Everett, WA Metropolitan Division | 56,770 | 34.46 | 0.95 | $16.48 | $34,270 |
| Framingham, MA NECTA Division | 6,230 | 36.04 | 1.00 | $16.36 | $34,020 |
| Ocean City, NJ | 1,680 | 43.37 | 1.20 | $16.12 | $33,540 |
| Kahului-Wailuku-Lahaina, HI | 3,120 | 42.04 | 1.16 | $15.90 | $33,080 |
Nonmetropolitan areas with the highest employment in this occupation:
| Nonmetropolitan area | Employment (1) | Employment per thousand jobs | Location quotient (9) | Hourly mean wage | Annual mean wage (2) |
|---|---|---|---|---|---|
| Southeast Missouri nonmetropolitan area | 10,600 | 64.52 | 1.78 | $10.25 | $21,310 |
| Southwest Maine nonmetropolitan area | 9,000 | 47.05 | 1.30 | $12.37 | $25,720 |
| North Texas Region of Texas nonmetropolitan area | 8,570 | 31.83 | 0.88 | $10.21 | $21,240 |
| North Northeastern Ohio non-metropolitan area (non-contiguous) | 8,200 | 24.71 | 0.68 | $11.47 | $23,860 |
| Balance of Lower Peninsula of Michigan nonmetropolitan area | 8,190 | 29.44 | 0.81 | $12.42 | $25,840 |
Nonmetropolitan areas with the highest concentration of jobs and location quotients in this occupation:
| Nonmetropolitan area | Employment (1) | Employment per thousand jobs | Location quotient (9) | Hourly mean wage | Annual mean wage (2) |
|---|---|---|---|---|---|
| North Central Massachusetts nonmetropolitan area | 540 | 93.78 | 2.59 | $14.85 | $30,890 |
| North and West Central New Mexico nonmetropolitan area | 5,800 | 93.65 | 2.59 | $10.35 | $21,520 |
| Wasatch Back nonmetropolitan area | 2,340 | 69.08 | 1.91 | $14.05 | $29,220 |
| Northwest Massachusetts nonmetropolitan area | 1,810 | 65.92 | 1.82 | $14.21 | $29,550 |
| Southeast Missouri nonmetropolitan area | 10,600 | 64.52 | 1.78 | $10.25 | $21,310 |
Top paying nonmetropolitan areas for this occupation:
| Nonmetropolitan area | Employment (1) | Employment per thousand jobs | Location quotient (9) | Hourly mean wage | Annual mean wage (2) |
|---|---|---|---|---|---|
| Nantucket Island and Martha's Vineyard nonmetropolitan area | 560 | 31.58 | 0.87 | $17.83 | $37,080 |
| Los Alamos County, New Mexico nonmetropolitan area | 90 | 5.76 | 0.16 | $17.58 | $36,570 |
| Southwest Massachusetts nonmetropolitan area | 380 | 42.80 | 1.18 | $17.40 | $36,200 |
| Garrett County, Maryland nonmetropolitan area | 190 | 16.70 | 0.46 | $16.50 | $34,320 |
| Balance of Alaska nonmetropolitan area | 1,770 | 24.81 | 0.69 | $16.36 | $34,030 |
These estimates are calculated with data collected from employers in all industry sectors, all metropolitan and nonmetropolitan areas, and all states and the District of Columbia.
The percentile wage estimate is the value of a wage below which a certain percent of workers fall. The median wage is the 50th percentile wage estimate--50 percent of workers earn less than the median and 50 percent of workers earn more than the median. More about percentile wages.
(1) Estimates for detailed occupations do not sum to the totals because the totals include occupations not shown separately. Estimates do not include self-employed workers.
(2) Annual wages have been calculated by multiplying the hourly mean wage by a "year-round, full-time" hours figure of 2,080 hours; for those occupations where there is not an hourly wage published, the annual wage has been directly calculated from the reported survey data.
(3) The relative standard error (RSE) is a measure of the reliability of a survey statistic. The smaller the relative standard error, the more precise the estimate.
(9) The location quotient is the ratio of the area concentration of occupational employment to the national average concentration. A location quotient greater than one indicates the occupation has a higher share of employment than average, and a location quotient less than one indicates the occupation is less prevalent in the area than average.
Other OES estimates and related information:
May 2017 National Occupational Employment and Wage Estimates
May 2017 State Occupational Employment and Wage Estimates
May 2017 Metropolitan and Nonmetropolitan Area Occupational Employment and Wage Estimates
May 2017 National Industry-Specific Occupational Employment and Wage Estimates
Last Modified Date: March 30, 2018