
An official website of the United States government
An official website of the United States government
The .gov means it's official.
Federal government websites often end in .gov or .mil. Before sharing sensitive information,
make sure you're on a federal government site.
The site is secure.
The
https:// ensures that you are connecting to the official website and that any
information you provide is encrypted and transmitted securely.
This major group comprises the following occupations: Chief Executives ; General and Operations Managers ; Legislators ; Advertising and Promotions Managers ; Marketing Managers ; Sales Managers ; Public Relations and Fundraising Managers ; Administrative Services Managers ; Computer and Information Systems Managers ; Financial Managers ; Industrial Production Managers ; Purchasing Managers ; Transportation, Storage, and Distribution Managers ; Compensation and Benefits Managers ; Human Resources Managers ; Training and Development Managers ; Farmers, Ranchers, and Other Agricultural Managers ; Construction Managers ; Education Administrators, Preschool and Childcare Center/Program ; Education Administrators, Elementary and Secondary School ; Education Administrators, Postsecondary ; Education Administrators, All Other ; Architectural and Engineering Managers ; Food Service Managers ; Funeral Service Managers ; Gaming Managers ; Lodging Managers ; Medical and Health Services Managers ; Natural Sciences Managers ; Postmasters and Mail Superintendents ; Property, Real Estate, and Community Association Managers ; Social and Community Service Managers ; Emergency Management Directors ; Managers, All Other
Employment estimate and mean wage estimates for this major group:
| Employment (1) | Employment RSE (3) |
Mean hourly wage |
Mean annual wage (2) |
Wage RSE (3) |
|---|---|---|---|---|
| 7,616,650 | 0.2 % | $58.44 | $121,560 | 0.1 % |
Percentile wage estimates for this major group:
| Percentile | 10% | 25% | 50% (Median) |
75% | 90% |
|---|---|---|---|---|---|
| Hourly Wage | $23.68 | $34.08 | $50.11 | $72.93 | (5) |
| Annual Wage (2) | $49,260 | $70,880 | $104,240 | $151,700 | (5) |
Industries with the highest published employment and wages for this occupation are provided. For a list of all industries with employment in this occupation, see the Create Customized Tables function.
Industries with the highest levels of employment in this occupation:
| Industry | Employment (1) | Percent of industry employment | Hourly mean wage | Annual mean wage (2) |
|---|---|---|---|---|
| Management of Companies and Enterprises | 465,550 | 19.62 | $72.69 | $151,190 |
| Elementary and Secondary Schools | 336,840 | 3.94 | $48.56 | $101,010 |
| Local Government, excluding schools and hospitals (OES Designation) | 292,780 | 5.34 | $44.63 | $92,820 |
| Computer Systems Design and Related Services | 250,410 | 11.96 | $76.69 | $159,510 |
| Real Estate | 241,340 | 14.91 | $43.08 | $89,600 |
Industries with the highest concentration of employment in this occupation:
| Industry | Employment (1) | Percent of industry employment | Hourly mean wage | Annual mean wage (2) |
|---|---|---|---|---|
| Land Subdivision | 8,380 | 21.48 | $59.39 | $123,530 |
| Lessors of Nonfinancial Intangible Assets (except Copyrighted Works) | 4,700 | 20.94 | $67.90 | $141,240 |
| Management of Companies and Enterprises | 465,550 | 19.62 | $72.69 | $151,190 |
| Grantmaking and Giving Services | 25,440 | 17.89 | $64.01 | $133,150 |
| Other Investment Pools and Funds | 1,360 | 15.93 | $77.98 | $162,190 |
Top paying industries for this occupation:
| Industry | Employment (1) | Percent of industry employment | Hourly mean wage | Annual mean wage (2) |
|---|---|---|---|---|
| Securities, Commodity Contracts, and Other Financial Investments and Related Activities | 96,270 | 10.34 | $93.97 | $195,450 |
| Monetary Authorities-Central Bank | 2,740 | 14.91 | $88.93 | $184,980 |
| Other Information Services | 38,800 | 13.12 | $83.86 | $174,420 |
| Scientific Research and Development Services | 95,800 | 14.21 | $82.60 | $171,810 |
| Computer and Peripheral Equipment Manufacturing | 16,670 | 10.63 | $81.91 | $170,380 |
States and areas with the highest published employment, location quotients, and wages for this occupation are provided. For a list of all areas with employment in this occupation, see the Create Customized Tables function.
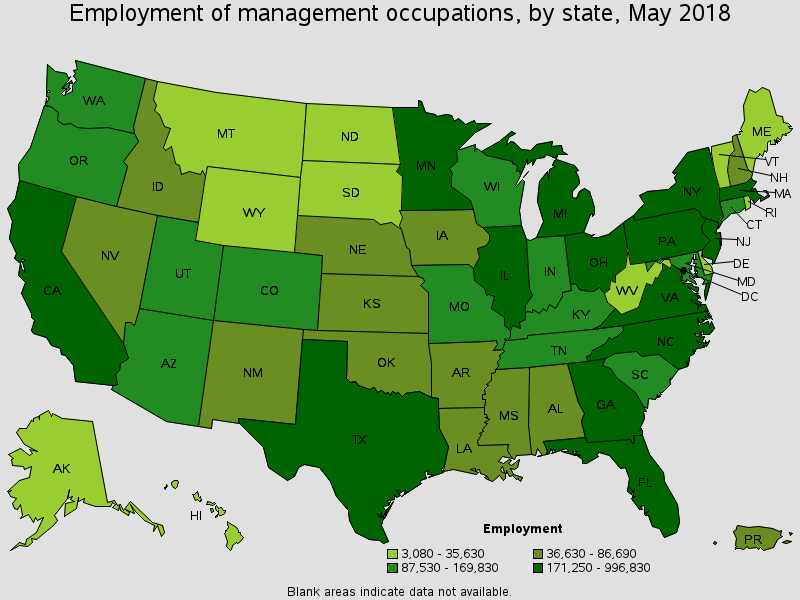
States with the highest employment level in this occupation:
| State | Employment (1) | Employment per thousand jobs | Location quotient (9) | Hourly mean wage | Annual mean wage (2) |
|---|---|---|---|---|---|
| California | 996,830 | 58.61 | 1.11 | $65.31 | $135,840 |
| Texas | 551,410 | 45.52 | 0.86 | $58.35 | $121,360 |
| New York | 482,770 | 51.44 | 0.98 | $74.95 | $155,900 |
| Illinois | 453,460 | 75.69 | 1.44 | $55.57 | $115,580 |
| Florida | 400,230 | 46.49 | 0.88 | $52.58 | $109,360 |
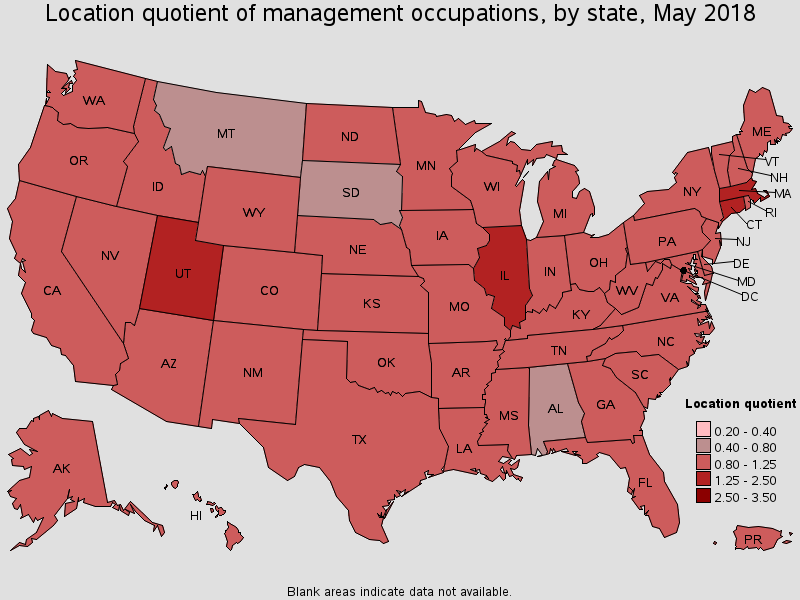
States with the highest concentration of jobs and location quotients in this occupation:
| State | Employment (1) | Employment per thousand jobs | Location quotient (9) | Hourly mean wage | Annual mean wage (2) |
|---|---|---|---|---|---|
| District of Columbia | 86,690 | 121.69 | 2.31 | $71.96 | $149,680 |
| Massachusetts | 294,490 | 82.46 | 1.57 | $64.38 | $133,910 |
| Illinois | 453,460 | 75.69 | 1.44 | $55.57 | $115,580 |
| Utah | 103,300 | 70.96 | 1.35 | $45.32 | $94,260 |
| Connecticut | 117,110 | 70.54 | 1.34 | $68.46 | $142,390 |
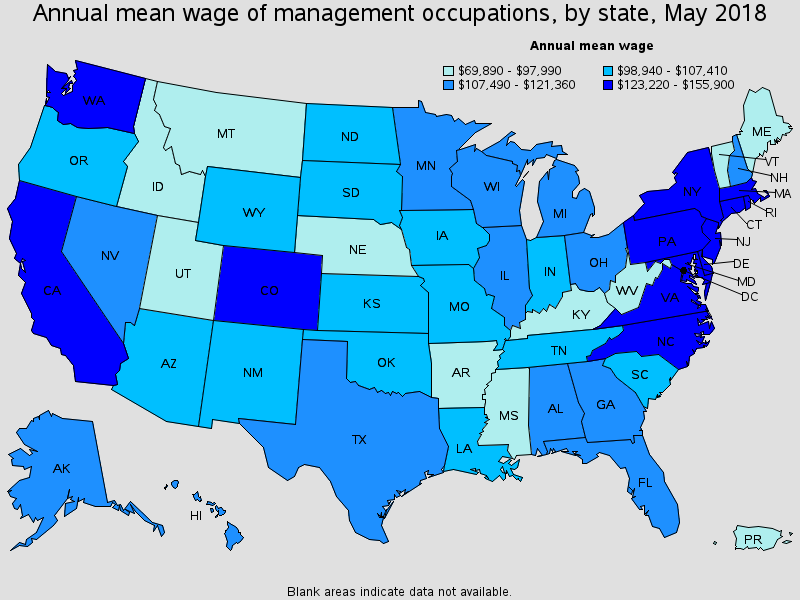
Top paying States for this occupation:
| State | Employment (1) | Employment per thousand jobs | Location quotient (9) | Hourly mean wage | Annual mean wage (2) |
|---|---|---|---|---|---|
| New York | 482,770 | 51.44 | 0.98 | $74.95 | $155,900 |
| New Jersey | 208,980 | 51.60 | 0.98 | $72.61 | $151,040 |
| District of Columbia | 86,690 | 121.69 | 2.31 | $71.96 | $149,680 |
| Connecticut | 117,110 | 70.54 | 1.34 | $68.46 | $142,390 |
| Virginia | 173,960 | 45.39 | 0.86 | $67.45 | $140,300 |
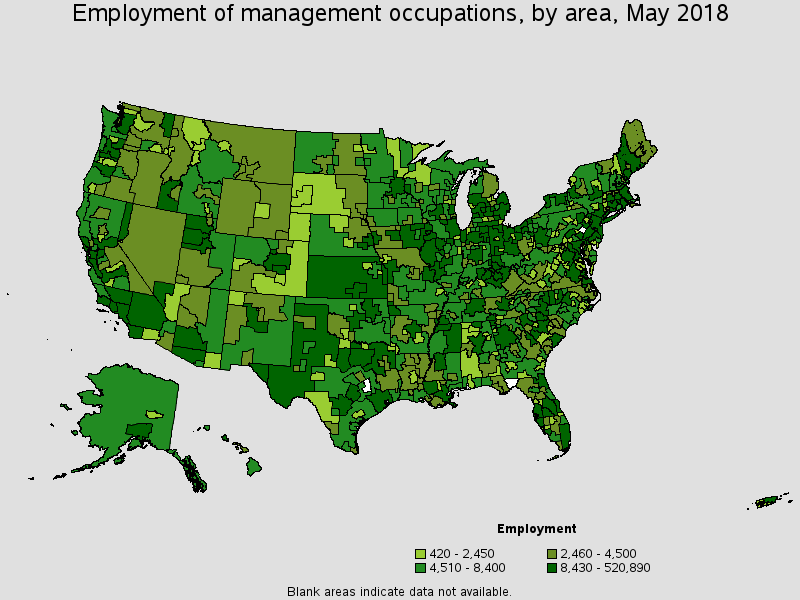
Metropolitan areas with the highest employment level in this occupation:
| Metropolitan area | Employment (1) | Employment per thousand jobs | Location quotient (9) | Hourly mean wage | Annual mean wage (2) |
|---|---|---|---|---|---|
| New York-Newark-Jersey City, NY-NJ-PA | 520,890 | 54.84 | 1.04 | $78.94 | $164,200 |
| Chicago-Naperville-Elgin, IL-IN-WI | 364,240 | 78.47 | 1.49 | $58.20 | $121,050 |
| Los Angeles-Long Beach-Anaheim, CA | 360,040 | 58.84 | 1.12 | $64.29 | $133,720 |
| Boston-Cambridge-Nashua, MA-NH | 245,580 | 89.02 | 1.69 | $67.45 | $140,290 |
| Washington-Arlington-Alexandria, DC-VA-MD-WV | 244,200 | 77.89 | 1.48 | $72.10 | $149,960 |
| San Francisco-Oakland-Hayward, CA | 186,210 | 76.97 | 1.46 | $75.45 | $156,940 |
| Atlanta-Sandy Springs-Roswell, GA | 176,370 | 65.74 | 1.25 | $60.74 | $126,340 |
| Dallas-Fort Worth-Arlington, TX | 174,960 | 49.03 | 0.93 | $61.18 | $127,250 |
| Houston-The Woodlands-Sugar Land, TX | 146,730 | 49.20 | 0.93 | $64.13 | $133,380 |
| Philadelphia-Camden-Wilmington, PA-NJ-DE-MD | 138,790 | 48.72 | 0.93 | $67.88 | $141,200 |
Metropolitan areas with the highest concentration of jobs and location quotients in this occupation:
| Metropolitan area | Employment (1) | Employment per thousand jobs | Location quotient (9) | Hourly mean wage | Annual mean wage (2) |
|---|---|---|---|---|---|
| Boston-Cambridge-Nashua, MA-NH | 245,580 | 89.02 | 1.69 | $67.45 | $140,290 |
| Bridgeport-Stamford-Norwalk, CT | 36,080 | 86.72 | 1.65 | $82.43 | $171,460 |
| Bloomington, IL | 7,470 | 83.92 | 1.59 | $49.87 | $103,730 |
| San Jose-Sunnyvale-Santa Clara, CA | 92,340 | 82.50 | 1.57 | $81.17 | $168,830 |
| Chicago-Naperville-Elgin, IL-IN-WI | 364,240 | 78.47 | 1.49 | $58.20 | $121,050 |
| Hartford-West Hartford-East Hartford, CT | 45,600 | 77.97 | 1.48 | $62.85 | $130,740 |
| Washington-Arlington-Alexandria, DC-VA-MD-WV | 244,200 | 77.89 | 1.48 | $72.10 | $149,960 |
| Salt Lake City, UT | 55,310 | 77.57 | 1.47 | $47.83 | $99,500 |
| San Francisco-Oakland-Hayward, CA | 186,210 | 76.97 | 1.46 | $75.45 | $156,940 |
| Provo-Orem, UT | 17,630 | 72.38 | 1.38 | $47.67 | $99,160 |
Top paying metropolitan areas for this occupation:
| Metropolitan area | Employment (1) | Employment per thousand jobs | Location quotient (9) | Hourly mean wage | Annual mean wage (2) |
|---|---|---|---|---|---|
| Bridgeport-Stamford-Norwalk, CT | 36,080 | 86.72 | 1.65 | $82.43 | $171,460 |
| San Jose-Sunnyvale-Santa Clara, CA | 92,340 | 82.50 | 1.57 | $81.17 | $168,830 |
| New York-Newark-Jersey City, NY-NJ-PA | 520,890 | 54.84 | 1.04 | $78.94 | $164,200 |
| San Francisco-Oakland-Hayward, CA | 186,210 | 76.97 | 1.46 | $75.45 | $156,940 |
| Washington-Arlington-Alexandria, DC-VA-MD-WV | 244,200 | 77.89 | 1.48 | $72.10 | $149,960 |
| Trenton, NJ | 13,740 | 59.38 | 1.13 | $71.96 | $149,680 |
| Boulder, CO | 10,040 | 55.09 | 1.05 | $69.98 | $145,560 |
| Denver-Aurora-Lakewood, CO | 70,680 | 47.82 | 0.91 | $67.98 | $141,400 |
| Philadelphia-Camden-Wilmington, PA-NJ-DE-MD | 138,790 | 48.72 | 0.93 | $67.88 | $141,200 |
| Boston-Cambridge-Nashua, MA-NH | 245,580 | 89.02 | 1.69 | $67.45 | $140,290 |
Nonmetropolitan areas with the highest employment in this occupation:
| Nonmetropolitan area | Employment (1) | Employment per thousand jobs | Location quotient (9) | Hourly mean wage | Annual mean wage (2) |
|---|---|---|---|---|---|
| Kansas nonmetropolitan area | 15,400 | 39.25 | 0.75 | $41.31 | $85,930 |
| North Northeastern Ohio non-metropolitan area (non-contiguous) | 11,380 | 33.98 | 0.65 | $45.35 | $94,330 |
| Southeast Iowa nonmetropolitan area | 11,280 | 49.77 | 0.95 | $44.00 | $91,530 |
| Balance of Lower Peninsula of Michigan nonmetropolitan area | 11,130 | 40.91 | 0.78 | $45.06 | $93,730 |
| West Central Illinois nonmetropolitan area | 10,810 | 62.13 | 1.18 | $36.81 | $76,570 |
Nonmetropolitan areas with the highest concentration of jobs and location quotients in this occupation:
| Nonmetropolitan area | Employment (1) | Employment per thousand jobs | Location quotient (9) | Hourly mean wage | Annual mean wage (2) |
|---|---|---|---|---|---|
| Eastern Utah nonmetropolitan area | 5,690 | 73.73 | 1.40 | $38.36 | $79,780 |
| Massachusetts nonmetropolitan area | 4,340 | 72.10 | 1.37 | $47.39 | $98,570 |
| Connecticut nonmetropolitan area | 2,210 | 66.92 | 1.27 | $49.23 | $102,410 |
| Alaska nonmetropolitan area | 6,950 | 65.45 | 1.24 | $49.32 | $102,590 |
| West Central Illinois nonmetropolitan area | 10,810 | 62.13 | 1.18 | $36.81 | $76,570 |
Top paying nonmetropolitan areas for this occupation:
| Nonmetropolitan area | Employment (1) | Employment per thousand jobs | Location quotient (9) | Hourly mean wage | Annual mean wage (2) |
|---|---|---|---|---|---|
| West Central-Southwest New Hampshire nonmetropolitan area | 5,570 | 54.54 | 1.04 | $55.46 | $115,350 |
| Southwest New York nonmetropolitan area | 6,980 | 37.76 | 0.72 | $52.83 | $109,880 |
| Piedmont North Carolina nonmetropolitan area | 8,310 | 32.10 | 0.61 | $50.83 | $105,730 |
| East South Dakota nonmetropolitan area | 3,340 | 25.42 | 0.48 | $50.31 | $104,650 |
| Central New Hampshire nonmetropolitan area | 5,610 | 58.04 | 1.10 | $50.19 | $104,400 |
These estimates are calculated with data collected from employers in all industry sectors, all metropolitan and nonmetropolitan areas, and all states and the District of Columbia.
The percentile wage estimate is the value of a wage below which a certain percent of workers fall. The median wage is the 50th percentile wage estimate--50 percent of workers earn less than the median and 50 percent of workers earn more than the median. More about percentile wages.
(1) Estimates for detailed occupations do not sum to the totals because the totals include occupations not shown separately. Estimates do not include self-employed workers.
(2) Annual wages have been calculated by multiplying the hourly mean wage by a "year-round, full-time" hours figure of 2,080 hours; for those occupations where there is not an hourly wage published, the annual wage has been directly calculated from the reported survey data.
(3) The relative standard error (RSE) is a measure of the reliability of a survey statistic. The smaller the relative standard error, the more precise the estimate.
(5) This wage is equal to or greater than $100.00 per hour or $208,000 per year.
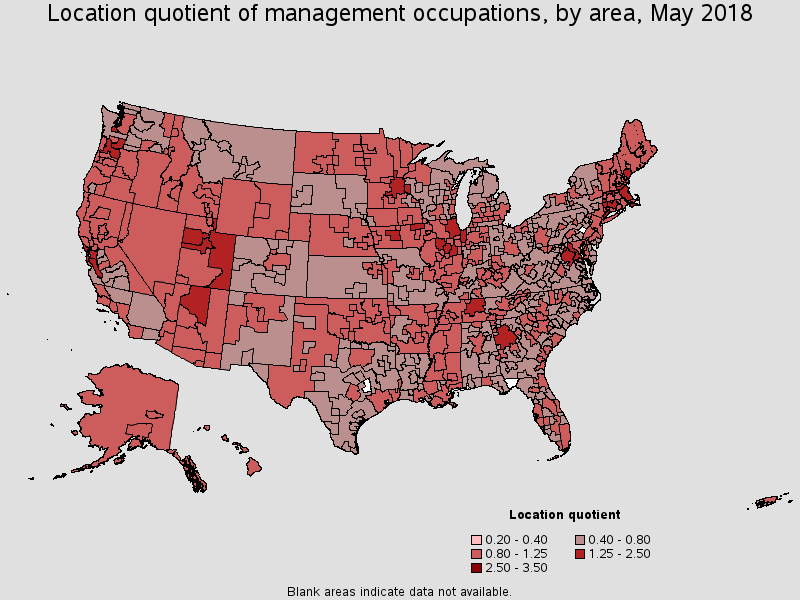
(9) The location quotient is the ratio of the area concentration of occupational employment to the national average concentration. A location quotient greater than one indicates the occupation has a higher share of employment than average, and a location quotient less than one indicates the occupation is less prevalent in the area than average.
Other OES estimates and related information:
May 2018 National Occupational Employment and Wage Estimates
May 2018 State Occupational Employment and Wage Estimates
May 2018 Metropolitan and Nonmetropolitan Area Occupational Employment and Wage Estimates
May 2018 National Industry-Specific Occupational Employment and Wage Estimates
Last Modified Date: March 29, 2019