
An official website of the United States government
An official website of the United States government
The .gov means it's official.
Federal government websites often end in .gov or .mil. Before sharing sensitive information,
make sure you're on a federal government site.
The site is secure.
The
https:// ensures that you are connecting to the official website and that any
information you provide is encrypted and transmitted securely.
This major group comprises the following occupations: First-Line Supervisors of Mechanics, Installers, and Repairers ; Computer, Automated Teller, and Office Machine Repairers ; Radio, Cellular, and Tower Equipment Installers and Repairers ; Telecommunications Equipment Installers and Repairers, Except Line Installers ; Avionics Technicians ; Electric Motor, Power Tool, and Related Repairers ; Electrical and Electronics Installers and Repairers, Transportation Equipment ; Electrical and Electronics Repairers, Commercial and Industrial Equipment ; Electrical and Electronics Repairers, Powerhouse, Substation, and Relay ; Electronic Equipment Installers and Repairers, Motor Vehicles ; Audiovisual Equipment Installers and Repairers ; Security and Fire Alarm Systems Installers ; Aircraft Mechanics and Service Technicians ; Automotive Body and Related Repairers ; Automotive Glass Installers and Repairers ; Automotive Service Technicians and Mechanics ; Bus and Truck Mechanics and Diesel Engine Specialists ; Farm Equipment Mechanics and Service Technicians ; Mobile Heavy Equipment Mechanics, Except Engines ; Rail Car Repairers ; Motorboat Mechanics and Service Technicians ; Motorcycle Mechanics ; Outdoor Power Equipment and Other Small Engine Mechanics ; Bicycle Repairers ; Recreational Vehicle Service Technicians ; Tire Repairers and Changers ; Mechanical Door Repairers ; Control and Valve Installers and Repairers, Except Mechanical Door ; Heating, Air Conditioning, and Refrigeration Mechanics and Installers ; Home Appliance Repairers ; Industrial Machinery Mechanics ; Maintenance Workers, Machinery ; Millwrights ; Refractory Materials Repairers, Except Brickmasons ; Electrical Power-Line Installers and Repairers ; Telecommunications Line Installers and Repairers ; Camera and Photographic Equipment Repairers ; Medical Equipment Repairers ; Musical Instrument Repairers and Tuners ; Watch and Clock Repairers ; Precision Instrument and Equipment Repairers, All Other ; Maintenance and Repair Workers, General ; Wind Turbine Service Technicians ; Coin, Vending, and Amusement Machine Servicers and Repairers ; Commercial Divers ; Locksmiths and Safe Repairers ; Manufactured Building and Mobile Home Installers ; Riggers ; Signal and Track Switch Repairers ; Helpers--Installation, Maintenance, and Repair Workers ; Installation, Maintenance, and Repair Workers, All Other
Employment estimate and mean wage estimates for this major group:
| Employment (1) | Employment RSE (3) |
Mean hourly wage |
Mean annual wage (2) |
Wage RSE (3) |
|---|---|---|---|---|
| 5,713,450 | 0.3 % | $24.10 | $50,130 | 0.1 % |
Percentile wage estimates for this major group:
| Percentile | 10% | 25% | 50% (Median) |
75% | 90% |
|---|---|---|---|---|---|
| Hourly Wage | $12.86 | $16.60 | $22.42 | $29.77 | $38.24 |
| Annual Wage (2) | $26,740 | $34,530 | $46,630 | $61,930 | $79,540 |
Industries with the highest published employment and wages for this occupation are provided. For a list of all industries with employment in this occupation, see the Create Customized Tables function.
Industries with the highest levels of employment in this occupation:
| Industry | Employment (1) | Percent of industry employment | Hourly mean wage | Annual mean wage (2) |
|---|---|---|---|---|
| Automotive Repair and Maintenance | 454,220 | 48.28 | $21.40 | $44,520 |
| Building Equipment Contractors | 437,470 | 19.65 | $24.45 | $50,860 |
| Real Estate | 352,350 | 21.14 | $20.02 | $41,640 |
| Automobile Dealers | 315,630 | 24.36 | $23.67 | $49,240 |
| Local Government, excluding schools and hospitals (OES Designation) | 275,290 | 4.97 | $25.59 | $53,220 |
Industries with the highest concentration of employment in this occupation:
| Industry | Employment (1) | Percent of industry employment | Hourly mean wage | Annual mean wage (2) |
|---|---|---|---|---|
| Automotive Repair and Maintenance | 454,220 | 48.28 | $21.40 | $44,520 |
| Electronic and Precision Equipment Repair and Maintenance | 48,850 | 47.31 | $22.53 | $46,870 |
| Commercial and Industrial Machinery and Equipment (except Automotive and Electronic) Repair and Maintenance | 98,890 | 46.04 | $24.68 | $51,340 |
| Personal and Household Goods Repair and Maintenance | 31,760 | 40.02 | $20.64 | $42,940 |
| Telecommunications | 233,700 | 32.53 | $30.50 | $63,440 |
Top paying industries for this occupation:
| Industry | Employment (1) | Percent of industry employment | Hourly mean wage | Annual mean wage (2) |
|---|---|---|---|---|
| Scheduled Air Transportation | 40,110 | 8.85 | $40.99 | $85,260 |
| Electric Power Generation, Transmission and Distribution | 116,280 | 30.25 | $38.09 | $79,240 |
| Natural Gas Distribution | 23,630 | 21.59 | $36.49 | $75,900 |
| Other Pipeline Transportation | 1,010 | 12.10 | $33.97 | $70,660 |
| Couriers and Express Delivery Services | 11,630 | 1.66 | $33.50 | $69,670 |
States and areas with the highest published employment, location quotients, and wages for this occupation are provided. For a list of all areas with employment in this occupation, see the Create Customized Tables function.
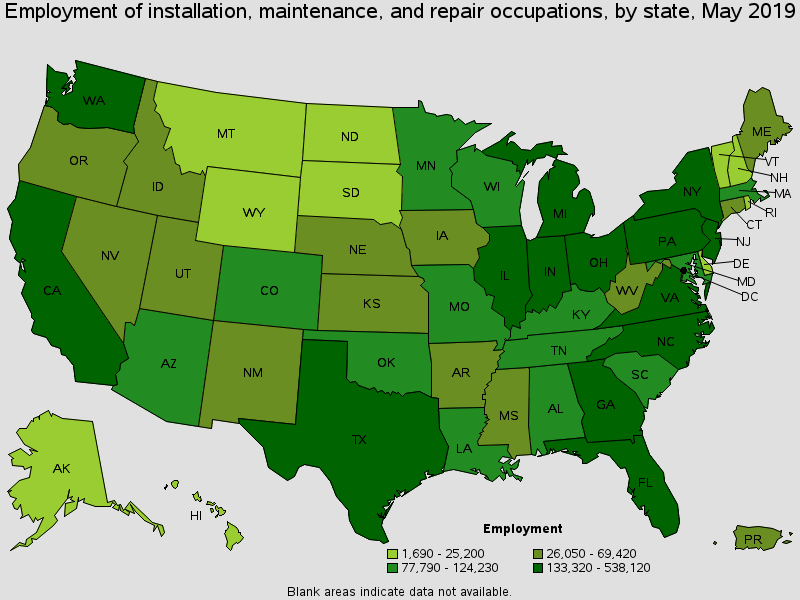
States with the highest employment level in this occupation:
| State | Employment (1) | Employment per thousand jobs | Location quotient (9) | Hourly mean wage | Annual mean wage (2) |
|---|---|---|---|---|---|
| California | 538,120 | 30.96 | 0.80 | $26.77 | $55,680 |
| Texas | 530,380 | 42.67 | 1.10 | $23.14 | $48,130 |
| Florida | 368,910 | 41.95 | 1.08 | $21.42 | $44,550 |
| New York | 318,830 | 33.48 | 0.86 | $26.20 | $54,490 |
| Pennsylvania | 238,530 | 40.42 | 1.04 | $24.05 | $50,010 |
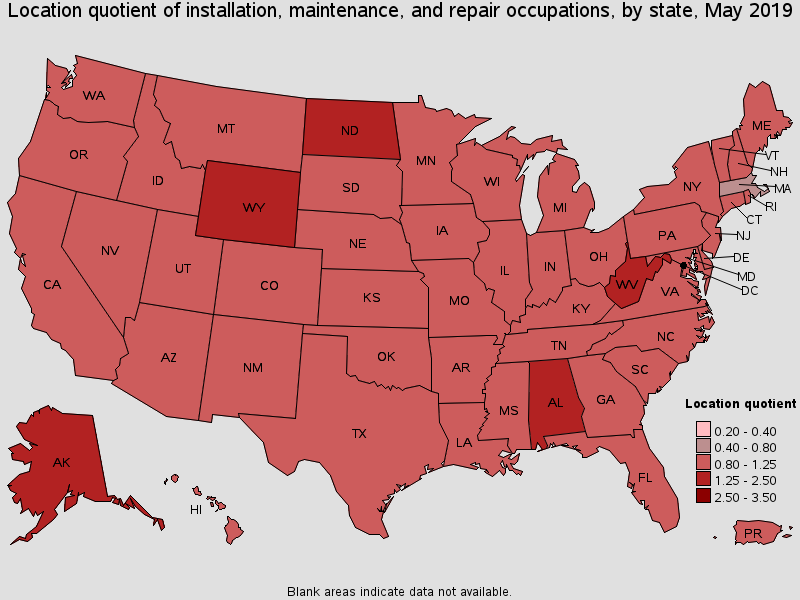
States with the highest concentration of jobs and location quotients in this occupation:
| State | Employment (1) | Employment per thousand jobs | Location quotient (9) | Hourly mean wage | Annual mean wage (2) |
|---|---|---|---|---|---|
| Wyoming | 18,110 | 66.26 | 1.70 | $27.71 | $57,650 |
| Alaska | 18,180 | 57.32 | 1.47 | $29.45 | $61,260 |
| North Dakota | 22,590 | 53.46 | 1.37 | $26.78 | $55,700 |
| West Virginia | 35,430 | 50.46 | 1.30 | $20.92 | $43,520 |
| Alabama | 98,500 | 49.89 | 1.28 | $22.75 | $47,310 |
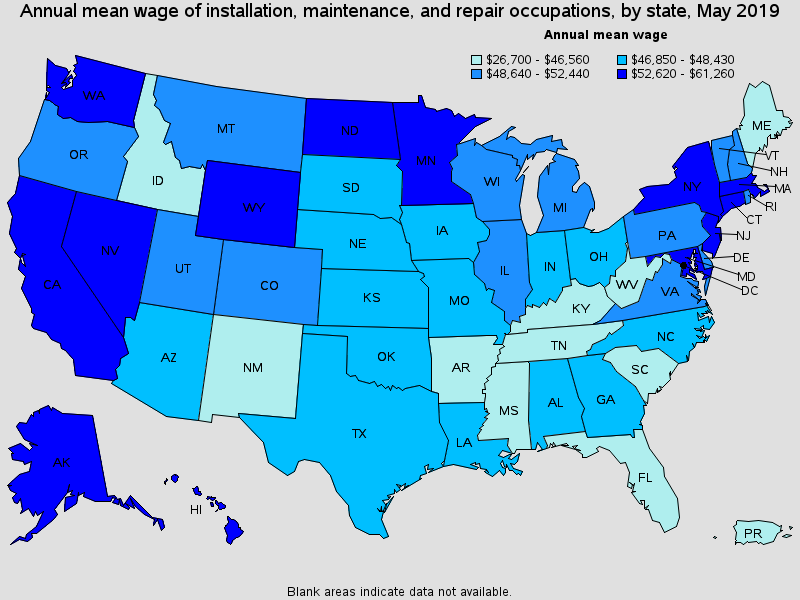
Top paying States for this occupation:
| State | Employment (1) | Employment per thousand jobs | Location quotient (9) | Hourly mean wage | Annual mean wage (2) |
|---|---|---|---|---|---|
| Alaska | 18,180 | 57.32 | 1.47 | $29.45 | $61,260 |
| District of Columbia | 9,640 | 13.32 | 0.34 | $29.15 | $60,630 |
| Connecticut | 53,980 | 32.42 | 0.83 | $27.94 | $58,110 |
| Hawaii | 25,200 | 39.65 | 1.02 | $27.87 | $57,980 |
| Wyoming | 18,110 | 66.26 | 1.70 | $27.71 | $57,650 |
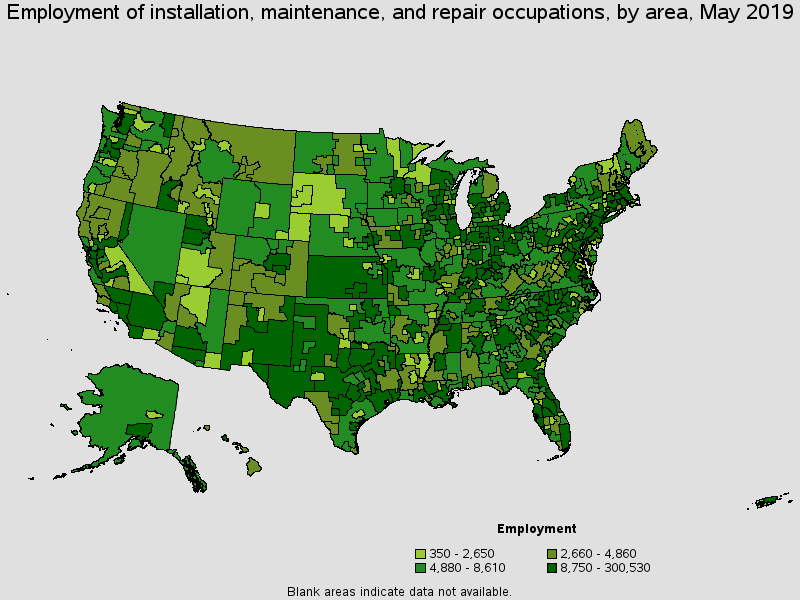
Metropolitan areas with the highest employment level in this occupation:
| Metropolitan area | Employment (1) | Employment per thousand jobs | Location quotient (9) | Hourly mean wage | Annual mean wage (2) |
|---|---|---|---|---|---|
| New York-Newark-Jersey City, NY-NJ-PA | 300,530 | 31.13 | 0.80 | $27.52 | $57,240 |
| Los Angeles-Long Beach-Anaheim, CA | 175,720 | 28.16 | 0.72 | $26.75 | $55,630 |
| Chicago-Naperville-Elgin, IL-IN-WI | 156,000 | 33.36 | 0.86 | $25.58 | $53,210 |
| Dallas-Fort Worth-Arlington, TX | 147,380 | 40.30 | 1.04 | $24.28 | $50,510 |
| Houston-The Woodlands-Sugar Land, TX | 133,010 | 43.58 | 1.12 | $24.31 | $50,560 |
| Miami-Fort Lauderdale-West Palm Beach, FL | 106,960 | 40.48 | 1.04 | $21.99 | $45,750 |
| Atlanta-Sandy Springs-Roswell, GA | 103,050 | 37.56 | 0.97 | $24.05 | $50,010 |
| Philadelphia-Camden-Wilmington, PA-NJ-DE-MD | 98,180 | 34.13 | 0.88 | $25.97 | $54,020 |
| Washington-Arlington-Alexandria, DC-VA-MD-WV | 96,050 | 30.21 | 0.78 | $27.62 | $57,440 |
| Phoenix-Mesa-Scottsdale, AZ | 81,360 | 38.36 | 0.99 | $23.51 | $48,900 |
Metropolitan areas with the highest concentration of jobs and location quotients in this occupation:
| Metropolitan area | Employment (1) | Employment per thousand jobs | Location quotient (9) | Hourly mean wage | Annual mean wage (2) |
|---|---|---|---|---|---|
| Anniston-Oxford-Jacksonville, AL | 3,320 | 75.45 | 1.94 | $22.55 | $46,900 |
| Warner Robins, GA | 5,040 | 68.77 | 1.77 | $23.90 | $49,720 |
| Casper, WY | 2,650 | 68.14 | 1.75 | $24.89 | $51,770 |
| Odessa, TX | 5,430 | 66.76 | 1.72 | $24.15 | $50,230 |
| New Bern, NC | 2,850 | 65.69 | 1.69 | $24.17 | $50,260 |
| East Stroudsburg, PA | 3,700 | 65.08 | 1.67 | $22.18 | $46,130 |
| Farmington, NM | 3,060 | 64.41 | 1.66 | $26.57 | $55,270 |
| Midland, TX | 7,000 | 63.19 | 1.62 | $25.49 | $53,020 |
| Bremerton-Silverdale, WA | 5,520 | 61.53 | 1.58 | $29.09 | $60,500 |
| Dalton, GA | 3,920 | 60.98 | 1.57 | $21.09 | $43,860 |
Top paying metropolitan areas for this occupation:
| Metropolitan area | Employment (1) | Employment per thousand jobs | Location quotient (9) | Hourly mean wage | Annual mean wage (2) |
|---|---|---|---|---|---|
| Bridgeport-Stamford-Norwalk, CT | 12,360 | 29.87 | 0.77 | $30.99 | $64,450 |
| Fairbanks, AK | 1,890 | 56.39 | 1.45 | $30.80 | $64,070 |
| San Francisco-Oakland-Hayward, CA | 69,640 | 28.17 | 0.72 | $30.50 | $63,440 |
| San Jose-Sunnyvale-Santa Clara, CA | 29,570 | 25.92 | 0.67 | $30.40 | $63,230 |
| California-Lexington Park, MD | 2,620 | 54.88 | 1.41 | $30.32 | $63,070 |
| Anchorage, AK | 9,100 | 52.15 | 1.34 | $29.33 | $61,000 |
| Bremerton-Silverdale, WA | 5,520 | 61.53 | 1.58 | $29.09 | $60,500 |
| Seattle-Tacoma-Bellevue, WA | 75,560 | 37.39 | 0.96 | $28.99 | $60,290 |
| Vallejo-Fairfield, CA | 5,970 | 42.04 | 1.08 | $28.78 | $59,870 |
| Urban Honolulu, HI | 18,010 | 39.36 | 1.01 | $28.68 | $59,650 |
Nonmetropolitan areas with the highest employment in this occupation:
| Nonmetropolitan area | Employment (1) | Employment per thousand jobs | Location quotient (9) | Hourly mean wage | Annual mean wage (2) |
|---|---|---|---|---|---|
| Kansas nonmetropolitan area | 20,940 | 53.14 | 1.37 | $21.81 | $45,360 |
| North Northeastern Ohio non-metropolitan area (non-contiguous) | 15,880 | 47.52 | 1.22 | $21.74 | $45,210 |
| North Texas Region of Texas nonmetropolitan area | 13,620 | 49.20 | 1.26 | $22.15 | $46,070 |
| West Texas Region of Texas nonmetropolitan area | 13,290 | 65.89 | 1.69 | $22.37 | $46,530 |
| Balance of Lower Peninsula of Michigan nonmetropolitan area | 12,760 | 46.73 | 1.20 | $21.76 | $45,260 |
Nonmetropolitan areas with the highest concentration of jobs and location quotients in this occupation:
| Nonmetropolitan area | Employment (1) | Employment per thousand jobs | Location quotient (9) | Hourly mean wage | Annual mean wage (2) |
|---|---|---|---|---|---|
| Nevada nonmetropolitan area | 8,070 | 82.13 | 2.11 | $28.43 | $59,140 |
| Southeast Alabama nonmetropolitan area | 6,880 | 79.68 | 2.05 | (8) | (8) |
| Eastern Wyoming nonmetropolitan area | 6,070 | 71.28 | 1.83 | $29.06 | $60,440 |
| Western Wyoming nonmetropolitan area | 6,830 | 68.50 | 1.76 | $28.05 | $58,340 |
| Southwest Alabama nonmetropolitan area | 4,600 | 68.22 | 1.75 | $23.84 | $49,600 |
Top paying nonmetropolitan areas for this occupation:
| Nonmetropolitan area | Employment (1) | Employment per thousand jobs | Location quotient (9) | Hourly mean wage | Annual mean wage (2) |
|---|---|---|---|---|---|
| West North Dakota nonmetropolitan area | 8,540 | 68.00 | 1.75 | $29.82 | $62,020 |
| Alaska nonmetropolitan area | 7,070 | 65.23 | 1.68 | $29.14 | $60,610 |
| Eastern Wyoming nonmetropolitan area | 6,070 | 71.28 | 1.83 | $29.06 | $60,440 |
| Nevada nonmetropolitan area | 8,070 | 82.13 | 2.11 | $28.43 | $59,140 |
| Western Wyoming nonmetropolitan area | 6,830 | 68.50 | 1.76 | $28.05 | $58,340 |
These estimates are calculated with data collected from employers in all industry sectors, all metropolitan and nonmetropolitan areas, and all states and the District of Columbia.
The percentile wage estimate is the value of a wage below which a certain percent of workers fall. The median wage is the 50th percentile wage estimate--50 percent of workers earn less than the median and 50 percent of workers earn more than the median. More about percentile wages.
(1) Estimates for detailed occupations do not sum to the totals because the totals include occupations not shown separately. Estimates do not include self-employed workers.
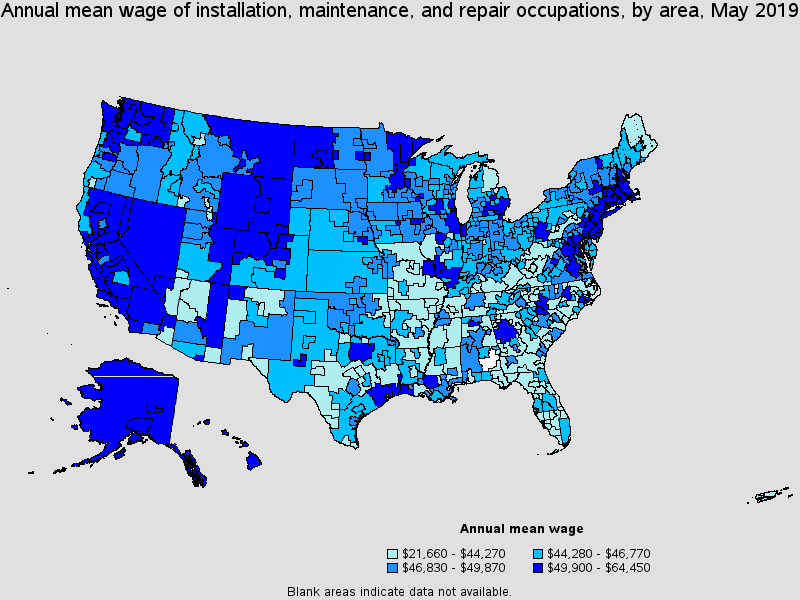
(2) Annual wages have been calculated by multiplying the hourly mean wage by a "year-round, full-time" hours figure of 2,080 hours; for those occupations where there is not an hourly wage published, the annual wage has been directly calculated from the reported survey data.
(3) The relative standard error (RSE) is a measure of the reliability of a survey statistic. The smaller the relative standard error, the more precise the estimate.
(8) Estimate not released.
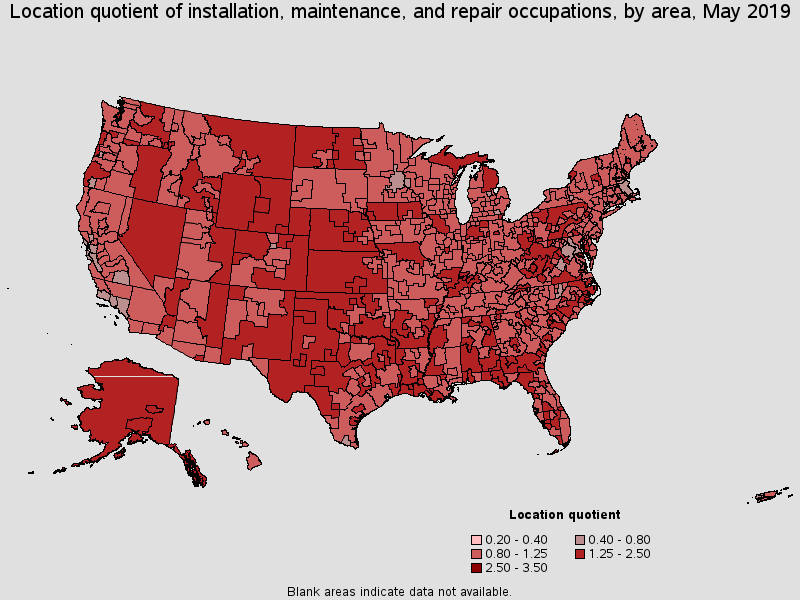
(9) The location quotient is the ratio of the area concentration of occupational employment to the national average concentration. A location quotient greater than one indicates the occupation has a higher share of employment than average, and a location quotient less than one indicates the occupation is less prevalent in the area than average.
Other OES estimates and related information:
May 2019 National Occupational Employment and Wage Estimates
May 2019 State Occupational Employment and Wage Estimates
May 2019 Metropolitan and Nonmetropolitan Area Occupational Employment and Wage Estimates
May 2019 National Industry-Specific Occupational Employment and Wage Estimates
Last Modified Date: July 6, 2020