
An official website of the United States government
An official website of the United States government
The .gov means it's official.
Federal government websites often end in .gov or .mil. Before sharing sensitive information,
make sure you're on a federal government site.
The site is secure.
The
https:// ensures that you are connecting to the official website and that any
information you provide is encrypted and transmitted securely.
Transportation and Material Moving Occupations comprises the following occupations: Aircraft Cargo Handling Supervisors; First-Line Supervisors of Transportation and Material Moving Workers, Except Aircraft Cargo Handling Supervisors; Commercial Pilots; Airline Pilots, Copilots, and Flight Engineers; Airfield Operations Specialists; Air Traffic Controllers; Flight Attendants; Ambulance Drivers and Attendants, Except Emergency Medical Technicians; Driver/Sales Workers; Light Truck Drivers; Heavy and Tractor-Trailer Truck Drivers; Taxi Drivers; Bus Drivers, Transit and Intercity; Shuttle Drivers and Chauffeurs; Bus Drivers, School; Motor Vehicle Operators, All Other; Rail Yard Engineers, Dinkey Operators, and Hostlers; Locomotive Engineers; Railroad Brake, Signal, and Switch Operators and Locomotive Firers; Railroad Conductors and Yardmasters; Subway and Streetcar Operators; Rail Transportation Workers, All Other; Sailors and Marine Oilers; Motorboat Operators; Captains, Mates, and Pilots of Water Vessels; Ship Engineers; Bridge and Lock Tenders; Parking Attendants; Aircraft Service Attendants; Automotive and Watercraft Service Attendants; Traffic Technicians; Transportation Inspectors; Passenger Attendants; Transportation Workers, All Other; Conveyor Operators and Tenders; Crane and Tower Operators; Dredge Operators; Hoist and Winch Operators; Industrial Truck and Tractor Operators; Machine Feeders and Offbearers; Cleaners of Vehicles and Equipment; Packers and Packagers, Hand; Stockers and Order Fillers; Laborers and Freight, Stock, and Material Movers, Hand; Gas Compressor and Gas Pumping Station Operators; Pump Operators, Except Wellhead Pumpers; Wellhead Pumpers; Refuse and Recyclable Material Collectors; Tank Car, Truck, and Ship Loaders; Material Moving Workers, All Other
Employment estimate and mean wage estimates for Transportation and Material Moving Occupations:
| Employment (1) | Employment RSE (3) |
Mean hourly wage |
Mean annual wage (2) |
Wage RSE (3) |
|---|---|---|---|---|
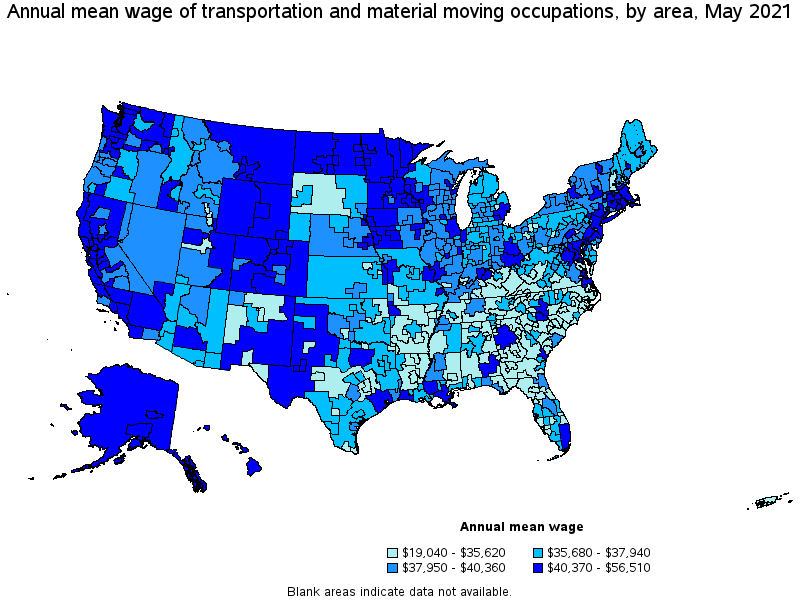
| 12,639,920 | 0.2 % | $ 19.88 | $ 41,340 | 0.2 % |
Percentile wage estimates for Transportation and Material Moving Occupations:
| Percentile | 10% | 25% | 50% (Median) |
75% | 90% |
|---|---|---|---|---|---|
| Hourly Wage | $ 11.45 | $ 14.19 | $ 17.72 | $ 22.88 | $ 29.72 |
| Annual Wage (2) | $ 23,820 | $ 29,520 | $ 36,860 | $ 47,590 | $ 61,820 |
Industries with the highest published employment and wages for Transportation and Material Moving Occupations are provided. For a list of all industries with employment in Transportation and Material Moving Occupations, see the Create Customized Tables function.
Industries with the highest levels of employment in Transportation and Material Moving Occupations:
| Industry | Employment (1) | Percent of industry employment | Hourly mean wage | Annual mean wage (2) |
|---|---|---|---|---|
| Warehousing and Storage | 1,237,810 | 74.69 | $ 19.43 | $ 40,410 |
| Truck Transportation | 1,120,890 | 75.12 | $ 24.32 | $ 50,580 |
| Employment Services | 885,900 | 25.40 | $ 15.04 | $ 31,290 |
| General Merchandise Stores | 801,860 | 25.99 | $ 15.16 | $ 31,540 |
| Food and Beverage Stores (4451 and 4452 only) | 794,700 | 26.87 | $ 14.75 | $ 30,670 |
Industries with the highest concentration of employment in Transportation and Material Moving Occupations:
| Industry | Employment (1) | Percent of industry employment | Hourly mean wage | Annual mean wage (2) |
|---|---|---|---|---|
| Couriers and Express Delivery Services | 786,980 | 84.88 | $ 22.72 | $ 47,260 |
| Inland Water Transportation | 19,830 | 77.77 | $ 40.64 | $ 84,540 |
| School and Employee Bus Transportation | 137,870 | 77.38 | $ 20.27 | $ 42,160 |
| Local Messengers and Local Delivery | 123,900 | 76.25 | $ 18.73 | $ 38,950 |
| Truck Transportation | 1,120,890 | 75.12 | $ 24.32 | $ 50,580 |
Top paying industries for Transportation and Material Moving Occupations:
| Industry | Employment (1) | Percent of industry employment | Hourly mean wage | Annual mean wage (2) |
|---|---|---|---|---|
| Nonscheduled Air Transportation | 22,570 | 46.44 | $ 54.36 | $ 113,070 |
| Scheduled Air Transportation | 243,620 | 62.20 | $ 47.43 | $ 98,650 |
| Federal Executive Branch (OEWS Designation) | 55,230 | 2.62 | $ 44.17 | $ 91,880 |
| Inland Water Transportation | 19,830 | 77.77 | $ 40.64 | $ 84,540 |
| Securities, Commodity Contracts, and Other Financial Investments and Related Activities | 770 | 0.08 | $ 40.37 | $ 83,960 |
States and areas with the highest published employment, location quotients, and wages for Transportation and Material Moving Occupations are provided. For a list of all areas with employment in Transportation and Material Moving Occupations, see the Create Customized Tables function.
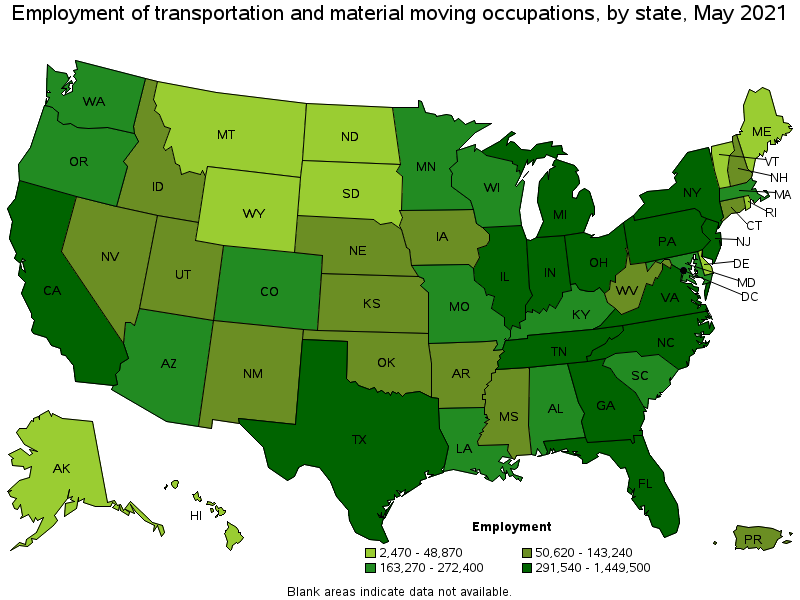
States with the highest employment level in Transportation and Material Moving Occupations:
| State | Employment (1) | Employment per thousand jobs | Location quotient (9) | Hourly mean wage | Annual mean wage (2) |
|---|---|---|---|---|---|
| California | 1,449,500 | 87.69 | 0.98 | $ 21.22 | $ 44,130 |
| Texas | 1,129,330 | 92.37 | 1.03 | $ 19.60 | $ 40,770 |
| Florida | 720,860 | 83.77 | 0.93 | $ 18.66 | $ 38,810 |
| Illinois | 593,810 | 105.68 | 1.18 | $ 20.44 | $ 42,520 |
| New York | 582,750 | 67.22 | 0.75 | $ 23.02 | $ 47,880 |
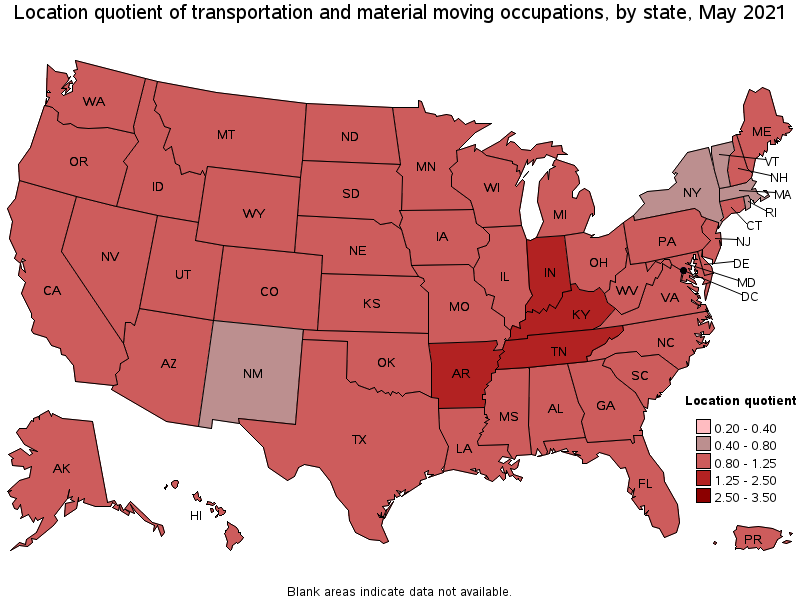
States with the highest concentration of jobs and location quotients in Transportation and Material Moving Occupations:
| State | Employment (1) | Employment per thousand jobs | Location quotient (9) | Hourly mean wage | Annual mean wage (2) |
|---|---|---|---|---|---|
| Tennessee | 355,630 | 119.07 | 1.33 | $ 18.16 | $ 37,770 |
| Kentucky | 213,190 | 115.97 | 1.29 | $ 19.68 | $ 40,940 |
| Arkansas | 133,880 | 112.41 | 1.25 | $ 18.27 | $ 38,000 |
| Indiana | 333,990 | 111.95 | 1.25 | $ 18.98 | $ 39,470 |
| New Jersey | 428,160 | 111.20 | 1.24 | $ 20.29 | $ 42,190 |
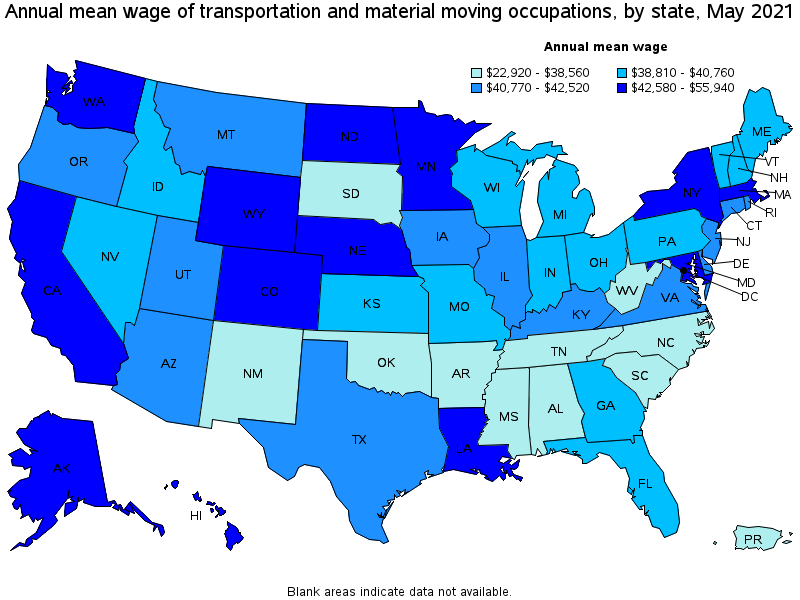
Top paying states for Transportation and Material Moving Occupations:
| State | Employment (1) | Employment per thousand jobs | Location quotient (9) | Hourly mean wage | Annual mean wage (2) |
|---|---|---|---|---|---|
| Alaska | 27,040 | 91.40 | 1.02 | $ 26.90 | $ 55,940 |
| District of Columbia | 14,720 | 22.24 | 0.25 | $ 26.05 | $ 54,190 |
| Hawaii | 41,250 | 75.22 | 0.84 | $ 23.94 | $ 49,790 |
| Washington | 272,400 | 84.97 | 0.95 | $ 23.45 | $ 48,780 |
| New York | 582,750 | 67.22 | 0.75 | $ 23.02 | $ 47,880 |
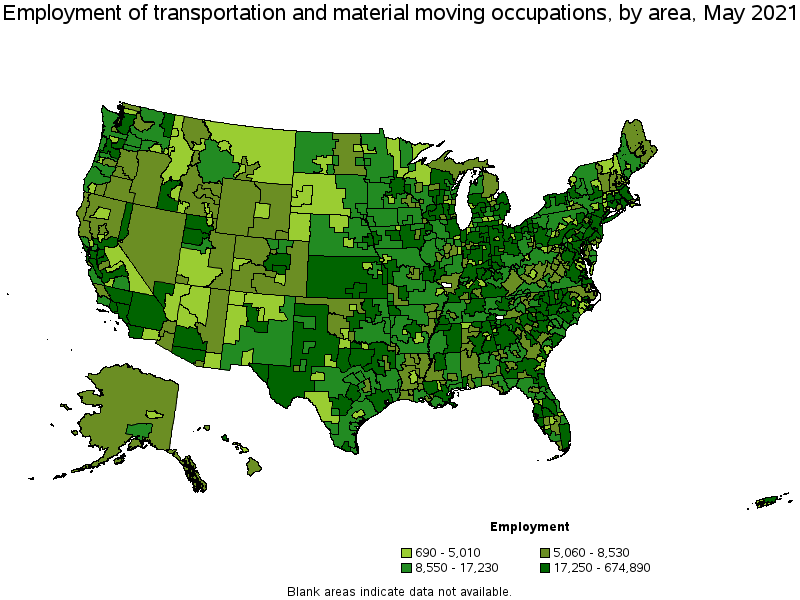
Metropolitan areas with the highest employment level in Transportation and Material Moving Occupations:
| Metropolitan area | Employment (1) | Employment per thousand jobs | Location quotient (9) | Hourly mean wage | Annual mean wage (2) |
|---|---|---|---|---|---|
| New York-Newark-Jersey City, NY-NJ-PA | 674,890 | 77.77 | 0.87 | $ 23.05 | $ 47,940 |
| Los Angeles-Long Beach-Anaheim, CA | 481,620 | 84.21 | 0.94 | $ 21.09 | $ 43,860 |
| Chicago-Naperville-Elgin, IL-IN-WI | 455,970 | 107.72 | 1.20 | $ 20.86 | $ 43,380 |
| Dallas-Fort Worth-Arlington, TX | 376,950 | 105.03 | 1.17 | $ 20.62 | $ 42,890 |
| Atlanta-Sandy Springs-Roswell, GA | 281,600 | 108.81 | 1.21 | $ 20.29 | $ 42,200 |
| Houston-The Woodlands-Sugar Land, TX | 268,590 | 92.71 | 1.03 | $ 20.53 | $ 42,700 |
| Riverside-San Bernardino-Ontario, CA | 254,610 | 166.41 | 1.85 | $ 20.38 | $ 42,380 |
| Philadelphia-Camden-Wilmington, PA-NJ-DE-MD | 228,460 | 86.06 | 0.96 | $ 19.55 | $ 40,670 |
| Miami-Fort Lauderdale-West Palm Beach, FL | 213,470 | 87.04 | 0.97 | $ 20.62 | $ 42,900 |
| Phoenix-Mesa-Scottsdale, AZ | 196,620 | 92.89 | 1.04 | $ 20.37 | $ 42,370 |
Metropolitan areas with the highest concentration of jobs and location quotients in Transportation and Material Moving Occupations:
| Metropolitan area | Employment (1) | Employment per thousand jobs | Location quotient (9) | Hourly mean wage | Annual mean wage (2) |
|---|---|---|---|---|---|
| Stockton-Lodi, CA | 51,980 | 202.83 | 2.26 | $ 21.10 | $ 43,880 |
| Memphis, TN-MS-AR | 105,400 | 174.27 | 1.94 | $ 19.06 | $ 39,640 |
| Chambersburg-Waynesboro, PA | 9,540 | 168.24 | 1.88 | $ 18.90 | $ 39,310 |
| Riverside-San Bernardino-Ontario, CA | 254,610 | 166.41 | 1.85 | $ 20.38 | $ 42,380 |
| Lakeland-Winter Haven, FL | 38,470 | 161.40 | 1.80 | $ 18.04 | $ 37,530 |
| Hagerstown-Martinsburg, MD-WV | 14,480 | 147.72 | 1.65 | $ 18.73 | $ 38,960 |
| Scranton--Wilkes-Barre--Hazleton, PA | 34,770 | 146.31 | 1.63 | $ 18.24 | $ 37,940 |
| Houma-Thibodaux, LA | 11,500 | 144.43 | 1.61 | (8) | (8) |
| Danville, IL | 3,620 | 144.29 | 1.61 | $ 19.91 | $ 41,410 |
| Allentown-Bethlehem-Easton, PA-NJ | 49,700 | 143.20 | 1.60 | $ 19.11 | $ 39,750 |
Top paying metropolitan areas for Transportation and Material Moving Occupations:
| Metropolitan area | Employment (1) | Employment per thousand jobs | Location quotient (9) | Hourly mean wage | Annual mean wage (2) |
|---|---|---|---|---|---|
| Anchorage, AK | 15,630 | 96.66 | 1.08 | $ 27.10 | $ 56,360 |
| Seattle-Tacoma-Bellevue, WA | 154,920 | 80.79 | 0.90 | $ 25.50 | $ 53,050 |
| Urban Honolulu, HI | 29,750 | 75.30 | 0.84 | $ 25.36 | $ 52,750 |
| San Francisco-Oakland-Hayward, CA | 156,410 | 69.76 | 0.78 | $ 25.33 | $ 52,680 |
| Fairbanks, AK | 3,160 | 91.59 | 1.02 | $ 24.49 | $ 50,940 |
| San Jose-Sunnyvale-Santa Clara, CA | 50,450 | 47.21 | 0.53 | $ 23.22 | $ 48,290 |
| New York-Newark-Jersey City, NY-NJ-PA | 674,890 | 77.77 | 0.87 | $ 23.05 | $ 47,940 |
| Denver-Aurora-Lakewood, CO | 118,460 | 80.87 | 0.90 | $ 22.97 | $ 47,780 |
| Washington-Arlington-Alexandria, DC-VA-MD-WV | 156,050 | 53.21 | 0.59 | $ 22.81 | $ 47,440 |
| Midland, TX | 10,890 | 114.43 | 1.28 | $ 22.75 | $ 47,320 |
Nonmetropolitan areas with the highest employment in Transportation and Material Moving Occupations:
| Nonmetropolitan area | Employment (1) | Employment per thousand jobs | Location quotient (9) | Hourly mean wage | Annual mean wage (2) |
|---|---|---|---|---|---|
| Kansas nonmetropolitan area | 35,060 | 93.31 | 1.04 | $ 17.81 | $ 37,050 |
| North Northeastern Ohio nonmetropolitan area (noncontiguous) | 28,620 | 91.05 | 1.01 | $ 18.17 | $ 37,790 |
| West Northwestern Ohio nonmetropolitan area | 27,480 | 114.68 | 1.28 | $ 18.74 | $ 38,990 |
| North Texas Region of Texas nonmetropolitan area | 26,920 | 101.24 | 1.13 | $ 17.25 | $ 35,880 |
| Piedmont North Carolina nonmetropolitan area | 26,340 | 107.87 | 1.20 | $ 16.40 | $ 34,100 |
Nonmetropolitan areas with the highest concentration of jobs and location quotients in Transportation and Material Moving Occupations:
| Nonmetropolitan area | Employment (1) | Employment per thousand jobs | Location quotient (9) | Hourly mean wage | Annual mean wage (2) |
|---|---|---|---|---|---|
| North Georgia nonmetropolitan area | 24,810 | 146.00 | 1.63 | $ 15.88 | $ 33,030 |
| West Arkansas nonmetropolitan area | 10,990 | 131.03 | 1.46 | $ 16.90 | $ 35,150 |
| Southern Pennsylvania nonmetropolitan area | 23,020 | 127.89 | 1.43 | $ 18.48 | $ 38,440 |
| Northeast Alabama nonmetropolitan area | 17,930 | 126.33 | 1.41 | $ 14.96 | $ 31,130 |
| South Arkansas nonmetropolitan area | 11,390 | 125.31 | 1.40 | $ 16.75 | $ 34,840 |
Top paying nonmetropolitan areas for Transportation and Material Moving Occupations:
| Nonmetropolitan area | Employment (1) | Employment per thousand jobs | Location quotient (9) | Hourly mean wage | Annual mean wage (2) |
|---|---|---|---|---|---|
| Alaska nonmetropolitan area | 8,060 | 82.86 | 0.92 | $ 27.17 | $ 56,510 |
| West North Dakota nonmetropolitan area | 12,580 | 118.77 | 1.32 | $ 24.64 | $ 51,250 |
| Western Wyoming nonmetropolitan area | 7,260 | 77.22 | 0.86 | $ 21.69 | $ 45,120 |
| East North Dakota nonmetropolitan area | 5,780 | 94.73 | 1.06 | $ 21.17 | $ 44,040 |
| Northwest Colorado nonmetropolitan area | 6,880 | 58.96 | 0.66 | $ 20.98 | $ 43,650 |
These estimates are calculated with data collected from employers in all industry sectors, all metropolitan and nonmetropolitan areas, and all states and the District of Columbia.
The percentile wage estimate is the value of a wage below which a certain percent of workers fall. The median wage is the 50th percentile wage estimate—50 percent of workers earn less than the median and 50 percent of workers earn more than the median. More about percentile wages.
(1) Estimates for detailed occupations do not sum to the totals because the totals include occupations not shown separately. Estimates do not include self-employed workers.
(2) Annual wages have been calculated by multiplying the hourly mean wage by a "year-round, full-time" hours figure of 2,080 hours; for those occupations where there is not an hourly wage published, the annual wage has been directly calculated from the reported survey data.
(3) The relative standard error (RSE) is a measure of the reliability of a survey statistic. The smaller the relative standard error, the more precise the estimate.
(8) Estimate not released.
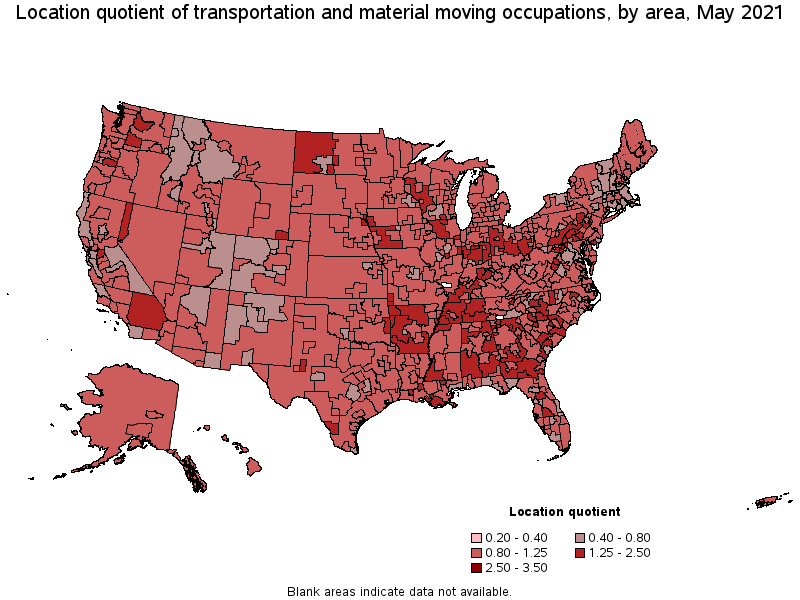
(9) The location quotient is the ratio of the area concentration of occupational employment to the national average concentration. A location quotient greater than one indicates the occupation has a higher share of employment than average, and a location quotient less than one indicates the occupation is less prevalent in the area than average.
Other OEWS estimates and related information:
May 2021 National Occupational Employment and Wage Estimates
May 2021 State Occupational Employment and Wage Estimates
May 2021 Metropolitan and Nonmetropolitan Area Occupational Employment and Wage Estimates
May 2021 National Industry-Specific Occupational Employment and Wage Estimates
Last Modified Date: March 31, 2022