
An official website of the United States government
An official website of the United States government
The .gov means it's official.
Federal government websites often end in .gov or .mil. Before sharing sensitive information,
make sure you're on a federal government site.
The site is secure.
The
https:// ensures that you are connecting to the official website and that any
information you provide is encrypted and transmitted securely.
June 2010
Retail salespersons and cashiers were the two largest occupations in May 2009, representing nearly 1 out of every 17 jobs. Just 15 occupations accounted for over one-quarter of U.S. employment. In addition to retail salespersons and cashiers, these occupations included general office clerks, janitors, heavy and tractor-trailer truck drivers, and elementary school teachers. Of the 15 largest occupations, only 3—general and operations managers, registered nurses, and elementary school teachers—had mean wages above the U.S. average of $20.90 per hour or $43,460 annually. (See chart 1.)
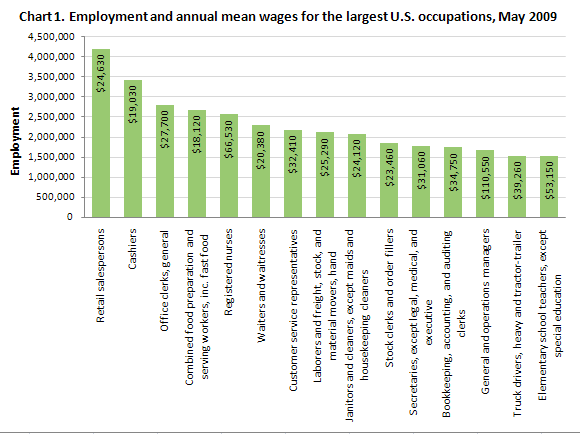
Click here to see these data in table format.
At the other end of the spectrum, occupations with employment of 5,000 or less accounted for about 0.1 percent of total U.S. employment. Some of the smallest occupations in the United States are shown in chart 2. These occupations included dredge operators, astronomers, geographers, locomotive firers, and radio operators.
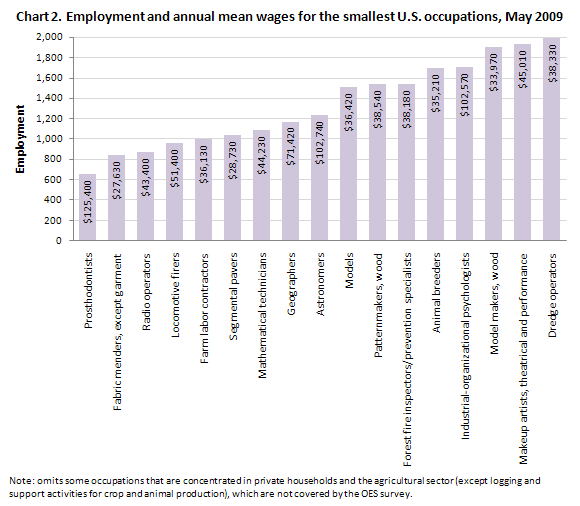
Click here to see these data in table format.
More than 1 out of every 3 jobs was in an office and administrative support, sales, or food preparation and serving occupation. (See chart 3.) Office and administrative support jobs made up 5 of the 15 largest occupations, including general office clerks, with employment of over 2.8 million; customer service representatives (2.2 million); stock clerks and order fillers (1.9 million); secretaries, except legal, medical, and executive (1.8 million); and bookkeeping, accounting, and auditing clerks (1.8 million). The largest food preparation and serving occupations included combined food preparation and serving workers and waiters and waitresses, which were also among the largest occupations overall. Life, physical, and social science; community and social services; legal; and arts, design, entertainment, sports, and media were among the smallest occupational groups, each accounting for only about 1 percent of total employment.
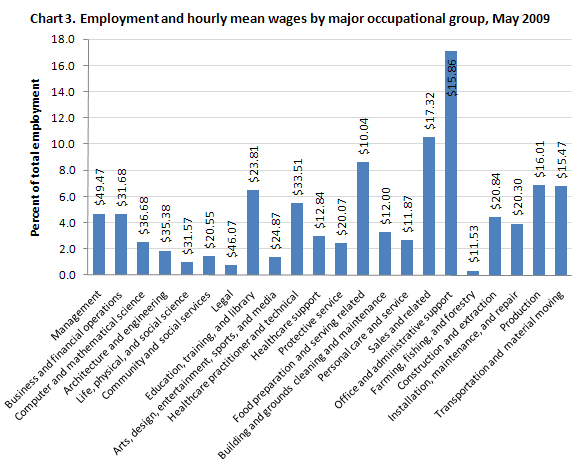
Click here to see these data in table format.
Establishments providing health care and social assistance, such as hospitals and physicians’ offices, accounted for about 1 out of every 8 jobs, more than any other type of employer. The five largest occupations in this industry made up over one-third of total industry employment, and included registered nurses; nursing aides, orderlies, and attendants; and home health aides. (See table a.)
| Largest occupations in sector | |||||||
|---|---|---|---|---|---|---|---|
Industry sector | Percent of total U.S. employment | Occupation | Employment | Percent of sector employment | Hourly mean wage | Annual mean wage | |
Health care and social assistance | 12.9 | Registered nurses | 2,225,330 | 13.2 | $32.02 | $66,600 | |
| Nursing aides, orderlies, and attendants | 1,317,360 | 7.8 | 11.89 | 24,720 | |||
| Home health aides | 899,980 | 5.3 | 10.24 | 21,300 | |||
| Licensed practical and licensed vocational nurses | 623,210 | 3.7 | 19.58 | 40,730 | |||
| Personal and home care aides | 570,480 | 3.4 | 9.64 | 20,040 | |||
Retail trade | 11.5 | Retail salespersons | 3,891,310 | 26.0 | 11.75 | 24,440 | |
| Cashiers | 2,828,730 | 18.9 | 9.14 | 19,010 | |||
| Stock clerks and order fillers | 1,303,730 | 8.7 | 10.25 | 21,320 | |||
| First-line supervisors/managers of retail sales workers | 1,037,570 | 6.9 | 18.66 | 38,800 | |||
| Laborers and freight, stock, and material movers, hand | 351,870 | 2.4 | 10.53 | 21,900 | |||
Educational services | 9.8 | Elementary school teachers, except special education | 1,532,990 | 12.0 | (1) | 53,190 | |
| Teacher assistants | 1,098,920 | 8.6 | (1) | 24,710 | |||
| Secondary school teachers, except special and vocational education | 1,084,060 | 8.5 | (1) | 55,200 | |||
| Middle school teachers, except special and vocational education | 661,700 | 5.2 | (1) | 53,580 | |||
| Teachers and instructors, all other | 525,780 | 4.1 | (1) | 40,140 | |||
Manufacturing | 9.5 | Team assemblers | 756,630 | 6.1 | 14.52 | 30,190 | |
| First-line supervisors/managers of production and operating workers | 444,390 | 3.6 | 26.60 | 55,320 | |||
| Machinists | 305,610 | 2.5 | 18.78 | 39,060 | |||
| Inspectors, testers, sorters, samplers, and weighers | 299,450 | 2.4 | 16.90 | 35,150 | |||
| Helpers--production workers | 286,600 | 2.3 | 11.92 | 24,790 | |||
Accommodation and food services | 8.6 | Combined food preparation and serving workers, including fast food | 2,229,440 | 19.8 | 8.46 | 17,590 | |
| Waiters and waitresses | 2,128,120 | 18.9 | 9.76 | 20,310 | |||
| Cooks, restaurant | 849,920 | 7.5 | 11.05 | 22,980 | |||
| First-line supervisors/managers of food preparation and serving workers | 620,750 | 5.5 | 14.83 | 30,840 | |||
| Cooks, fast food | 514,660 | 4.6 | 8.73 | 18,160 | |||
(1) Wages for some occupations that do not generally work year round, full time, are reported either as hourly wages or annual salaries, depending on how they are typically paid. | |||||||
Retail trade businesses accounted for more than 1 out of every 9 jobs. Cashiers, retail salespersons, and their supervisors made up over half of employment in the retail trade sector. Two occupations associated with handling merchandise—stock clerks and order fillers; and laborers and hand freight, stock, and material movers—made up an additional 11 percent of retail employment. Manufacturing establishments, providers of educational services, and businesses offering accommodation and food services were also among the largest employers, with each of these three industry sectors accounting for 9 to 10 percent of total employment.
The U.S. median wage in 2009 was $15.95 per hour or $33,190 per year. The median represents the wage in the middle of the earnings distribution—half of jobs pay this amount or more, and half pay this amount or less—and may be a more accurate measure of typical earnings than the mean wage, which can be affected by a small percentage of jobs with very high pay. Occupations with wages near the U.S. median included many office and administrative support; construction; installation, maintenance, and repair; production; and transportation and material moving occupations. Chart 4 shows some of the largest occupations with wages between $1.00 above and $1.00 below the median, including dental assistants, insurance claims and policy processing clerks, general maintenance and repair workers, and transit and intercity bus drivers. In addition, these occupations included first-line supervisors for two groups of relatively low-paying occupations: retail sales workers and housekeeping and janitorial workers.
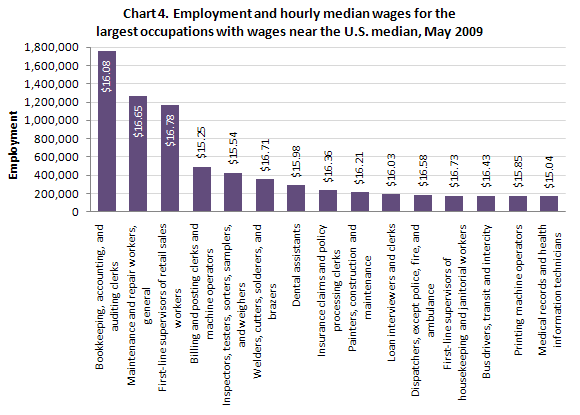
Click here to see these data in table format.
California, Texas, New York, Florida, and Illinois were the States with the highest total employment, accounting for more than one-third of U.S. jobs. These and other States with high overall employment also had the highest employment of many individual occupations. However, smaller States were among the largest employers of some occupations, due in part to factors like geographical characteristics and industry mix. For example, Nevada, a relatively small State in terms of total employment, had more gaming managers, gaming dealers, and gaming supervisors than any other State; Mississippi, another small State, also had some of the highest employment of these occupations. Colorado, Louisiana, and Oklahoma had among the highest employment of petroleum engineers and geological and petroleum technicians. The midwestern States of Iowa, Nebraska, Kansas, Wisconsin, and Minnesota accounted for about 7 percent of total U.S. employment, but 28 percent of employment of farm equipment mechanics; all of these States except Wisconsin also had among the highest employment of slaughterers and meatpackers.
As at the State level, metropolitan areas and divisions with high total employment—like New York-White Plains-Wayne, N.Y.-N.J.; Los Angeles-Long Beach-Glendale, Calif.; Chicago-Naperville-Joliet, Ill.; and Houston-Sugar Land-Baytown, Texas—also tended to have high employment in many specific occupations. However, there were exceptions. Orlando-Kissimmee, Fla., a much smaller area than those listed above, had some of the highest employment levels of meeting and convention planners; baggage porters and bellhops; travel agents; and hotel, motel, and resort desk clerks. Hartford-West Hartford-East Hartford, Conn., was a significant employer of insurance underwriters and actuaries, while Nashville-Davidson–Murfreesboro–Franklin, Tenn., had among the highest employment of agents and business managers of artists, performers, and athletes; and musicians and singers. The areas with the highest employment of anthropologists and archeologists included Albuquerque, N.M.; Tucson, Ariz.; Honolulu, Hawaii; and Santa Fe, N.M.
Complete Occupational Employment Statistics data for May 2009 are available from the OES home page. This highlight was prepared by Audrey Watson. For more information, please contact the OES program.
Last Modified Date: March 30, 2018