Current annual BLS labor productivity data for retail industries use a real sectoral output approach to measure changes in output per hour worked, or labor productivity.[1] Real sectoral output is measured as total sales revenue[2] deflated by the prices of products sold outside the industry. Retail sales prices[3] reflect the entire value chain of the product sold from product design to delivery to the final consumer.
Retail output can be considered as a service rather than the quantity of products it delivers to consumers. Gross margin output[4] is measured as the difference of total sales less the cost of goods sold and reflects the services provided by retail establishments that help facilitate the sale of goods to the public. Margin prices[5], calculated as the difference between the sales price and the acquisition price, reflect the value added by retailers for services such as the procurement, storage, marketing, and display of goods for sale. Gross margin output isolates the services that retailers provide to consumers by excluding the quantity of goods flowing through retail establishments. The Monthly Labor Review article, "Sales versus margins: alternative measures of output and productivity for retail trade," provides additional information.
This page compares trends in real sectoral output and estimates of real gross margins and their corresponding labor productivity[6] measures for three retail industries that touch our day-to-day lives: gasoline stations, grocery stores, and clothing stores.
About our measures:
- Annual Data on Labor Productivity and Related Measures
- Analysis
- Background
- Inquiries and Feedback
- BLS welcomes feedback and suggestions for these experimental retail measures. Feel free to contact us to share your thoughts.
Gasoline stations
Perhaps no other retail industry can best offer itself as a case study for productivity analysis than gasoline stations. Almost all sales distill down to two products – unleaded fuel and diesel. These two highly homogenous goods have remained relatively constant over time and across establishments. Gasoline stations saw major breakthroughs in automation with self-service in the 1980s and pay-at-the pump in the early 2000s.[8]
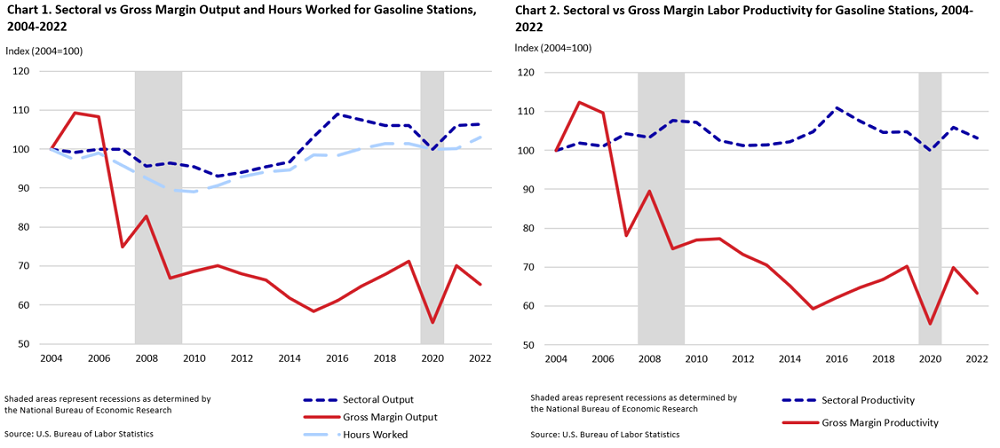
Charts 1 and 2 highlight recent trends in real output, hours worked, and labor productivity for gasoline stations. Since 2004, hours worked barely budged, increasing +0.2 percent per year[9] from 2004 through 2022. We note a wide divergence in real sectoral output (increasing +0.3 percent per year) versus real gross margin output (decreasing -2.3 percent per year), leading to a similar divergence in sectoral versus gross margin labor productivity.

Charts 1 and 2 data. Indexes of sectoral and gross margin output, hours worked, and labor productivity in gasoline stations (2004=100), 2004-2022
Charts 1 and 2 data. Indexes of sectoral and gross margin output, hours worked, and labor productivity in gasoline stations (2004=100), 2004-2022Year | Sectoral Output | Gross Margin Output | Hours Worked | Gross Margin Productivity | Sectoral Productivity |
|---|
2004 | 100.000 | 100.000 | 100.000 | 100.000 | 100.000 |
|---|
2005 | 99.103 | 109.332 | 97.293 | 112.373 | 101.860 |
|---|
2006 | 99.960 | 108.353 | 98.906 | 109.552 | 101.066 |
|---|
2007 | 99.877 | 74.819 | 95.735 | 78.153 | 104.328 |
|---|
2008 | 95.590 | 82.720 | 92.490 | 89.438 | 103.352 |
|---|
2009 | 96.396 | 66.886 | 89.491 | 74.740 | 107.716 |
|---|
2010 | 95.458 | 68.593 | 89.097 | 76.986 | 107.140 |
|---|
2011 | 93.022 | 70.136 | 90.686 | 77.339 | 102.576 |
|---|
2012 | 93.949 | 67.975 | 92.831 | 73.225 | 101.205 |
|---|
2013 | 95.467 | 66.440 | 94.191 | 70.538 | 101.355 |
|---|
2014 | 96.712 | 61.654 | 94.605 | 65.170 | 102.227 |
|---|
2015 | 103.143 | 58.335 | 98.426 | 59.268 | 104.793 |
|---|
2016 | 108.969 | 61.079 | 98.314 | 62.126 | 110.838 |
|---|
2017 | 107.571 | 64.786 | 100.094 | 64.725 | 107.470 |
|---|
2018 | 106.084 | 67.751 | 101.395 | 66.819 | 104.624 |
|---|
2019 | 106.105 | 71.172 | 101.330 | 70.238 | 104.713 |
|---|
2020 | 99.941 | 55.405 | 100.027 | 55.390 | 99.914 |
|---|
2021 | 106.105 | 70.048 | 100.134 | 69.955 | 105.964 |
|---|
2022 | 106.324 | 65.211 | 102.993 | 63.317 | 103.235 |
|---|
Grocery stores
On the other side of the spectrum from gasoline stations, grocery stores sell a huge variety of products and use fluctuating business models that can vary widely across establishments. Grocery stores have been expanding their spaces, products, and services by adding in-store pharmacies, ready-to-go meals and snacks, and more general and diversified merchandise.[10]
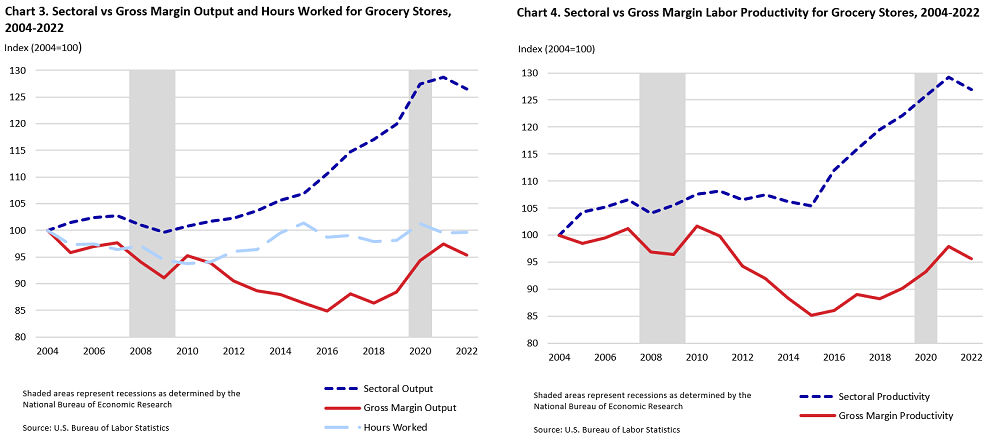
Since 2004, hours worked for grocery stores have remained flat (0.0 percent per year). As depicted in charts 3 and 4, real sectoral output has been steadily increasing (+1.3 percent per year) whereas gross margin output is slowly declining (-0.3 percent per year), resulting in the divergence of trends between sectoral versus gross margin labor productivity.

Charts 3 and 4 data. Indexes of sectoral and gross margin output, hours worked, and labor productivity in grocery stores (2004=100), 2004-2022
Charts 3 and 4 data. Indexes of sectoral and gross margin output, hours worked, and labor productivity in grocery stores (2004=100), 2004-2022Year | Sectoral Output | Gross Margin Output | Hours Worked | Gross Margin Productivity | Sectoral Productivity |
|---|
2004 | 100.000 | 100.000 | 100.000 | 100.000 | 100.000 |
|---|
2005 | 101.477 | 95.858 | 97.364 | 98.453 | 104.223 |
|---|
2006 | 102.412 | 96.937 | 97.400 | 99.523 | 105.145 |
|---|
2007 | 102.748 | 97.625 | 96.456 | 101.212 | 106.523 |
|---|
2008 | 101.063 | 94.090 | 97.138 | 96.862 | 104.040 |
|---|
2009 | 99.637 | 91.060 | 94.399 | 96.462 | 105.549 |
|---|
2010 | 100.828 | 95.263 | 93.728 | 101.637 | 107.574 |
|---|
2011 | 101.669 | 93.895 | 94.049 | 99.835 | 108.103 |
|---|
2012 | 102.300 | 90.494 | 96.035 | 94.230 | 106.525 |
|---|
2013 | 103.648 | 88.665 | 96.404 | 91.972 | 107.514 |
|---|
2014 | 105.646 | 87.932 | 99.486 | 88.386 | 106.191 |
|---|
2015 | 106.862 | 86.408 | 101.390 | 85.222 | 105.395 |
|---|
2016 | 110.536 | 84.876 | 98.656 | 86.032 | 112.041 |
|---|
2017 | 114.782 | 88.124 | 99.035 | 88.982 | 115.899 |
|---|
2018 | 117.019 | 86.407 | 97.890 | 88.269 | 119.542 |
|---|
2019 | 119.878 | 88.462 | 98.115 | 90.160 | 122.180 |
|---|
2020 | 127.388 | 94.376 | 101.228 | 93.230 | 125.842 |
|---|
2021 | 128.670 | 97.436 | 99.544 | 97.881 | 129.259 |
|---|
2022 | 126.544 | 95.354 | 99.673 | 95.666 | 126.959 |
|---|
Clothing stores
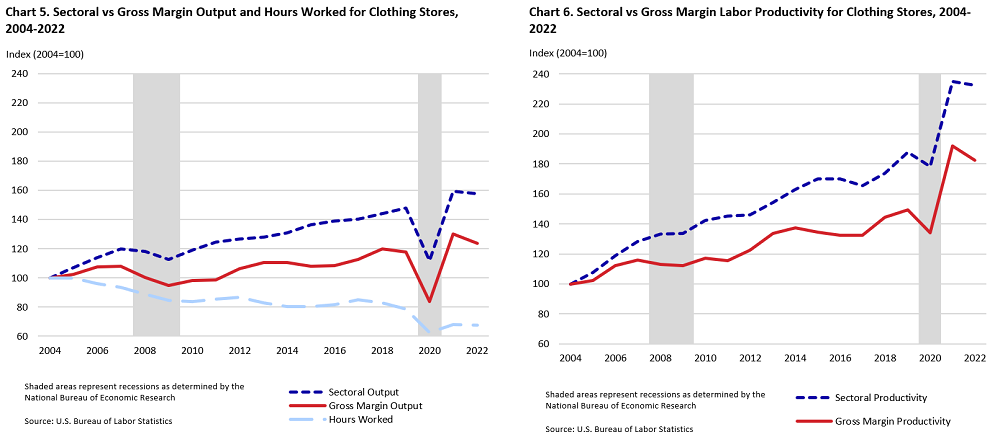
As illustrated in charts 5 and 6, trends in sectoral versus gross margin output and labor productivity have tracked more closely for clothing stores. Since 2004, hours worked declined by -2.1 percent per year while both measures of output have been rising, with sectoral (+2.6 percent per year) outpacing gross margin (+1.2 percent per year). Both sectoral and gross margin measures of labor productivity are increasing.

Charts 5 and 6 data. Indexes of sectoral and gross margin output, hours worked, and labor productivity in clothing stores (2004=100), 2004-2022
Charts 5 and 6 data. Indexes of sectoral and gross margin output, hours worked, and labor productivity in clothing stores (2004=100), 2004-2022Year | Sectoral Output | Gross Margin Output | Hours Worked | Gross Margin Productivity | Sectoral Productivity |
|---|
2004 | 100.000 | 100.000 | 100.000 | 100.000 | 100.000 |
|---|
2005 | 107.302 | 102.267 | 99.777 | 102.496 | 107.541 |
|---|
2006 | 114.035 | 107.554 | 95.972 | 112.068 | 118.820 |
|---|
2007 | 119.865 | 108.122 | 93.304 | 115.881 | 128.466 |
|---|
2008 | 118.307 | 100.333 | 88.727 | 113.080 | 133.337 |
|---|
2009 | 112.833 | 94.687 | 84.407 | 112.178 | 133.675 |
|---|
2010 | 119.022 | 98.126 | 83.610 | 117.361 | 142.353 |
|---|
2011 | 124.383 | 98.762 | 85.542 | 115.454 | 145.404 |
|---|
2012 | 126.561 | 106.301 | 86.696 | 122.613 | 145.981 |
|---|
2013 | 127.828 | 110.696 | 82.850 | 133.609 | 154.287 |
|---|
2014 | 130.974 | 110.339 | 80.338 | 137.344 | 163.028 |
|---|
2015 | 136.337 | 107.904 | 80.152 | 134.623 | 170.096 |
|---|
2016 | 138.961 | 108.277 | 81.675 | 132.570 | 170.139 |
|---|
2017 | 140.339 | 112.556 | 84.867 | 132.626 | 165.363 |
|---|
2018 | 144.103 | 119.803 | 82.999 | 144.342 | 173.620 |
|---|
2019 | 147.979 | 117.708 | 78.771 | 149.431 | 187.859 |
|---|
2020 | 111.730 | 83.918 | 62.586 | 134.085 | 178.521 |
|---|
2021 | 159.598 | 130.245 | 67.881 | 191.870 | 235.112 |
|---|
2022 | 157.647 | 123.555 | 67.757 | 182.350 | 232.664 |
|---|
Last Modified Date: May 21, 2025
 United States Department of Labor


