
An official website of the United States government
 United States Department of Labor
An official website of the United States government
United States Department of Labor

The .gov means it's official.
Federal government websites often end in .gov or .mil. Before sharing sensitive information,
make sure you're on a federal government site.

The site is secure.
The
https:// ensures that you are connecting to the official website and that any
information you provide is encrypted and transmitted securely.


The Local Area Unemployment Statistics (LAUS) program produces monthly and annual employment, unemployment, and labor force data for Census regions and divisions, States, counties, metropolitan areas, and many cities, by place of residence. More »


Alabama
3.4%(p) in Aug 2026

Alaska
4.3%(p) in Aug 2026
Arizona
4.9%(p) in Aug 2026
Arkansas
3.9%(p) in Aug 2026
California
5.1%(p) in Aug 2026
Colorado
4.0%(p) in Aug 2026
Connecticut
5.1%(p) in Aug 2026
Delaware
4.7%(p) in Aug 2026
D.C.
5.7%(p) in Aug 2026
Florida
4.5%(p) in Aug 2026
Georgia
3.2%(p) in Aug 2026
Hawaii
2.7%(p) in Aug 2026
Idaho
3.6%(p) in Aug 2026
Illinois
4.7%(p) in Aug 2026
Indiana
3.3%(p) in Aug 2026
Iowa
3.2%(p) in Aug 2026
Kansas
3.8%(p) in Aug 2026
Kentucky
4.7%(p) in Aug 2026
Louisiana
4.2%(p) in Aug 2026
Maine
3.2%(p) in Aug 2026
Maryland
4.1%(p) in Aug 2026
Massachusetts
4.3%(p) in Aug 2026
Michigan
5.0%(p) in Aug 2026
Minnesota
4.4%(p) in Aug 2026
Mississippi
3.4%(p) in Aug 2026
Missouri
3.5%(p) in Aug 2026
Montana
3.2%(p) in Aug 2026
Nebraska
2.9%(p) in Aug 2026
Nevada
4.8%(p) in Aug 2026
New Hampshire
2.8%(p) in Aug 2026
New Jersey
4.3%(p) in Aug 2026
New Mexico
4.7%(p) in Aug 2026
New York
4.3%(p) in Aug 2026
North Carolina
3.5%(p) in Aug 2026
North Dakota
2.2%(p) in Aug 2026
Ohio
3.3%(p) in Aug 2026
Oklahoma
4.3%(p) in Aug 2026
Oregon
5.1%(p) in Aug 2026
Pennsylvania
3.7%(p) in Aug 2026
Puerto Rico
6.1% in Aug 2026
Rhode Island
3.7%(p) in Aug 2026
South Carolina
4.1%(p) in Aug 2026
South Dakota
2.0%(p) in Aug 2026
Tennessee
3.4%(p) in Aug 2026
Texas
4.4%(p) in Aug 2026
Utah
3.5%(p) in Aug 2026
Vermont
2.6%(p) in Aug 2026
Virginia
3.6%(p) in Aug 2026
Washington
4.9%(p) in Aug 2026
West Virginia
4.0%(p) in Aug 2026
Wisconsin
3.2%(p) in Aug 2026
Wyoming
3.0%(p) in Aug 2026
 Historical Data
 News Release
p - preliminary
News Release
p - preliminary
09/18/2026
In August, unemployment rates were lower in 8 states and the District of Columbia
and stable in 42 states. Nonfarm payroll employment increased in 4 states and was
essentially unchanged in 46 states and the District.
HTML
|
PDF
|
RSS
|
Charts
09/30/2026
Jobless rates were lower in August than a year earlier in 234 of the 387 metropolitan
areas, higher in 126, and unchanged in 27. Nonfarm payroll employment increased over
the year in 9 areas, decreased in 5, and was essentially unchanged in 373.
HTML
|
PDF
|
RSS
|
Charts
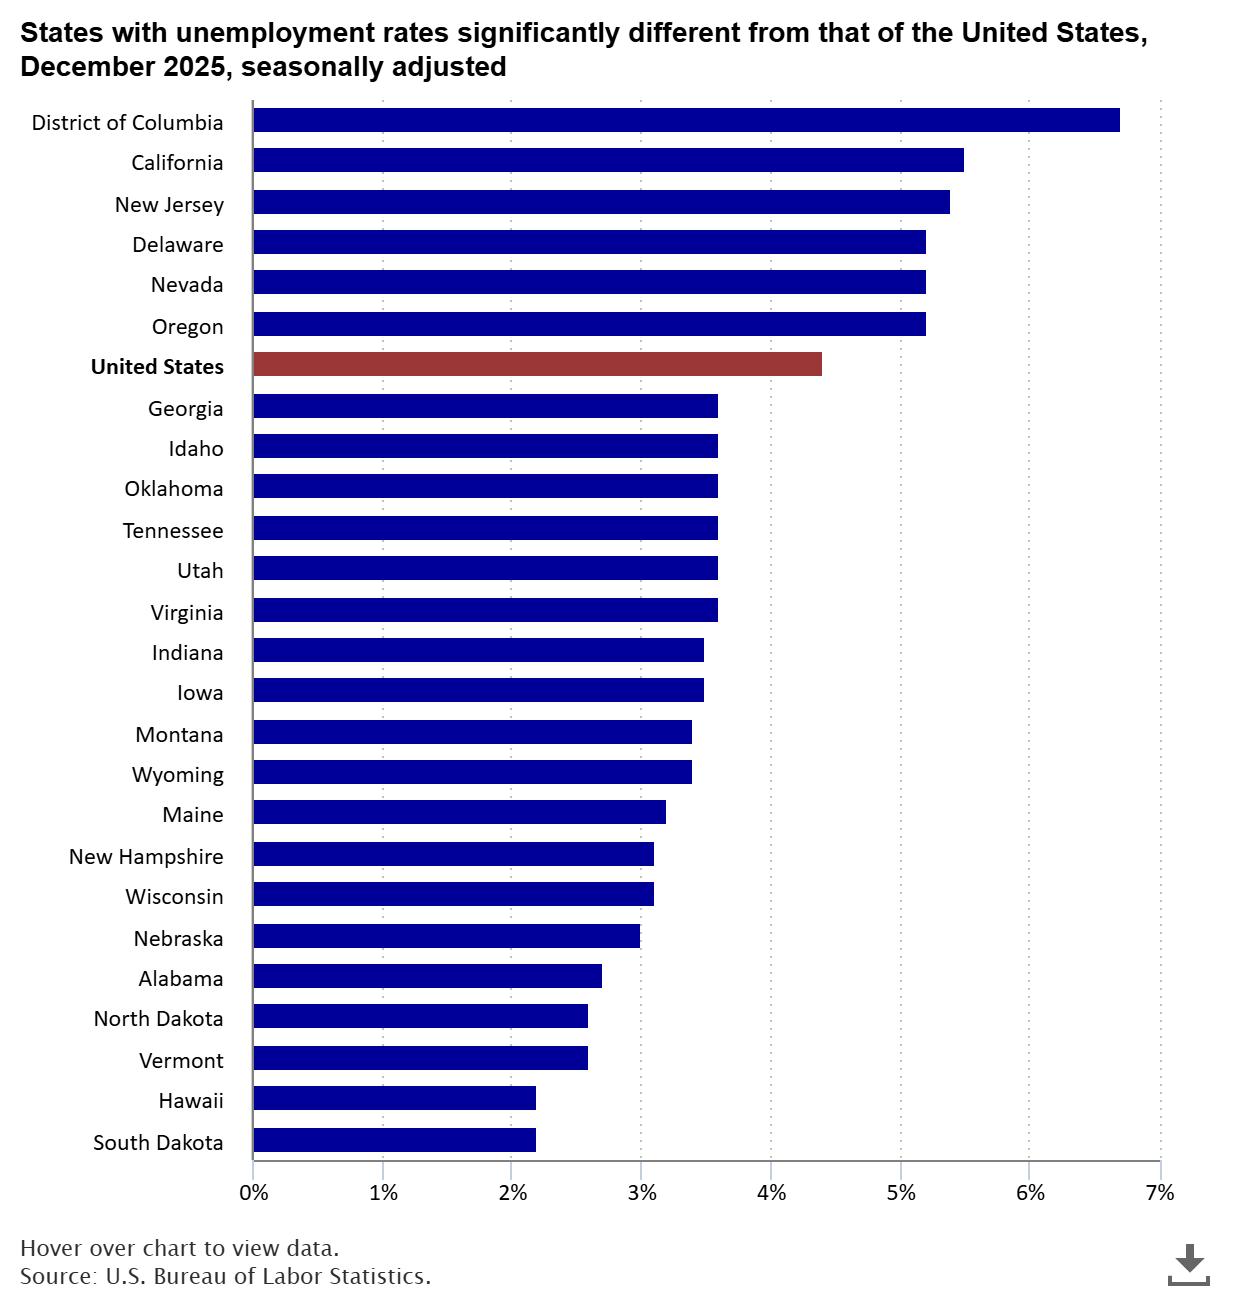
In December 2025, Hawaii and South Dakota had the lowest unemployment rates, 2.2 percent each. North Dakota, Vermont, and Alabama also had unemployment rates below 3.0 percent. The District of Columbia had the highest unemployment rate, 6.7 percent. The next highest rates were in California and New Jersey, 5.5 percent and 5.4 percent, respectively. read more »