
An official website of the United States government
An official website of the United States government
The .gov means it's official.
Federal government websites often end in .gov or .mil. Before sharing sensitive information,
make sure you're on a federal government site.
The site is secure.
The
https:// ensures that you are connecting to the official website and that any
information you provide is encrypted and transmitted securely.
The Consumer Price Index (CPI) is a measure of the average change over time in the prices paid by urban consumers for a market basket of consumer goods and services. Indexes are available for the U.S. and various geographic areas. Average price data for select utility, automotive fuel, and food items are also available.
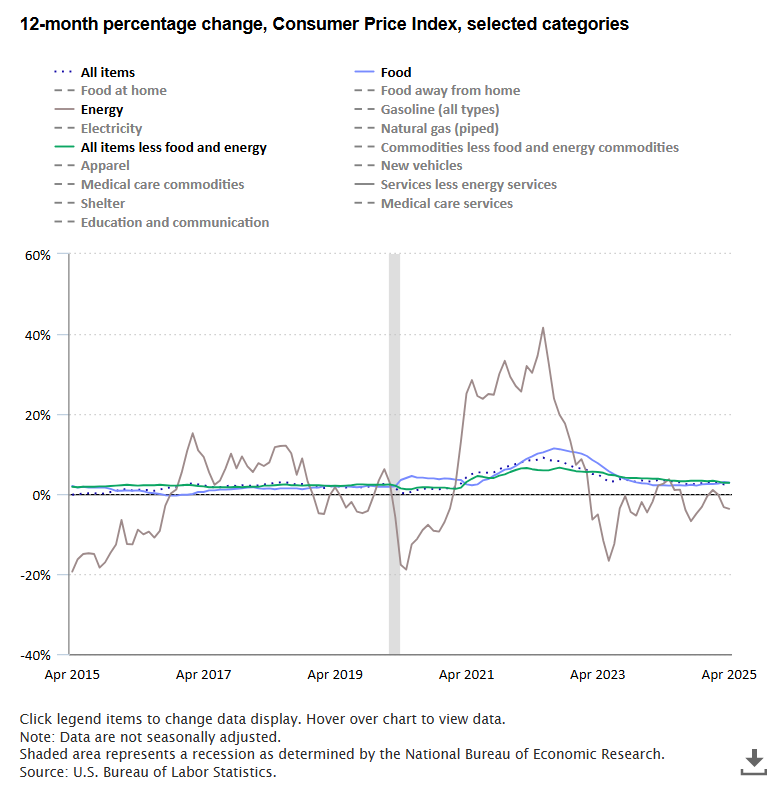
12-month percentage change, Consumer Price Index, selected categories, May 2025, not seasonally adjusted
Category
12-month percent change, May 2025
All items
2.4%
Food
2.9%
Food at home
2.2%
Cereals and bakery products
1.0%
Meats, poultry, fish, and eggs
6.1%
Dairy and related products
1.7%
Fruits and vegetables
-0.5%
Nonalcoholic beverages and beverage materials
3.1%
Other food at home
1.4%
Food away from home
3.8%
Full service meals and snacks
4.2%
Limited service meals and snacks
3.5%
Energy
-3.5%
Energy commodities
-11.6%
Fuel oil
-8.6%
Gasoline (all types)
-12.0%
Energy services
6.8%
Electricity
4.5%
Natural gas (piped)
15.3%
All items less food and energy
2.8%
Commodities less food and energy commodities
0.3%
Apparel
-0.9%
New vehicles
0.4%
Used cars and trucks
1.8%
Medical care commodities
0.3%
Alcoholic beverages
1.5%
Tobacco and smoking products
6.3%
Services less energy services
3.6%
Shelter
3.9%
Rent of primary residence
3.8%
Owners' equivalent rent of residences
4.2%
Medical care services
3.0%
Physicians' services
2.9%
Hospital services
3.6%
Transportation services
2.8%
Motor vehicle maintenance and repair
5.1%
Motor vehicle insurance
7.0%
Airline fare
-7.3%
Consumer Price Index (CPI):
+0.1% in May 2025
![]()
![]()
Unemployment Rate:
4.1% in Jun 2025
![]()
![]()
Payroll Employment:
+147,000(p) in Jun 2025
![]()
![]()
Average Hourly Earnings:
+$0.08(p) in Jun 2025
![]()
![]()
Producer Price Index - Final Demand:
+0.1%(p) in May 2025
![]()
![]()
Employment Cost Index (ECI):
+0.9% in 1st Qtr of 2025
![]()
![]()
Productivity:
-1.5%(r) in 1st Qtr of 2025
![]()
![]()
U.S. Import Price Index:
unchanged in May 2025
![]()
![]()
U.S. Export Price Index:
-0.9% in May 2025
![]()
![]()
06/11/2025
In May, the Consumer Price Index for All Urban Consumers rose 0.1 percent, seasonally
adjusted, and rose 2.4 percent over the last 12 months, not seasonally adjusted. The index for all
items less food and energy increased 0.1 percent in May (SA); up 2.8 percent over the year (NSA).
HTML
|
PDF
|
RSS
|
Charts
|
Local and Regional CPI
The Consumer Price Index for All Urban Consumers (CPI-U) increased 2.3 percent for the 12 months ending April 2025, after rising 2.4 percent over the same period in March. The April change was the smallest 12-month increase in the all items index since February 2021. read more »

Data collection rapidly shifted in response to the COVID-19 pandemic. read more »

This Beyond the Numbers article analyzes recent trends in telework data. It presents telework rates for many demographic and worker groups, including sex, age, race, disability status, educational attainment, occupation, and other characteristics. Additionally, it presents data on the number of hours workers teleworked. read more »