An official website of the United States government
An official website of the United States government
The .gov means it's official.
Federal government websites often end in .gov or .mil. Before sharing sensitive information,
make sure you're on a federal government site.
The site is secure.
The
https:// ensures that you are connecting to the official website and that any
information you provide is encrypted and transmitted securely.
The Injuries, Illnesses, and Fatalities (IIF) program produces a wide range of information about workplace injuries and illnesses. These data are collected and reported annually through the Survey of Occupational Injuries and Illnesses (SOII) and the Census of Fatal Occupational Injuries (CFOI).
For information on nonfatal workplace injury and illness, see the most recently published industry data. See the latest industry incidence rates (OSHA recordable case rates), or calculate a firm's incidence rate by using BLS's incidence rate calculator. More information on calculating incidence rates.
Total nonfatal work injury and illness rates, private industry
Year
Total recordable cases
Cases involving days away from work, job restriction, or transfer
Other recordable cases
2020
2.7
1.7
1
2021
2.7
1.7
1.0
2022
2.7
1.7
1.0
2023
2.4
1.5
1.0
2024
2.3
1.4
1.0
Note: Components may not add to totals due to rounding. For more information on case types, please see our Handbook of Methods concepts page: https://www.bls.gov/opub/hom/soii/concepts.htm.
Total recordable cases:
2,488,400 in 2024
![]()
Cases involving days away from work:
888,100 in 2024
![]()
Median days away from work (DAFW):
8 in 2024
![]()
DAFW Cases involving sprains, strains, tears:
568,150 in 2024
![]()
Exterior and musculoskeletal structures of the back:
248,180 in 2024
![]()
DAFW Cases involving falls, slips, trips:
479,480 in 2024
![]()
Total fatal injuries (all sectors):
5,070 in 2024
![]()
Roadway incidents (all sectors):
1,146 in 2024
![]()
Falls, slips, trips (all sectors):
844 in 2024
![]()
Homicides (all sectors):
470 in 2024
![]()
02/19/2026
There were 5,070 fatal work injuries recorded in the United States in 2024, down 4.0 percent from 5,283 in 2023. The fatal work injury rate was 3.3 fatalities per 100,000 full-time equivalent (FTE) workers in 2024, a decrease from a rate of 3.5 in 2023.
HTML
|
PDF
|
RSS
|
Charts
01/22/2026
In 2024, employers reported 2.5 million injury and illness cases in private industry, down 3.1 percent from 2023. The incidence rate of total recordable cases in private industry was 2.3 cases per 100 full-time equivalent workers, down from 2.4 in 2023.
HTML
|
PDF
|
RSS
|
Charts
The Survey of Occupational Injuries and Illnesses data for 2025 are scheduled to be released November 18, 2026, at 10:00 A.M. Eastern Time.
The Census of Fatal Occupational Injuries data for 2025 are scheduled to be released December 16, 2026, at 10:00 A.M. Eastern Time.
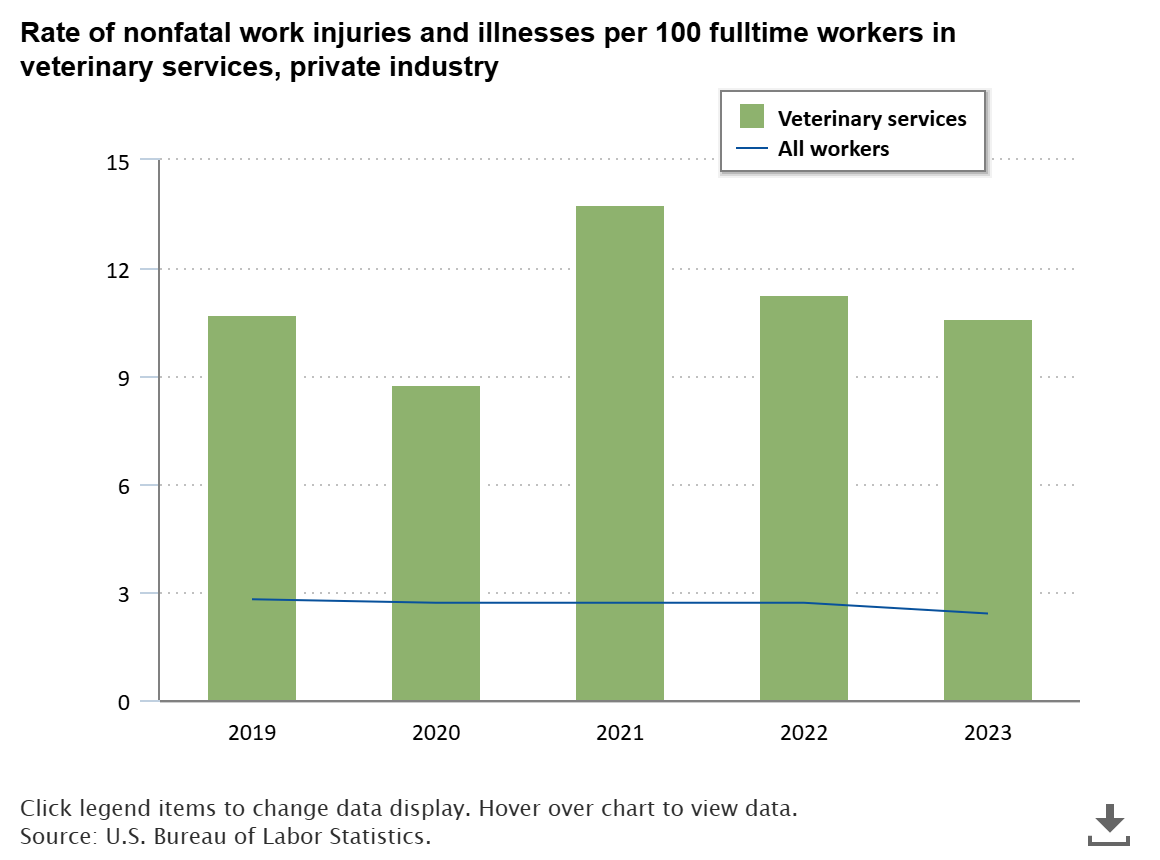
The veterinary services industry had 10.6 nonfatal injuries and illnesses per 100 full-time workers in 2023. The nonfatal injury and illness rate for all workers was 2.4. read more »