
An official website of the United States government
An official website of the United States government
The .gov means it's official.
Federal government websites often end in .gov or .mil. Before sharing sensitive information,
make sure you're on a federal government site.
The site is secure.
The
https:// ensures that you are connecting to the official website and that any
information you provide is encrypted and transmitted securely.
This major group comprises the following occupations: Agents and Business Managers of Artists, Performers, and Athletes ; Buyers and Purchasing Agents ; Claims Adjusters, Examiners, and Investigators ; Insurance Appraisers, Auto Damage ; Compliance Officers ; Cost Estimators ; Human Resources Specialists ; Farm Labor Contractors ; Labor Relations Specialists ; Logisticians ; Management Analysts ; Meeting, Convention, and Event Planners ; Fundraisers ; Compensation, Benefits, and Job Analysis Specialists ; Training and Development Specialists ; Market Research Analysts and Marketing Specialists ; Business Operations Specialists, All Other ; Accountants and Auditors ; Appraisers and Assessors of Real Estate ; Budget Analysts ; Credit Analysts ; Financial Analysts ; Personal Financial Advisors ; Insurance Underwriters ; Financial Examiners ; Credit Counselors ; Loan Officers ; Tax Examiners and Collectors, and Revenue Agents ; Tax Preparers ; Financial Specialists, All Other
Employment estimate and mean wage estimates for this major group:
| Employment (1) | Employment RSE (3) |
Mean hourly wage |
Mean annual wage (2) |
Wage RSE (3) |
|---|---|---|---|---|
| 7,472,750 | 0.2 % | $36.70 | $76,330 | 0.2 % |
Percentile wage estimates for this major group:
| Percentile | 10% | 25% | 50% (Median) |
75% | 90% |
|---|---|---|---|---|---|
| Hourly Wage | $18.12 | $24.25 | $32.55 | $44.22 | $59.13 |
| Annual Wage (2) | $37,690 | $50,450 | $67,710 | $91,970 | $123,000 |
Industries with the highest published employment and wages for this occupation are provided. For a list of all industries with employment in this occupation, see the Create Customized Tables function.
Industries with the highest levels of employment in this occupation:
| Industry | Employment (1) | Percent of industry employment | Hourly mean wage | Annual mean wage (2) |
|---|---|---|---|---|
| Management of Companies and Enterprises | 524,530 | 22.55 | $38.29 | $79,650 |
| Federal Executive Branch (OES Designation) | 509,120 | 25.14 | $40.74 | $84,750 |
| Accounting, Tax Preparation, Bookkeeping, and Payroll Services | 445,110 | 47.54 | $37.54 | $78,090 |
| Management, Scientific, and Technical Consulting Services | 410,370 | 29.98 | $41.93 | $87,200 |
| Credit Intermediation and Related Activities (5221 And 5223 only) | 405,170 | 20.36 | $38.47 | $80,020 |
Industries with the highest concentration of employment in this occupation:
| Industry | Employment (1) | Percent of industry employment | Hourly mean wage | Annual mean wage (2) |
|---|---|---|---|---|
| Accounting, Tax Preparation, Bookkeeping, and Payroll Services | 445,110 | 47.54 | $37.54 | $78,090 |
| Agents and Managers for Artists, Athletes, Entertainers, and Other Public Figures | 13,090 | 46.05 | $44.07 | $91,660 |
| Insurance and Employee Benefit Funds | 1,600 | 36.19 | $37.09 | $77,140 |
| Securities, Commodity Contracts, and Other Financial Investments and Related Activities | 321,670 | 35.11 | $57.38 | $119,340 |
| Monetary Authorities-Central Bank | 5,780 | 32.07 | $45.12 | $93,840 |
Top paying industries for this occupation:
| Industry | Employment (1) | Percent of industry employment | Hourly mean wage | Annual mean wage (2) |
|---|---|---|---|---|
| Securities, Commodity Contracts, and Other Financial Investments and Related Activities | 321,670 | 35.11 | $57.38 | $119,340 |
| Other Investment Pools and Funds | 2,260 | 31.63 | $46.21 | $96,120 |
| Pipeline Transportation of Crude Oil | 1,380 | 11.41 | $45.92 | $95,510 |
| Monetary Authorities-Central Bank | 5,780 | 32.07 | $45.12 | $93,840 |
| Software Publishers | 46,120 | 12.56 | $45.04 | $93,680 |
States and areas with the highest published employment, location quotients, and wages for this occupation are provided. For a list of all areas with employment in this occupation, see the Create Customized Tables function.
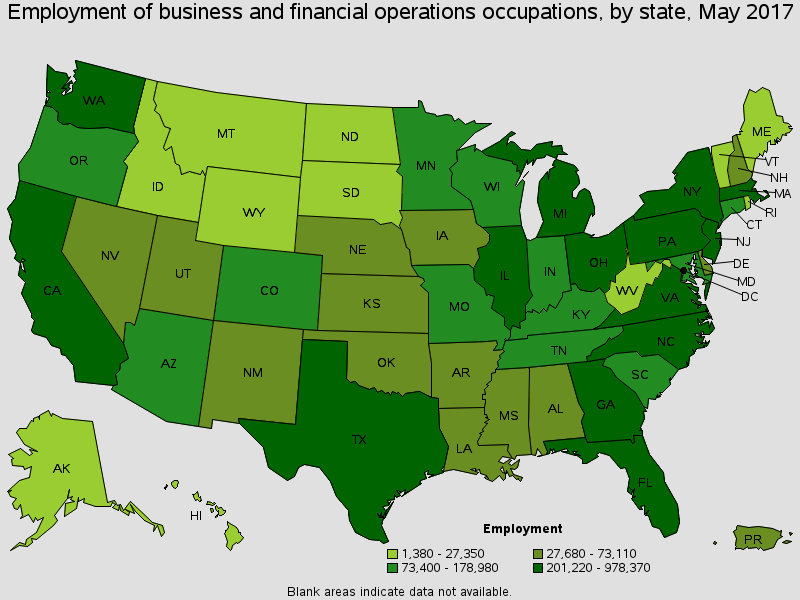
States with the highest employment level in this occupation:
| State | Employment (1) | Employment per thousand jobs | Location quotient (9) | Hourly mean wage | Annual mean wage (2) |
|---|---|---|---|---|---|
| California | 978,370 | 58.60 | 1.12 | $40.14 | $83,500 |
| Texas | 575,030 | 48.36 | 0.92 | $37.61 | $78,240 |
| New York | 543,880 | 59.07 | 1.13 | $45.52 | $94,680 |
| Florida | 445,980 | 52.97 | 1.01 | $32.98 | $68,610 |
| Illinois | 328,610 | 55.44 | 1.06 | $35.83 | $74,530 |
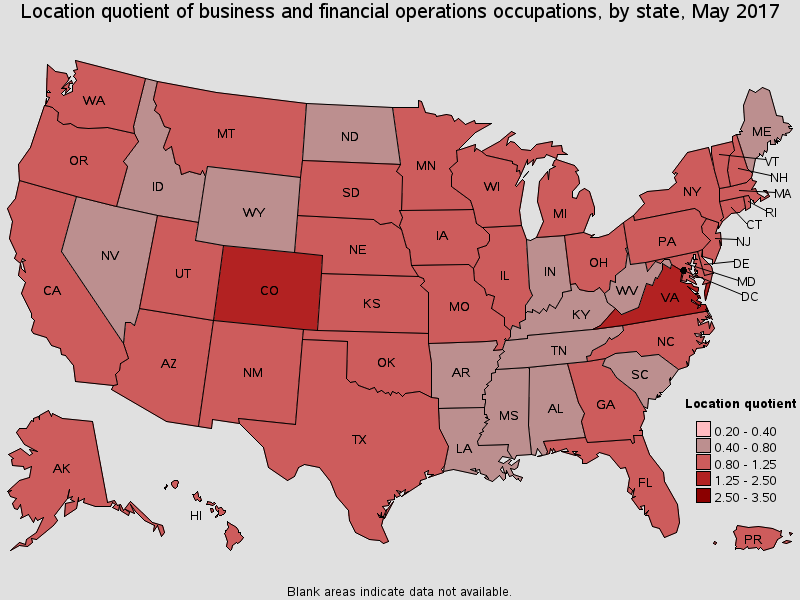
States with the highest concentration of jobs and location quotients in this occupation:
| State | Employment (1) | Employment per thousand jobs | Location quotient (9) | Hourly mean wage | Annual mean wage (2) |
|---|---|---|---|---|---|
| District of Columbia | 104,090 | 146.97 | 2.80 | $46.70 | $97,130 |
| Colorado | 178,980 | 70.04 | 1.34 | $37.16 | $77,290 |
| Virginia | 265,210 | 69.98 | 1.33 | $40.47 | $84,180 |
| Washington | 203,780 | 63.95 | 1.22 | $38.03 | $79,090 |
| Delaware | 27,680 | 62.52 | 1.19 | $37.28 | $77,540 |
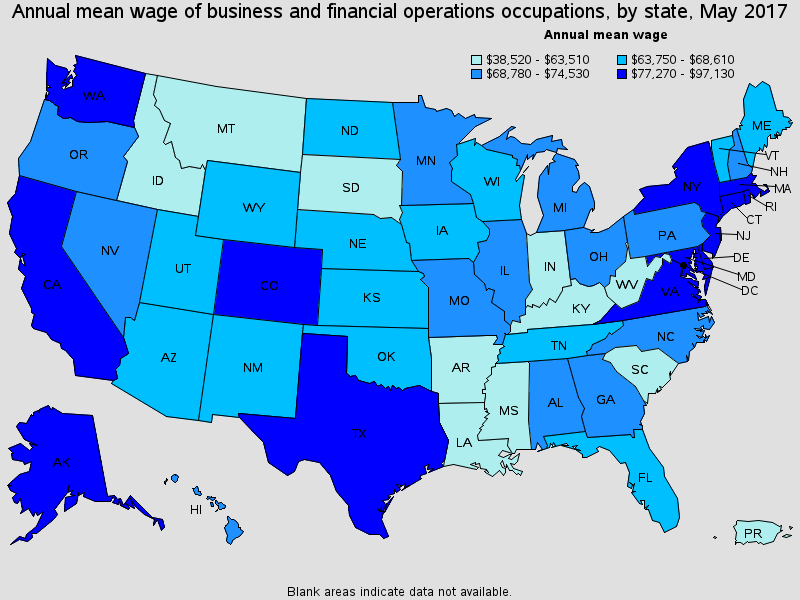
Top paying States for this occupation:
| State | Employment (1) | Employment per thousand jobs | Location quotient (9) | Hourly mean wage | Annual mean wage (2) |
|---|---|---|---|---|---|
| District of Columbia | 104,090 | 146.97 | 2.80 | $46.70 | $97,130 |
| New York | 543,880 | 59.07 | 1.13 | $45.52 | $94,680 |
| New Jersey | 233,820 | 58.34 | 1.11 | $40.84 | $84,950 |
| Massachusetts | 201,220 | 57.04 | 1.09 | $40.55 | $84,340 |
| Connecticut | 90,370 | 54.63 | 1.04 | $40.53 | $84,300 |
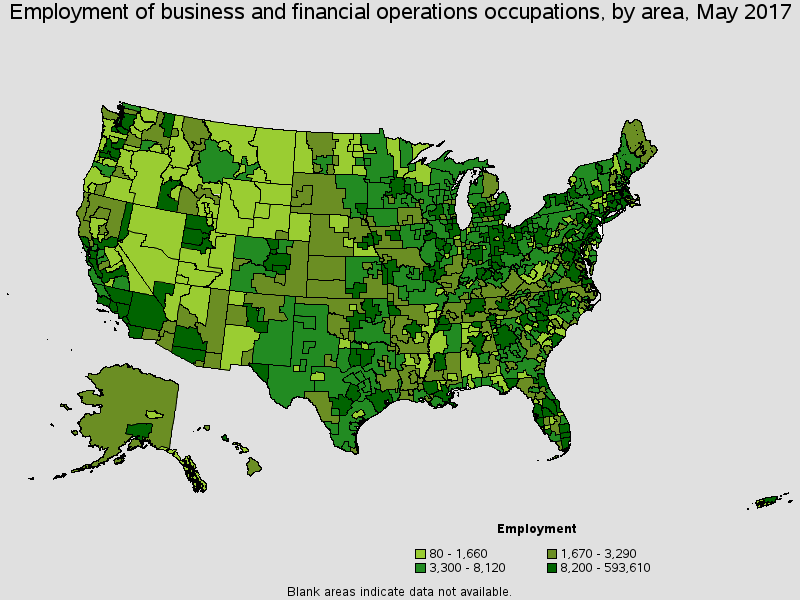
Metropolitan areas with the highest employment level in this occupation:
| Metropolitan area | Employment (1) | Employment per thousand jobs | Location quotient (9) | Hourly mean wage | Annual mean wage (2) |
|---|---|---|---|---|---|
| New York-Jersey City-White Plains, NY-NJ Metropolitan Division | 457,470 | 68.34 | 1.30 | $48.43 | $100,730 |
| Washington-Arlington-Alexandria, DC-VA-MD-WV Metropolitan Division | 258,250 | 102.51 | 1.96 | $45.48 | $94,590 |
| Los Angeles-Long Beach-Glendale, CA Metropolitan Division | 253,570 | 57.23 | 1.09 | $38.99 | $81,090 |
| Chicago-Naperville-Arlington Heights, IL Metropolitan Division | 224,220 | 61.22 | 1.17 | $36.72 | $76,370 |
| Atlanta-Sandy Springs-Roswell, GA | 171,160 | 65.34 | 1.25 | $36.12 | $75,130 |
| Dallas-Plano-Irving, TX Metropolitan Division | 155,730 | 62.50 | 1.19 | $39.12 | $81,360 |
| Houston-The Woodlands-Sugar Land, TX | 152,260 | 51.98 | 0.99 | $41.32 | $85,950 |
| Seattle-Bellevue-Everett, WA Metropolitan Division | 135,080 | 82.00 | 1.56 | $40.62 | $84,480 |
| Boston-Cambridge-Newton, MA NECTA Division | 133,800 | 72.73 | 1.39 | $42.49 | $88,380 |
| Minneapolis-St. Paul-Bloomington, MN-WI | 131,100 | 67.85 | 1.29 | $35.97 | $74,820 |
Metropolitan areas with the highest concentration of jobs and location quotients in this occupation:
| Metropolitan area | Employment (1) | Employment per thousand jobs | Location quotient (9) | Hourly mean wage | Annual mean wage (2) |
|---|---|---|---|---|---|
| California-Lexington Park, MD | 5,450 | 119.87 | 2.29 | $47.20 | $98,180 |
| Washington-Arlington-Alexandria, DC-VA-MD-WV Metropolitan Division | 258,250 | 102.51 | 1.96 | $45.48 | $94,590 |
| Bloomington, IL | 8,910 | 100.13 | 1.91 | $34.49 | $71,730 |
| Tallahassee, FL | 16,770 | 99.43 | 1.90 | $25.25 | $52,530 |
| Trenton, NJ | 22,710 | 98.99 | 1.89 | $39.04 | $81,200 |
| San Francisco-Redwood City-South San Francisco, CA Metropolitan Division | 108,740 | 97.40 | 1.86 | $48.84 | $101,590 |
| Warner Robins, GA | 6,570 | 94.45 | 1.80 | $35.51 | $73,870 |
| Springfield, IL | 9,620 | 90.14 | 1.72 | $32.10 | $66,760 |
| Denver-Aurora-Lakewood, CO | 120,260 | 83.33 | 1.59 | $38.05 | $79,150 |
| Seattle-Bellevue-Everett, WA Metropolitan Division | 135,080 | 82.00 | 1.56 | $40.62 | $84,480 |
Top paying metropolitan areas for this occupation:
| Metropolitan area | Employment (1) | Employment per thousand jobs | Location quotient (9) | Hourly mean wage | Annual mean wage (2) |
|---|---|---|---|---|---|
| San Francisco-Redwood City-South San Francisco, CA Metropolitan Division | 108,740 | 97.40 | 1.86 | $48.84 | $101,590 |
| New York-Jersey City-White Plains, NY-NJ Metropolitan Division | 457,470 | 68.34 | 1.30 | $48.43 | $100,730 |
| San Jose-Sunnyvale-Santa Clara, CA | 79,880 | 73.35 | 1.40 | $48.23 | $100,310 |
| California-Lexington Park, MD | 5,450 | 119.87 | 2.29 | $47.20 | $98,180 |
| San Rafael, CA Metropolitan Division | 7,200 | 62.69 | 1.20 | $46.61 | $96,950 |
| Bridgeport-Stamford-Norwalk, CT | 29,190 | 70.22 | 1.34 | $46.49 | $96,700 |
| Washington-Arlington-Alexandria, DC-VA-MD-WV Metropolitan Division | 258,250 | 102.51 | 1.96 | $45.48 | $94,590 |
| Oakland-Hayward-Berkeley, CA Metropolitan Division | 69,560 | 61.11 | 1.17 | $43.04 | $89,530 |
| Newark, NJ-PA Metropolitan Division | 74,870 | 64.16 | 1.22 | $42.95 | $89,330 |
| Boston-Cambridge-Newton, MA NECTA Division | 133,800 | 72.73 | 1.39 | $42.49 | $88,380 |
Nonmetropolitan areas with the highest employment in this occupation:
| Nonmetropolitan area | Employment (1) | Employment per thousand jobs | Location quotient (9) | Hourly mean wage | Annual mean wage (2) |
|---|---|---|---|---|---|
| West Northwestern Ohio nonmetropolitan area | 8,510 | 33.65 | 0.64 | $30.02 | $62,430 |
| North Northeastern Ohio non-metropolitan area (non-contiguous) | 8,320 | 25.08 | 0.48 | $28.24 | $58,740 |
| Balance of Lower Peninsula of Michigan nonmetropolitan area | 7,860 | 28.26 | 0.54 | $29.57 | $61,500 |
| Northeastern Wisconsin nonmetropolitan area | 7,560 | 37.54 | 0.72 | $26.77 | $55,670 |
| Central Kentucky nonmetropolitan area | 7,290 | 41.00 | 0.78 | $26.59 | $55,300 |
Nonmetropolitan areas with the highest concentration of jobs and location quotients in this occupation:
| Nonmetropolitan area | Employment (1) | Employment per thousand jobs | Location quotient (9) | Hourly mean wage | Annual mean wage (2) |
|---|---|---|---|---|---|
| Los Alamos County, New Mexico nonmetropolitan area | 1,420 | 88.28 | 1.68 | $46.12 | $95,920 |
| Northern Vermont nonmetropolitan area | 3,990 | 57.20 | 1.09 | $30.27 | $62,950 |
| Southwest Montana nonmetropolitan area | 7,220 | 53.45 | 1.02 | $30.05 | $62,500 |
| Northeast Virginia nonmetropolitan area | 2,590 | 52.27 | 1.00 | $38.22 | $79,490 |
| Central New Hampshire nonmetropolitan area | 4,650 | 47.99 | 0.92 | $32.30 | $67,180 |
Top paying nonmetropolitan areas for this occupation:
| Nonmetropolitan area | Employment (1) | Employment per thousand jobs | Location quotient (9) | Hourly mean wage | Annual mean wage (2) |
|---|---|---|---|---|---|
| Los Alamos County, New Mexico nonmetropolitan area | 1,420 | 88.28 | 1.68 | $46.12 | $95,920 |
| Balance of Alaska nonmetropolitan area | 1,900 | 26.66 | 0.51 | $38.84 | $80,790 |
| Northeast Virginia nonmetropolitan area | 2,590 | 52.27 | 1.00 | $38.22 | $79,490 |
| Southeast Alaska nonmetropolitan area | 1,630 | 46.46 | 0.89 | $37.75 | $78,530 |
| Southwest Wyoming nonmetropolitan area | 1,520 | 25.37 | 0.48 | $37.33 | $77,640 |
These estimates are calculated with data collected from employers in all industry sectors, all metropolitan and nonmetropolitan areas, and all states and the District of Columbia.
The percentile wage estimate is the value of a wage below which a certain percent of workers fall. The median wage is the 50th percentile wage estimate--50 percent of workers earn less than the median and 50 percent of workers earn more than the median. More about percentile wages.
(1) Estimates for detailed occupations do not sum to the totals because the totals include occupations not shown separately. Estimates do not include self-employed workers.
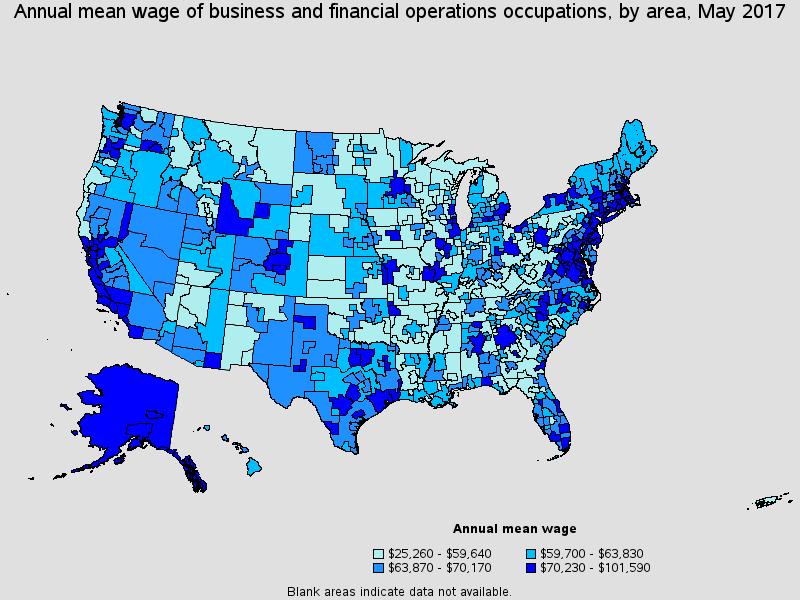
(2) Annual wages have been calculated by multiplying the hourly mean wage by a "year-round, full-time" hours figure of 2,080 hours; for those occupations where there is not an hourly wage published, the annual wage has been directly calculated from the reported survey data.
(3) The relative standard error (RSE) is a measure of the reliability of a survey statistic. The smaller the relative standard error, the more precise the estimate.
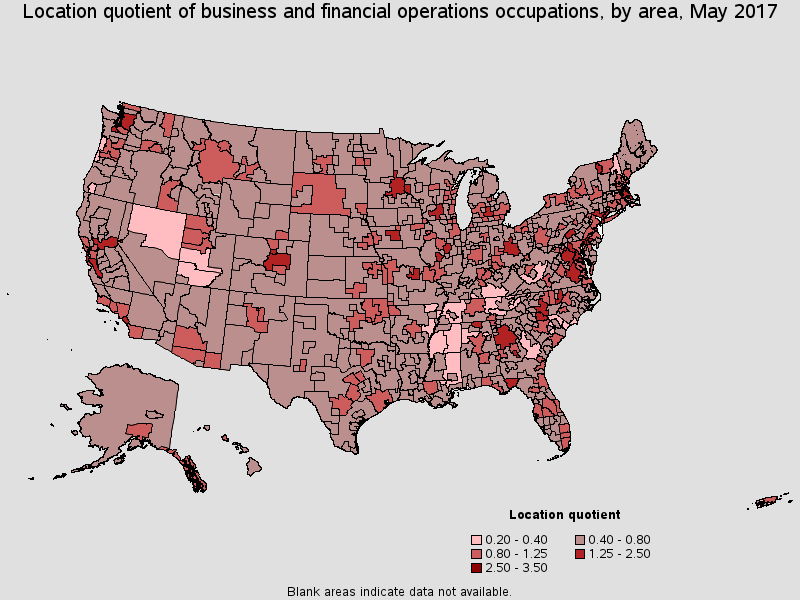
(9) The location quotient is the ratio of the area concentration of occupational employment to the national average concentration. A location quotient greater than one indicates the occupation has a higher share of employment than average, and a location quotient less than one indicates the occupation is less prevalent in the area than average.
Other OES estimates and related information:
May 2017 National Occupational Employment and Wage Estimates
May 2017 State Occupational Employment and Wage Estimates
May 2017 Metropolitan and Nonmetropolitan Area Occupational Employment and Wage Estimates
May 2017 National Industry-Specific Occupational Employment and Wage Estimates
Last Modified Date: March 30, 2018