
An official website of the United States government
An official website of the United States government
The .gov means it's official.
Federal government websites often end in .gov or .mil. Before sharing sensitive information,
make sure you're on a federal government site.
The site is secure.
The
https:// ensures that you are connecting to the official website and that any
information you provide is encrypted and transmitted securely.
This occupation includes the 2018 SOC occupations 25-3041 Tutors and 25-3099 Teachers and Instructors, All Other and the OEWS-specific 2010 SOC occupation 25-3097 Teachers and Instructors, All Other, Except Substitute Teachers.
Employment estimate and mean wage estimates for Tutors and Teachers and Instructors, All Other:
| Employment (1) | Employment RSE (3) |
Mean hourly wage |
Mean annual wage (2) |
Mean wage RSE (3) |
|---|---|---|---|---|
| 309,220 | 1.7 % | (4) | $ 50,390 | 1.4 % |
Percentile wage estimates for Tutors and Teachers and Instructors, All Other:
| Percentile | 10% | 25% | 50% (Median) |
75% | 90% |
|---|---|---|---|---|---|
| Annual Wage (2) | $ 22,110 | $ 28,840 | $ 40,590 | $ 63,170 | $ 91,630 |
Industries with the highest published employment and wages for Tutors and Teachers and Instructors, All Other are provided. For a list of all industries with employment in Tutors and Teachers and Instructors, All Other, see the Create Customized Tables function.
Industries with the highest levels of employment in Tutors and Teachers and Instructors, All Other:
| Industry | Employment (1) | Percent of industry employment | Hourly mean wage | Annual mean wage (2) |
|---|---|---|---|---|
| Elementary and Secondary Schools | 112,480 | 1.36 | (4) | $ 52,430 |
| Other Schools and Instruction | 62,970 | 15.71 | (4) | $ 44,040 |
| Colleges, Universities, and Professional Schools | 24,420 | 0.81 | (4) | $ 39,920 |
| Junior Colleges | 19,220 | 2.82 | (4) | $ 48,040 |
| Educational Support Services | 15,510 | 8.37 | (4) | $ 51,730 |
Industries with the highest concentration of employment in Tutors and Teachers and Instructors, All Other:
| Industry | Employment (1) | Percent of industry employment | Hourly mean wage | Annual mean wage (2) |
|---|---|---|---|---|
| Other Schools and Instruction | 62,970 | 15.71 | (4) | $ 44,040 |
| Educational Support Services | 15,510 | 8.37 | (4) | $ 51,730 |
| Junior Colleges | 19,220 | 2.82 | (4) | $ 48,040 |
| Business Schools and Computer and Management Training | 1,690 | 2.39 | (4) | $ 54,530 |
| Technical and Trade Schools | 2,480 | 1.98 | (4) | $ 57,610 |
Top paying industries for Tutors and Teachers and Instructors, All Other:
| Industry | Employment (1) | Percent of industry employment | Hourly mean wage | Annual mean wage (2) |
|---|---|---|---|---|
| Federal Executive Branch (OEWS Designation) | 15,030 | 0.72 | (4) | $ 84,720 |
| State Government, excluding schools and hospitals (OEWS Designation) | 4,740 | 0.22 | (4) | $ 71,260 |
| Scientific Research and Development Services | 1,530 | 0.20 | (4) | $ 70,820 |
| Performing Arts Companies | 420 | 0.41 | (4) | $ 65,770 |
| Outpatient Care Centers | 400 | 0.04 | (4) | $ 64,800 |
States and areas with the highest published employment, location quotients, and wages for Tutors and Teachers and Instructors, All Other are provided. For a list of all areas with employment in Tutors and Teachers and Instructors, All Other, see the Create Customized Tables function.
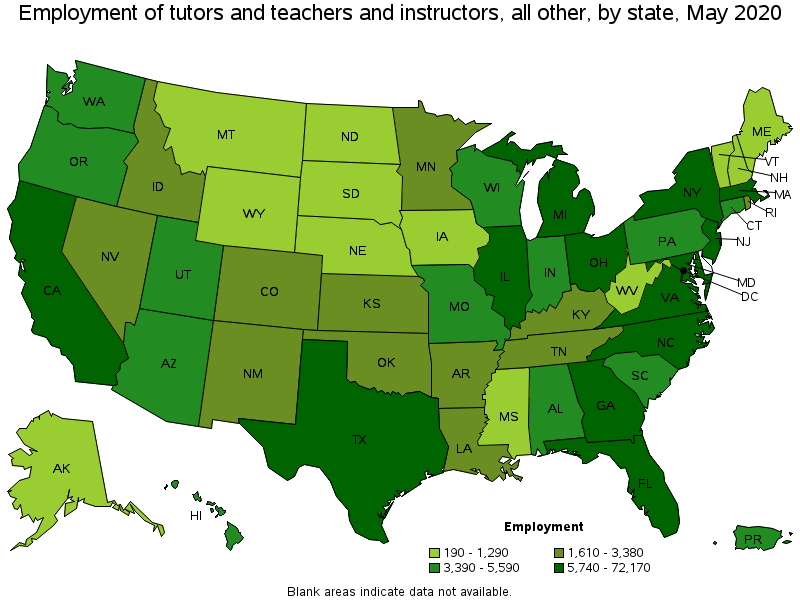
States with the highest employment level in Tutors and Teachers and Instructors, All Other:
| State | Employment (1) | Employment per thousand jobs | Location quotient (9) | Hourly mean wage | Annual mean wage (2) |
|---|---|---|---|---|---|
| California | 72,170 | 4.39 | 1.98 | (4) | $ 56,580 |
| Georgia | 26,260 | 6.10 | 2.74 | (4) | $ 41,010 |
| Florida | 23,110 | 2.74 | 1.23 | (4) | $ 45,450 |
| Texas | 18,870 | 1.56 | 0.70 | (4) | $ 38,570 |
| New York | 18,570 | 2.14 | 0.96 | (4) | $ 65,550 |
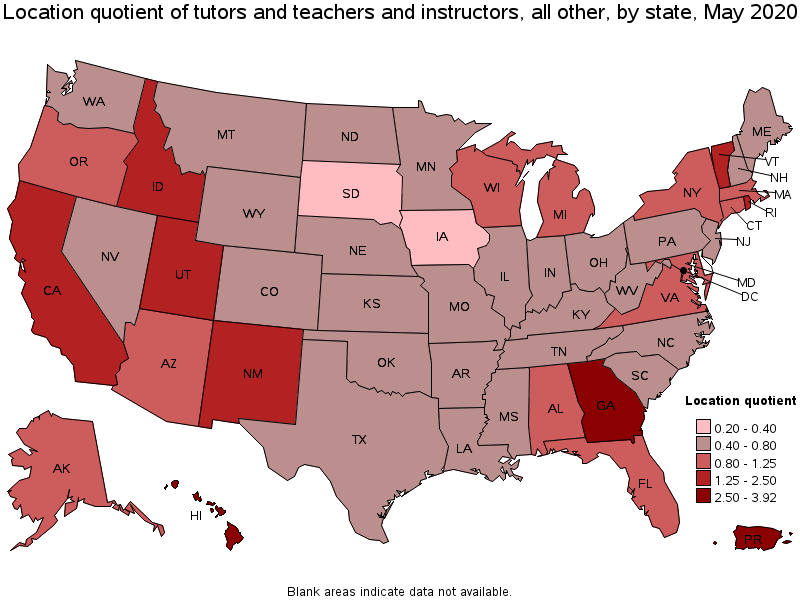
States with the highest concentration of jobs and location quotients in Tutors and Teachers and Instructors, All Other:
| State | Employment (1) | Employment per thousand jobs | Location quotient (9) | Hourly mean wage | Annual mean wage (2) |
|---|---|---|---|---|---|
| Hawaii | 5,000 | 8.72 | 3.92 | (4) | $ 43,480 |
| Georgia | 26,260 | 6.10 | 2.74 | (4) | $ 41,010 |
| Rhode Island | 1,950 | 4.39 | 1.98 | (4) | $ 90,040 |
| California | 72,170 | 4.39 | 1.98 | (4) | $ 56,580 |
| New Mexico | 3,030 | 3.85 | 1.73 | (4) | $ 61,350 |
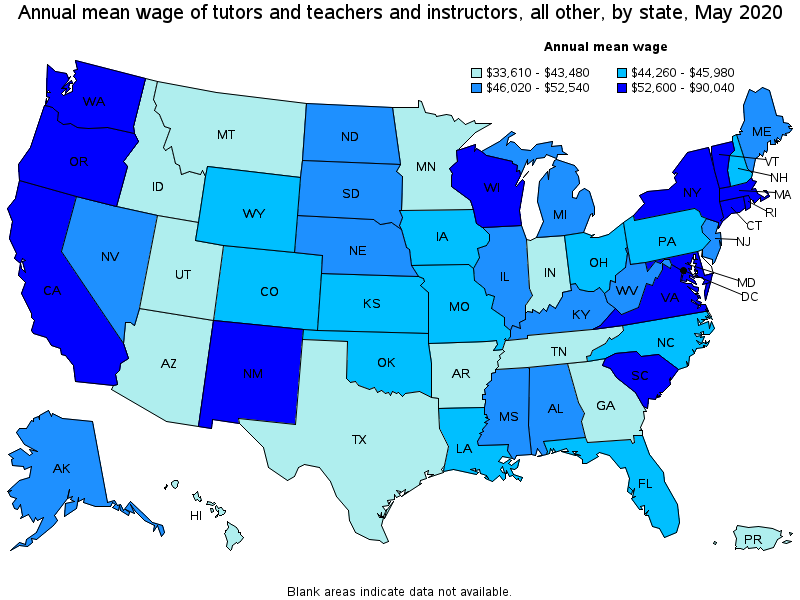
Top paying states for Tutors and Teachers and Instructors, All Other:
| State | Employment (1) | Employment per thousand jobs | Location quotient (9) | Hourly mean wage | Annual mean wage (2) |
|---|---|---|---|---|---|
| Rhode Island | 1,950 | 4.39 | 1.98 | (4) | $ 90,040 |
| District of Columbia | 1,610 | 2.34 | 1.05 | (4) | $ 69,900 |
| Maryland | 5,740 | 2.27 | 1.02 | (4) | $ 65,690 |
| New York | 18,570 | 2.14 | 0.96 | (4) | $ 65,550 |
| New Mexico | 3,030 | 3.85 | 1.73 | (4) | $ 61,350 |
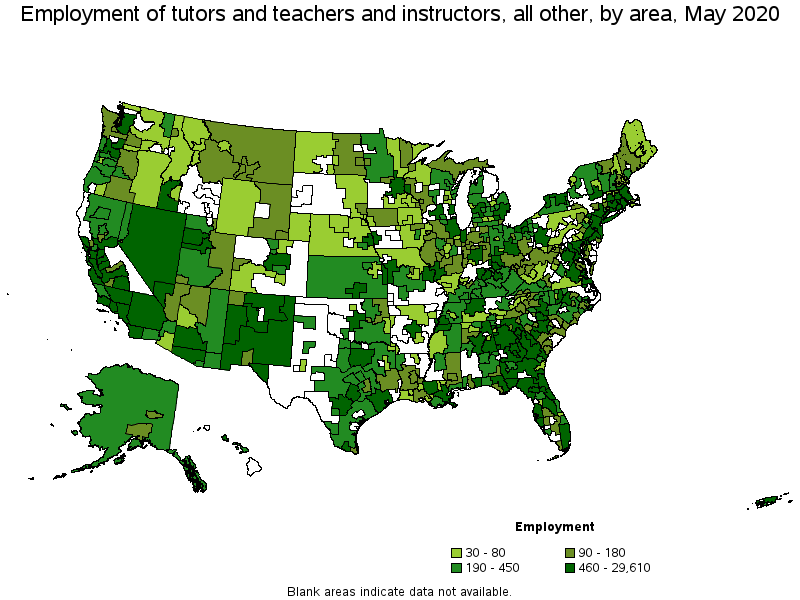
Metropolitan areas with the highest employment level in Tutors and Teachers and Instructors, All Other:
| Metropolitan area | Employment (1) | Employment per thousand jobs | Location quotient (9) | Hourly mean wage | Annual mean wage (2) |
|---|---|---|---|---|---|
| Los Angeles-Long Beach-Anaheim, CA | 29,610 | 5.09 | 2.29 | (4) | $ 51,080 |
| New York-Newark-Jersey City, NY-NJ-PA | 19,530 | 2.21 | 0.99 | (4) | $ 64,610 |
| Atlanta-Sandy Springs-Roswell, GA | 16,050 | 6.09 | 2.74 | (4) | $ 39,810 |
| San Francisco-Oakland-Hayward, CA | 9,400 | 4.03 | 1.81 | (4) | $ 49,980 |
| Washington-Arlington-Alexandria, DC-VA-MD-WV | 7,910 | 2.62 | 1.18 | (4) | $ 58,700 |
| Tampa-St. Petersburg-Clearwater, FL | 6,550 | 5.02 | 2.26 | (4) | $ 39,250 |
| Chicago-Naperville-Elgin, IL-IN-WI | 5,780 | 1.32 | 0.60 | (4) | $ 47,210 |
| San Diego-Carlsbad, CA | 5,340 | 3.81 | 1.72 | (4) | $ 65,490 |
| Miami-Fort Lauderdale-West Palm Beach, FL | 5,170 | 2.06 | 0.93 | (4) | $ 49,550 |
| Dallas-Fort Worth-Arlington, TX | 4,990 | 1.39 | 0.63 | (4) | $ 37,810 |
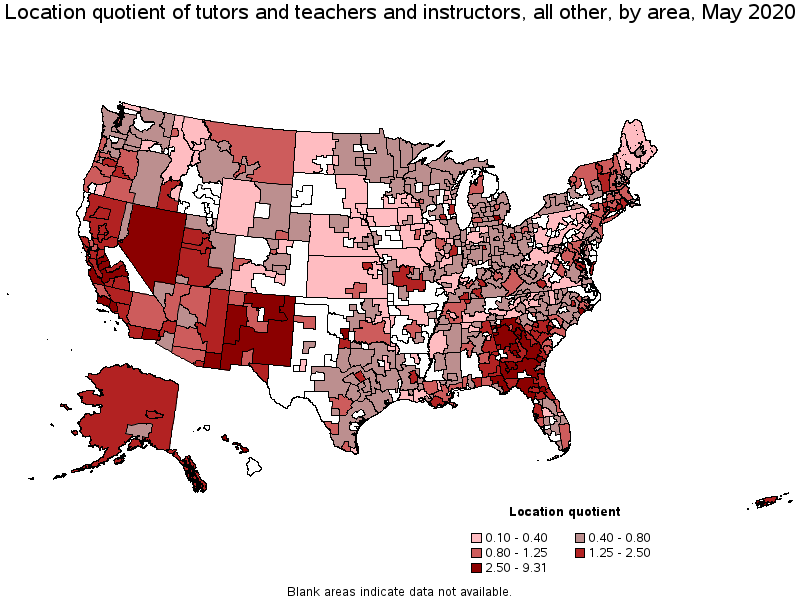
Metropolitan areas with the highest concentration of jobs and location quotients in Tutors and Teachers and Instructors, All Other:
| Metropolitan area | Employment (1) | Employment per thousand jobs | Location quotient (9) | Hourly mean wage | Annual mean wage (2) |
|---|---|---|---|---|---|
| Hinesville, GA | 360 | 20.70 | 9.31 | (4) | $ 55,330 |
| Salinas, CA | 2,760 | 16.08 | 7.23 | (4) | $ 110,600 |
| Warner Robins, GA | 1,150 | 15.76 | 7.09 | (4) | $ 28,580 |
| Modesto, CA | 1,650 | 9.18 | 4.13 | (4) | $ 46,550 |
| Macon, GA | 880 | 9.08 | 4.09 | (4) | $ 28,550 |
| Ann Arbor, MI | 1,890 | 9.06 | 4.08 | (4) | $ 33,480 |
| Lawton, OK | 360 | 8.82 | 3.97 | (8) | (8) |
| Urban Honolulu, HI | 3,630 | 8.75 | 3.94 | (4) | $ 44,260 |
| Merced, CA | 620 | 8.74 | 3.93 | (4) | $ 98,100 |
| Sumter, SC | 310 | 8.52 | 3.83 | (4) | $ 53,990 |
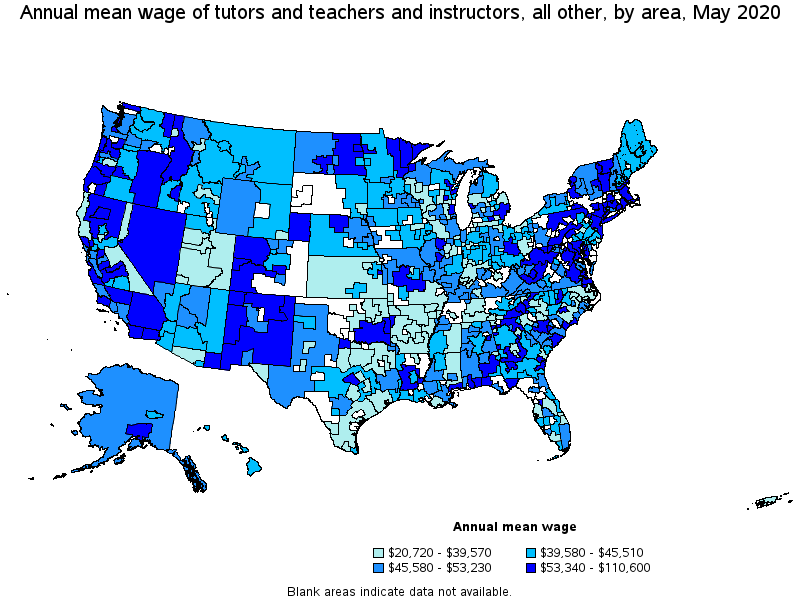
Top paying metropolitan areas for Tutors and Teachers and Instructors, All Other:
| Metropolitan area | Employment (1) | Employment per thousand jobs | Location quotient (9) | Hourly mean wage | Annual mean wage (2) |
|---|---|---|---|---|---|
| Salinas, CA | 2,760 | 16.08 | 7.23 | (4) | $ 110,600 |
| Merced, CA | 620 | 8.74 | 3.93 | (4) | $ 98,100 |
| Fresno, CA | 2,390 | 6.35 | 2.85 | (4) | $ 92,830 |
| Redding, CA | 210 | 3.20 | 1.44 | (4) | $ 91,580 |
| Providence-Warwick, RI-MA | 2,070 | 3.91 | 1.76 | (4) | $ 87,210 |
| Kingston, NY | 100 | 1.89 | 0.85 | (4) | $ 85,580 |
| Bremerton-Silverdale, WA | 170 | 2.02 | 0.91 | (4) | $ 81,100 |
| Sierra Vista-Douglas, AZ | 230 | 7.32 | 3.29 | (4) | $ 76,100 |
| Columbia, SC | 1,730 | 4.63 | 2.08 | (4) | $ 73,700 |
| Watertown-Fort Drum, NY | 80 | 2.27 | 1.02 | (4) | $ 72,550 |
Nonmetropolitan areas with the highest employment in Tutors and Teachers and Instructors, All Other:
| Nonmetropolitan area | Employment (1) | Employment per thousand jobs | Location quotient (9) | Hourly mean wage | Annual mean wage (2) |
|---|---|---|---|---|---|
| South Georgia nonmetropolitan area | 1,550 | 8.38 | 3.77 | (4) | $ 39,910 |
| Eastern New Mexico nonmetropolitan area | 1,080 | 6.91 | 3.11 | (4) | $ 57,640 |
| North Georgia nonmetropolitan area | 1,050 | 6.37 | 2.87 | (4) | $ 60,250 |
| East Georgia nonmetropolitan area | 860 | 10.27 | 4.62 | (4) | $ 43,910 |
| North Florida nonmetropolitan area | 840 | 7.08 | 3.19 | (8) | (8) |
Nonmetropolitan areas with the highest concentration of jobs and location quotients in Tutors and Teachers and Instructors, All Other:
| Nonmetropolitan area | Employment (1) | Employment per thousand jobs | Location quotient (9) | Hourly mean wage | Annual mean wage (2) |
|---|---|---|---|---|---|
| East Georgia nonmetropolitan area | 860 | 10.27 | 4.62 | (4) | $ 43,910 |
| South Georgia nonmetropolitan area | 1,550 | 8.38 | 3.77 | (4) | $ 39,910 |
| Nevada nonmetropolitan area | 730 | 7.89 | 3.55 | (4) | $ 62,220 |
| Northern New Mexico nonmetropolitan area | 600 | 7.66 | 3.44 | (4) | $ 58,070 |
| North Florida nonmetropolitan area | 840 | 7.08 | 3.19 | (8) | (8) |
Top paying nonmetropolitan areas for Tutors and Teachers and Instructors, All Other:
| Nonmetropolitan area | Employment (1) | Employment per thousand jobs | Location quotient (9) | Hourly mean wage | Annual mean wage (2) |
|---|---|---|---|---|---|
| Southern Pennsylvania nonmetropolitan area | 80 | 0.47 | 0.21 | (4) | $ 71,970 |
| Connecticut nonmetropolitan area | 90 | 2.95 | 1.33 | (4) | $ 71,420 |
| Central Missouri nonmetropolitan area | 440 | 2.92 | 1.31 | (4) | $ 66,750 |
| Southeast Alabama nonmetropolitan area | 330 | 3.97 | 1.78 | (4) | $ 66,150 |
| North Valley-Northern Mountains Region of California nonmetropolitan area | 320 | 3.26 | 1.47 | (4) | $ 64,680 |
These estimates are calculated with data collected from employers in all industry sectors, all metropolitan and nonmetropolitan areas, and all states and the District of Columbia. The top employment and wage figures are provided above. The complete list is available in the downloadable XLS files.
The percentile wage estimate is the value of a wage below which a certain percent of workers fall. The median wage is the 50th percentile wage estimate—50 percent of workers earn less than the median and 50 percent of workers earn more than the median. More about percentile wages.
(1) Estimates for detailed occupations do not sum to the totals because the totals include occupations not shown separately. Estimates do not include self-employed workers.
(2) Annual wages have been calculated by multiplying the hourly mean wage by a "year-round, full-time" hours figure of 2,080 hours; for those occupations where there is not an hourly wage published, the annual wage has been directly calculated from the reported survey data.
(3) The relative standard error (RSE) is a measure of the reliability of a survey statistic. The smaller the relative standard error, the more precise the estimate.
(4) Wages for some occupations that do not generally work year-round, full time, are reported either as hourly wages or annual salaries depending on how they are typically paid.
(8) Estimate not released.
(9) The location quotient is the ratio of the area concentration of occupational employment to the national average concentration. A location quotient greater than one indicates the occupation has a higher share of employment than average, and a location quotient less than one indicates the occupation is less prevalent in the area than average.
Other OEWS estimates and related information:
May 2020 National Occupational Employment and Wage Estimates
May 2020 State Occupational Employment and Wage Estimates
May 2020 Metropolitan and Nonmetropolitan Area Occupational Employment and Wage Estimates
May 2020 National Industry-Specific Occupational Employment and Wage Estimates
Last Modified Date: May 19, 2021