An official website of the United States government
 United States Department of Labor
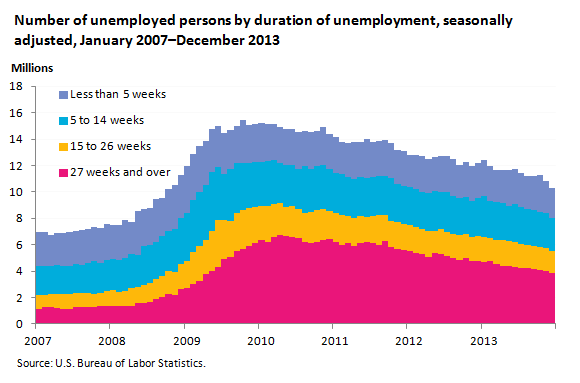
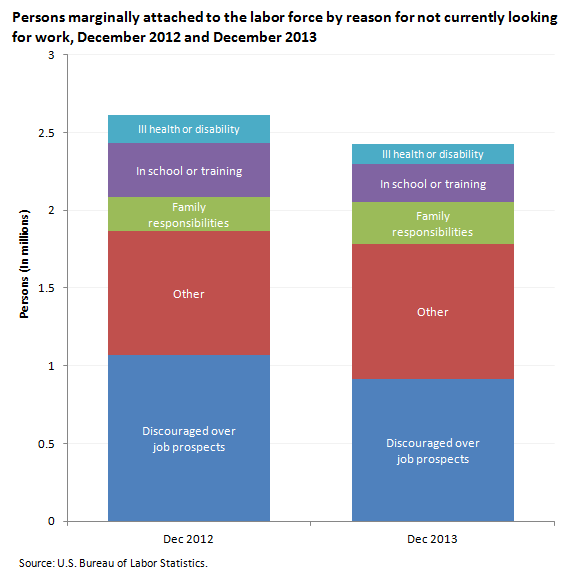
From December 2012 to December 2013, the number of long-term unemployed (seasonally adjusted) declined by 894,000 to 3.9 million, or 37.7% of the unemployed. In December 2013, 2.4 million persons (not seasonally adjusted) were marginally attached to the labor force, little changed from a year earlier.

| Month | Less than 5 weeks | 5 to 14 weeks | 15 to 26 weeks | 27 weeks and over |
|---|---|---|---|---|
January 2007 | 2,561,000 | 2,267,000 | 1,015,000 | 1,141,000 |
February 2007 | 2,574,000 | 2,168,000 | 962,000 | 1,249,000 |
March 2007 | 2,307,000 | 2,138,000 | 1,010,000 | 1,245,000 |
April 2007 | 2,456,000 | 2,178,000 | 1,075,000 | 1,206,000 |
May 2007 | 2,464,000 | 2,183,000 | 1,100,000 | 1,132,000 |
June 2007 | 2,551,000 | 2,134,000 | 1,138,000 | 1,143,000 |
July 2007 | 2,502,000 | 2,203,000 | 1,073,000 | 1,291,000 |
August 2007 | 2,614,000 | 2,156,000 | 1,086,000 | 1,246,000 |
September 2007 | 2,557,000 | 2,292,000 | 1,091,000 | 1,264,000 |
October 2007 | 2,545,000 | 2,502,000 | 1,003,000 | 1,298,000 |
November 2007 | 2,645,000 | 2,241,000 | 992,000 | 1,374,000 |
December 2007 | 2,718,000 | 2,376,000 | 1,177,000 | 1,324,000 |
January 2008 | 2,554,000 | 2,406,000 | 1,152,000 | 1,388,000 |
February 2008 | 2,653,000 | 2,370,000 | 1,116,000 | 1,329,000 |
March 2008 | 2,823,000 | 2,537,000 | 1,168,000 | 1,323,000 |
April 2008 | 2,493,000 | 2,574,000 | 1,314,000 | 1,372,000 |
May 2008 | 3,278,000 | 2,476,000 | 1,219,000 | 1,561,000 |
June 2008 | 2,753,000 | 3,016,000 | 1,337,000 | 1,576,000 |
July 2008 | 2,854,000 | 2,833,000 | 1,450,000 | 1,664,000 |
August 2008 | 3,256,000 | 2,758,000 | 1,554,000 | 1,866,000 |
September 2008 | 2,848,000 | 3,035,000 | 1,599,000 | 2,027,000 |
October 2008 | 3,170,000 | 3,055,000 | 1,710,000 | 2,280,000 |
November 2008 | 3,335,000 | 3,260,000 | 1,704,000 | 2,219,000 |
December 2008 | 3,255,000 | 3,498,000 | 1,936,000 | 2,610,000 |
January 2009 | 3,524,000 | 3,662,000 | 2,065,000 | 2,699,000 |
February 2009 | 3,450,000 | 3,936,000 | 2,456,000 | 2,999,000 |
March 2009 | 3,465,000 | 4,122,000 | 2,625,000 | 3,260,000 |
April 2009 | 3,338,000 | 4,138,000 | 2,634,000 | 3,752,000 |
May 2009 | 3,246,000 | 4,458,000 | 3,049,000 | 3,973,000 |
June 2009 | 3,114,000 | 4,052,000 | 3,488,000 | 4,349,000 |
July 2009 | 3,137,000 | 3,505,000 | 2,923,000 | 4,917,000 |
August 2009 | 2,940,000 | 3,927,000 | 2,791,000 | 5,037,000 |
September 2009 | 2,841,000 | 3,775,000 | 2,908,000 | 5,494,000 |
October 2009 | 3,223,000 | 3,552,000 | 3,006,000 | 5,643,000 |
November 2009 | 2,816,000 | 3,457,000 | 2,847,000 | 5,908,000 |
December 2009 | 2,879,000 | 3,457,000 | 2,712,000 | 6,122,000 |
January 2010 | 2,918,000 | 3,387,000 | 2,570,000 | 6,334,000 |
February 2010 | 2,798,000 | 3,389,000 | 2,764,000 | 6,170,000 |
March 2010 | 2,773,000 | 3,290,000 | 2,519,000 | 6,576,000 |
April 2010 | 2,726,000 | 3,082,000 | 2,363,000 | 6,770,000 |
May 2010 | 2,775,000 | 3,117,000 | 2,248,000 | 6,644,000 |
June 2010 | 2,680,000 | 3,156,000 | 2,294,000 | 6,604,000 |
July 2010 | 2,810,000 | 2,994,000 | 2,220,000 | 6,484,000 |
August 2010 | 2,683,000 | 3,534,000 | 2,171,000 | 6,234,000 |
September 2010 | 2,817,000 | 3,309,000 | 2,293,000 | 6,151,000 |
October 2010 | 2,657,000 | 3,343,000 | 2,385,000 | 6,232,000 |
November 2010 | 2,911,000 | 3,321,000 | 2,377,000 | 6,319,000 |
December 2010 | 2,681,000 | 3,169,000 | 2,118,000 | 6,431,000 |
January 2011 | 2,676,000 | 3,015,000 | 2,210,000 | 6,220,000 |
February 2011 | 2,454,000 | 3,114,000 | 2,244,000 | 5,969,000 |
March 2011 | 2,541,000 | 2,974,000 | 2,034,000 | 6,150,000 |
April 2011 | 2,785,000 | 2,966,000 | 2,106,000 | 5,901,000 |
May 2011 | 2,682,000 | 2,911,000 | 2,031,000 | 6,158,000 |
June 2011 | 2,935,000 | 2,981,000 | 1,899,000 | 6,208,000 |
July 2011 | 2,650,000 | 2,976,000 | 2,009,000 | 6,142,000 |
August 2011 | 2,670,000 | 2,996,000 | 2,213,000 | 6,001,000 |
September 2011 | 2,743,000 | 2,888,000 | 2,015,000 | 6,266,000 |
October 2011 | 2,663,000 | 3,244,000 | 1,947,000 | 5,861,000 |
November 2011 | 2,560,000 | 2,914,000 | 2,032,000 | 5,681,000 |
December 2011 | 2,646,000 | 2,865,000 | 1,955,000 | 5,600,000 |
January 2012 | 2,461,000 | 2,880,000 | 1,942,000 | 5,524,000 |
February 2012 | 2,584,000 | 2,842,000 | 2,021,000 | 5,352,000 |
March 2012 | 2,724,000 | 2,792,000 | 1,924,000 | 5,292,000 |
April 2012 | 2,621,000 | 2,839,000 | 1,951,000 | 5,106,000 |
May 2012 | 2,575,000 | 3,018,000 | 1,677,000 | 5,392,000 |
June 2012 | 2,741,000 | 2,804,000 | 1,839,000 | 5,331,000 |
July 2012 | 2,708,000 | 3,037,000 | 1,780,000 | 5,166,000 |
August 2012 | 2,832,000 | 2,834,000 | 1,845,000 | 5,003,000 |
September 2012 | 2,517,000 | 2,825,000 | 1,853,000 | 4,875,000 |
October 2012 | 2,619,000 | 2,850,000 | 1,774,000 | 5,021,000 |
November 2012 | 2,636,000 | 2,777,000 | 1,796,000 | 4,767,000 |
December 2012 | 2,688,000 | 2,876,000 | 1,862,000 | 4,772,000 |
January 2013 | 2,753,000 | 3,077,000 | 1,867,000 | 4,707,000 |
February 2013 | 2,677,000 | 2,788,000 | 1,735,000 | 4,750,000 |
March 2013 | 2,497,000 | 2,843,000 | 1,779,000 | 4,576,000 |
April 2013 | 2,491,000 | 2,844,000 | 1,969,000 | 4,360,000 |
May 2013 | 2,704,000 | 2,642,000 | 1,934,000 | 4,353,000 |
June 2013 | 2,665,000 | 2,848,000 | 1,892,000 | 4,325,000 |
July 2013 | 2,548,000 | 2,826,000 | 1,786,000 | 4,246,000 |
August 2013 | 2,527,000 | 2,738,000 | 1,704,000 | 4,269,000 |
September 2013 | 2,571,000 | 2,685,000 | 1,802,000 | 4,125,000 |
October 2013 | 2,794,000 | 2,636,000 | 1,777,000 | 4,047,000 |
November 2013 | 2,439,000 | 2,585,000 | 1,742,000 | 4,044,000 |
December 2013 | 2,255,000 | 2,506,000 | 1,651,000 | 3,878,000 |
Among the unemployed in December 2013, those persons without a job for 15 to 26 weeks represented the smallest share of the unemployed—at 16.0 percent, or 1,651,000.
Among those marginally attached to the labor force, the number of discouraged workers (not seasonally adjusted) declined by 151,000 to 917,000. The remaining 1.5 million persons other than discouraged workers had not searched for work for reasons such as school attendance or family responsibilities.

| Category | December 2012 | December 2013 |
|---|---|---|
Discouraged over job prospects | 1,068,000 | 917,000 |
Other | 797,000 | 867,000 |
Family responsibilities | 222,000 | 268,000 |
In school or training | 346,000 | 246,000 |
Ill health or disability | 181,000 | 129,000 |
These data are from the Current Population Survey. Data on the long-term unemployed are seasonally adjusted. All other data are not seasonally adjusted. The long-term unemployed are those persons that are jobless for 27 weeks and over. Persons that are marginally attached to the labor force are individuals that were not in the labor force, wanted and were available for work, and had looked for a job sometime in the prior 12 months, but not in the last 4 weeks. Discouraged workers, a subset of the marginally attached, are persons not currently looking for work because they believe no jobs are available for them. To learn more, see "The Employment Situation — December 2013," (HTML) (PDF) news release USDL-14-0002. More charts featuring CPS data can be found in Charting the labor market: Data from the Current Population Survey, December 2013 (PDF).
Bureau of Labor Statistics, U.S. Department of Labor, The Economics Daily, Long-term unemployed account for 37.7 percent of all unemployed persons in December 2013 at https://www.bls.gov/opub/ted/2014/ted_20140114.htm (visited February 21, 2026).

