An official website of the United States government
 United States Department of Labor
On February 23, 2018, the Bureau of Labor Statistics (BLS) updated measures of labor productivity and costs for Elementary and secondary schools (NAICS 6111) through 2014. Data through 2012 were originally released in June 2016 with the publication of "Labor productivity growth in elementary and secondary school services."
Elementary and secondary schools are critical to establishing the foundations of labor skills development in every sector of the U.S. economy. Typically, young Americans spend the better part of 13 years attending public or private schools at the K-12 level.[1] Along the way, they acquire a broad range of general and practical knowledge needed to succeed in college, vocational schools, or the working world.
Schools do more than just educate millions of people; they employ millions, too. In 2016, eight million U.S. employees – 5.6 percent of all national employment – worked in elementary or secondary schools.[2] Among these are teachers, guidance counselors, administrators, buildings and grounds staff, and several other categories of essential personnel. Total national expenditures on elementary and secondary educational school services for the 2014–15 school year, at an estimated $689 billion, equaled 4.0 percent of GDP.[3]
The importance of getting a return on these substantial investments in education (monetary and otherwise) is clear. Less clear, however, is the most conceptually appropriate way to measure the results from such investments. BLS’s productivity measures follow a growing body of research suggesting that, in assessing the labor efficiency of K-12 education, it is not only the number of students educated that counts, but also the quality of education they receive. As described in the 2016 MLR article, our output measure adjusts enrollment figures by attendance rates and then applies weights based on Long-Term Trend (LTT) scores from the National Assessment of Educational Progress (NAEP). Furthermore, our labor input measure for this industry accounts for a variety of school occupational categories to acknowledge the many ways that schools contribute to the educational success of children.
Create your own tables and charts by industry and indicator.
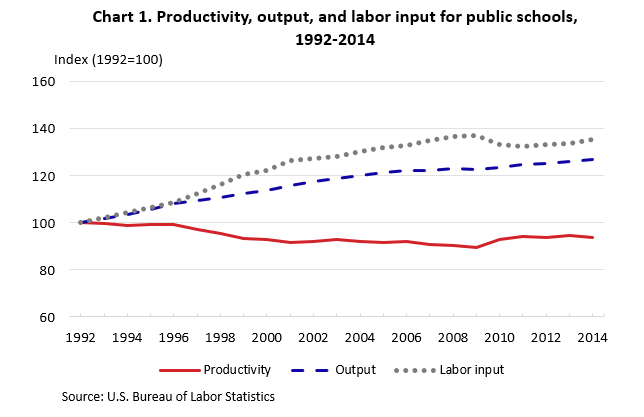
Chart 1 shows that from 1992 to 2009, both the output and labor input of public schools grew steadily, slowing down after 2001. Because labor input grew faster, labor productivity fell during this period. Since the economic recession ended in 2009, labor productivity growth has been slightly positive as steady output growth was met with a slight decline in labor input.

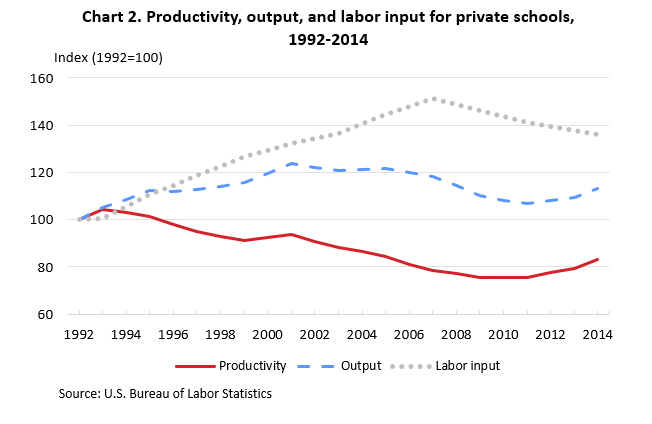
Chart 2 shows a different pattern for private schools. Labor input rose much faster than output for most of the time frame, resulting in a steeper decline of labor productivity through 2007. The labor input trend then reversed, allowing labor productivity to bottom out in 2009 and slowly recover through 2014.

To construct indexes for all schools, BLS first builds the output and labor input indexes, separately, for public and private schools. The respective output and labor input indexes are then aggregated together, for all schools, using expenditure share weights. (See the BLS Handbook of Methods for more information on the aggregation methodology used by the BLS Productivity Program.) Lastly, we take a ratio of the output and labor indexes of all schools to yield the labor productivity index.
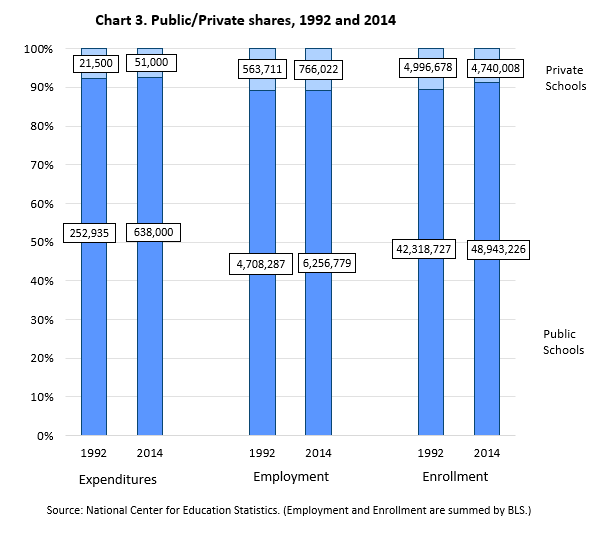
Chart 3 compares the change in the relative shares from 1992 to 2014 of expenditures, employment, and enrollment for public and private schools.

It is apparent in both the beginning and end years of our time series that the private schools’ share of the unadjusted total enrollment and employment are both larger than their share of total school expenditures. (Student enrollments are the primary component of the output measures, while total employment is closely related to the labor input measure.) The private schools’ share of all school expenditures decreased slightly during the 1992-2014 time period.
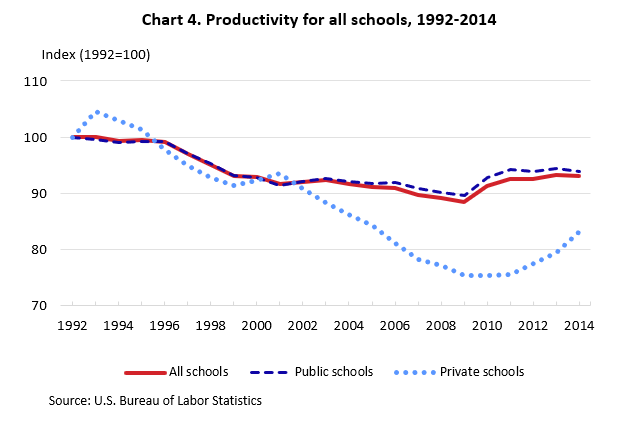
It is evident from Chart 4 that, despite the considerable variation between public school and private school trends in labor productivity and related variables, the overall productivity trend largely tracks public schools.

Recall from Chart 3 that the total expenditure shares, which are used to aggregate the output and labor input indexes, are dominated by public schools throughout our time series. As a result, the steeper decline in private school productivity has not greatly affected the overall industry trend. Nonetheless, it is possible to see a divergence beginning around 2003 when the effect of lower productivity in private schools brings down the overall index.
Labor productivity growth in elementary and secondary school services: 1989-2012
Industries at a Glance: Educational Services NAICS 61
Overview of BLS Productivity Statistics
[1] Compulsory ages of attendance vary by state. However, 71.7 percent of 5-year-olds nationwide were enrolled in Kindergarten as of Fall 2015, along with 6.5 percent of 4-year-olds and 2.1 percent of 3-year-olds. (Source: Digest of Education Statistics, Table 202.20.) For high-schoolers, the estimated cohort graduation rate in 2012 was 83 percent. (Source: Digest of Education Statistics, Table 219.46.)
[2] The industry employment quantity, or numerator of the proportion (7,988,903), is from the BLS Quarterly Census of Employment and Wages (QCEW). The denominator (141,870,066) is the QCEW figure of “All Employees.”
[3] Source: Digest of Education Statistics, Table 106.10. Total expenditures for public elementary and secondary schools include current expenditures, interest on school debt, and capital outlay. Data for private elementary and secondary schools are estimated by NCES for the year 2014-2015.