
An official website of the United States government
An official website of the United States government
The .gov means it's official.
Federal government websites often end in .gov or .mil. Before sharing sensitive information,
make sure you're on a federal government site.
The site is secure.
The
https:// ensures that you are connecting to the official website and that any
information you provide is encrypted and transmitted securely.
The American Time Use Survey (ATUS) measures the amount of time people spend doing various activities, such as paid work, childcare, volunteering, and socializing.
Percent of employed people who worked at home and at their workplace on days worked, 2024 annual averages
Status
Percent who worked at workplace
Percent who worked at home
Total
72.4%
32.5%
Full-time workers
72.9%
33.4%
Part-time workers
70.0%
27.9%
Single jobholders
72.4%
31.9%
Multiple jobholders
72.4%
37.4%
Less than a high school diploma
87.4%
5.0%
High school graduates, no college
84.0%
17.8%
Some college or associate degree
77.3%
25.9%
Bachelor's degree or higher
58.6%
50.0%
Note:
Data for educational attainment refer to persons 25 years and over.
Work at home refers to both scheduled and unscheduled work done at home.
Household activities:
2.01 in 2024
![]()
Eating and drinking:
1.24 in 2024
![]()
Leisure and sports:
5.07 in 2024
![]()
Sleeping:
9.04 in 2024
![]()
Caring for and helping household children, parents:
1.45 in 2024
![]()
Working, employed persons:
4.95 in 2024
![]()
Working on days worked, employed persons:
7.60 in 2024
![]()
Working, employed persons:
65.0 in 2024
![]()
Participating in sports, exercise, and recreation:
21.5 in 2024
![]()
06/26/2025
In 2024, 87 percent of full-time employed people worked on an average weekday,
compared with 29 percent on an average weekend day. Full-time employed people
averaged 8.4 hours of work on weekdays they worked, and 5.6 hours on weekend
days they worked.
HTML
|
PDF
|
RSS
|
Charts
09/25/2025
Fourteen percent of the U.S. population provides eldercare--unpaid care for someone with a
condition related to aging--to others. On a given day, 28 percent of eldercare providers
engage in eldercare, spending an average of 3.9 hours in eldercare activities.
HTML
|
PDF
|
RSS
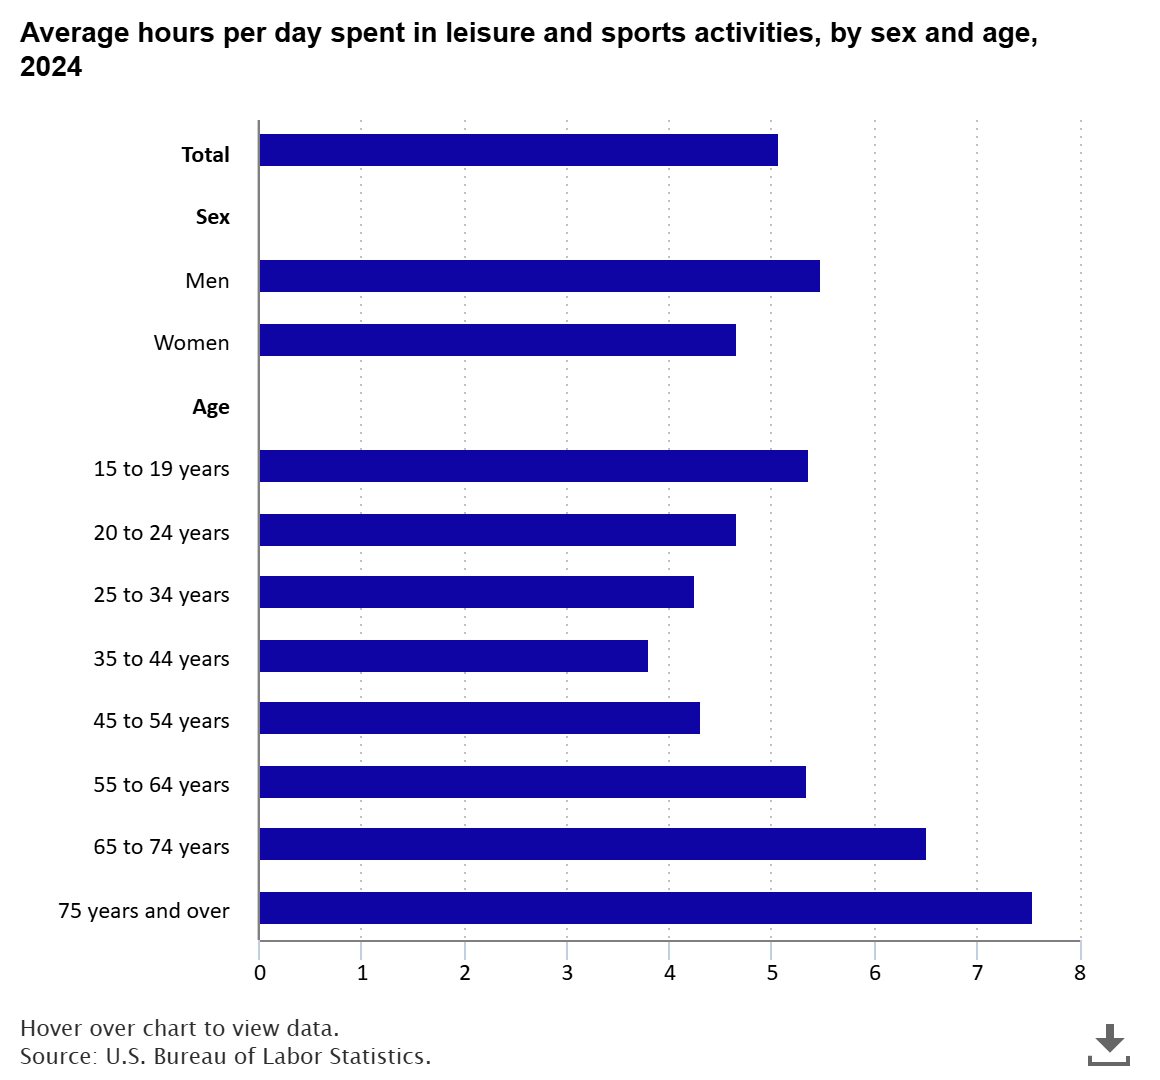
Nearly everyone age 15 and over (94 percent) engaged in some sort of leisure and sport activity, such as watching TV, socializing, or exercising, on an average day in 2024. While men and women were equally likely to engage in leisure and sports activities, men spent more time in these activities than did women (5.5 hours, compared with 4.7 hours). read more »

Mothers working part time have jobs with reduced availability of family-friendly benefits and wages compared with mothers working full time. read more »