
An official website of the United States government
An official website of the United States government
The .gov means it's official.
Federal government websites often end in .gov or .mil. Before sharing sensitive information,
make sure you're on a federal government site.
The site is secure.
The
https:// ensures that you are connecting to the official website and that any
information you provide is encrypted and transmitted securely.
The American Time Use Survey (ATUS) measures the amount of time people spend doing various activities, such as paid work, childcare, volunteering, and socializing.
Percent of employed people who worked at home and at their workplace on days worked, 2025 annual averages
Status
Percent who worked at workplace
Percent who worked at home
Total
69.8%
34.5%
Full-time workers
70.3%
34.9%
Part-time workers
67.2%
32.1%
Single jobholders
70.3%
33.7%
Multiple jobholders
66.1%
41.2%
Less than a high school diploma
94.8%
9.1%
High school graduates, no college
83.1%
19.0%
Some college or associate degree
73.7%
29.7%
Bachelor's degree or higher
56.2%
51.4%
Note:
Data for educational attainment refer to persons 25 years and over.
Work at home refers to both scheduled and unscheduled work done at home.
Household activities:
1.99 in 2025
![]()
Eating and drinking:
1.21 in 2025
![]()
Leisure and sports:
5.16 in 2025
![]()
Sleeping:
9.03 in 2025
![]()
Caring for and helping household children, parents:
1.36 in 2025
![]()
Working, employed persons:
5.02 in 2025
![]()
Working on days worked, employed persons:
7.66 in 2025
![]()
Working, employed persons:
65.5 in 2025
![]()
Participating in sports, exercise, and recreation:
23.4 in 2025
![]()
06/25/2026
In 2025, 35 percent of employed people did some or all of their work at
home on days they worked, and 70 percent of employed people did some or
all of their work at their workplace.
HTML
|
PDF
|
RSS
|
Charts
09/25/2025
Fourteen percent of the U.S. population provides eldercare--unpaid care for someone with a
condition related to aging--to others. On a given day, 28 percent of eldercare providers
engage in eldercare, spending an average of 3.9 hours in eldercare activities.
HTML
|
PDF
|
RSS
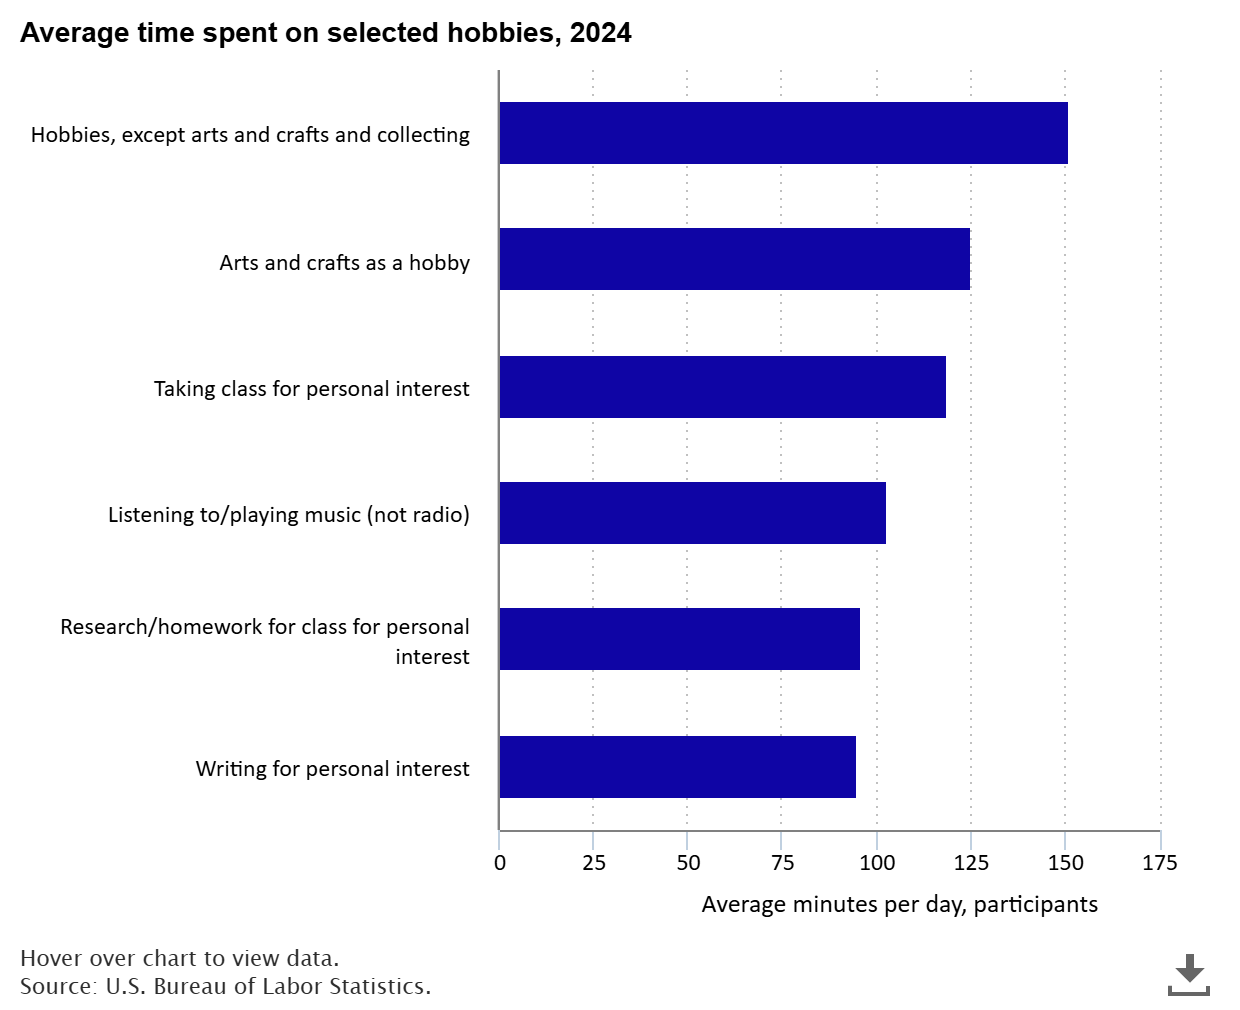
Have you ever made a bauble, a bangle, or maybe a beaded bracelet? Across the country a wide variety of things fill our spare time, not the least of which is arts and crafts as a hobby. Hobbies sometimes require certain skills and, like most human endeavors, get easier with practice. Some people even take classes and do homework to learn about their personal interests and improve their skills. In recognition of World Hobby Month, let’s look at the time spent on a few hobbies and activities. read more »

Mothers working part time have jobs with reduced availability of family-friendly benefits and wages compared with mothers working full time. read more »