
An official website of the United States government
An official website of the United States government
The .gov means it's official.
Federal government websites often end in .gov or .mil. Before sharing sensitive information,
make sure you're on a federal government site.
The site is secure.
The
https:// ensures that you are connecting to the official website and that any
information you provide is encrypted and transmitted securely.
This major group comprises the following occupations: First-Line Supervisors of Correctional Officers ; First-Line Supervisors of Police and Detectives ; First-Line Supervisors of Fire Fighting and Prevention Workers ; First-Line Supervisors of Protective Service Workers, All Other ; Firefighters ; Fire Inspectors and Investigators ; Forest Fire Inspectors and Prevention Specialists ; Bailiffs ; Correctional Officers and Jailers ; Detectives and Criminal Investigators ; Fish and Game Wardens ; Parking Enforcement Workers ; Police and Sheriff's Patrol Officers ; Transit and Railroad Police ; Animal Control Workers ; Private Detectives and Investigators ; Gaming Surveillance Officers and Gaming Investigators ; Security Guards ; Crossing Guards ; Lifeguards, Ski Patrol, and Other Recreational Protective Service Workers ; Transportation Security Screeners ; Protective Service Workers, All Other
Employment estimate and mean wage estimates for this major group:
| Employment (1) | Employment RSE (3) |
Mean hourly wage |
Mean annual wage (2) |
Wage RSE (3) |
|---|---|---|---|---|
| 3,437,410 | 0.4 % | $23.36 | $48,580 | 0.6 % |
Percentile wage estimates for this major group:
| Percentile | 10% | 25% | 50% (Median) |
75% | 90% |
|---|---|---|---|---|---|
| Hourly Wage | $10.63 | $13.46 | $19.54 | $29.85 | $42.35 |
| Annual Wage (2) | $22,110 | $28,000 | $40,640 | $62,090 | $88,090 |
Industries with the highest published employment and wages for this occupation are provided. For a list of all industries with employment in this occupation, see the Create Customized Tables function.
Industries with the highest levels of employment in this occupation:
| Industry | Employment (1) | Percent of industry employment | Hourly mean wage | Annual mean wage (2) |
|---|---|---|---|---|
| Local Government, excluding schools and hospitals (OES Designation) | 1,397,410 | 25.50 | $28.92 | $60,160 |
| Investigation and Security Services | 740,760 | 78.49 | $15.31 | $31,850 |
| State Government, excluding schools and hospitals (OES Designation) | 386,600 | 17.76 | $27.65 | $57,520 |
| Federal Executive Branch (OES Designation) | 140,630 | 7.01 | $33.30 | $69,270 |
| Elementary and Secondary Schools | 99,560 | 1.16 | $15.96 | $33,190 |
Industries with the highest concentration of employment in this occupation:
| Industry | Employment (1) | Percent of industry employment | Hourly mean wage | Annual mean wage (2) |
|---|---|---|---|---|
| Investigation and Security Services | 740,760 | 78.49 | $15.31 | $31,850 |
| Local Government, excluding schools and hospitals (OES Designation) | 1,397,410 | 25.50 | $28.92 | $60,160 |
| Facilities Support Services | 31,300 | 20.20 | $19.83 | $41,250 |
| State Government, excluding schools and hospitals (OES Designation) | 386,600 | 17.76 | $27.65 | $57,520 |
| Other Support Services | 35,880 | 11.45 | $17.33 | $36,050 |
Top paying industries for this occupation:
| Industry | Employment (1) | Percent of industry employment | Hourly mean wage | Annual mean wage (2) |
|---|---|---|---|---|
| Postal Service (federal government) | 1,340 | 0.21 | $38.48 | $80,040 |
| Natural Gas Distribution | 170 | 0.16 | $35.20 | $73,210 |
| Rail Transportation | 1,860 | 0.80 | $34.79 | $72,370 |
| Advertising, Public Relations, and Related Services | 110 | 0.02 | $34.58 | $71,920 |
| Federal Executive Branch (OES Designation) | 140,630 | 7.01 | $33.30 | $69,270 |
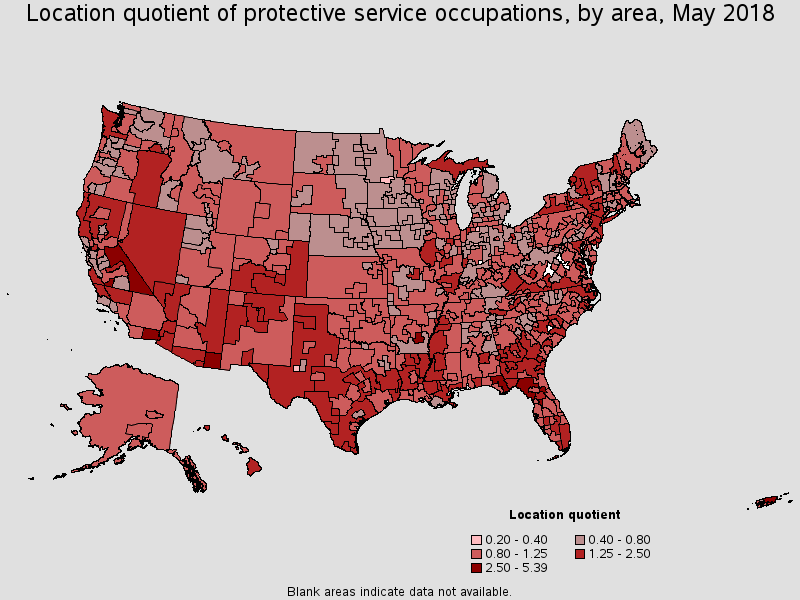
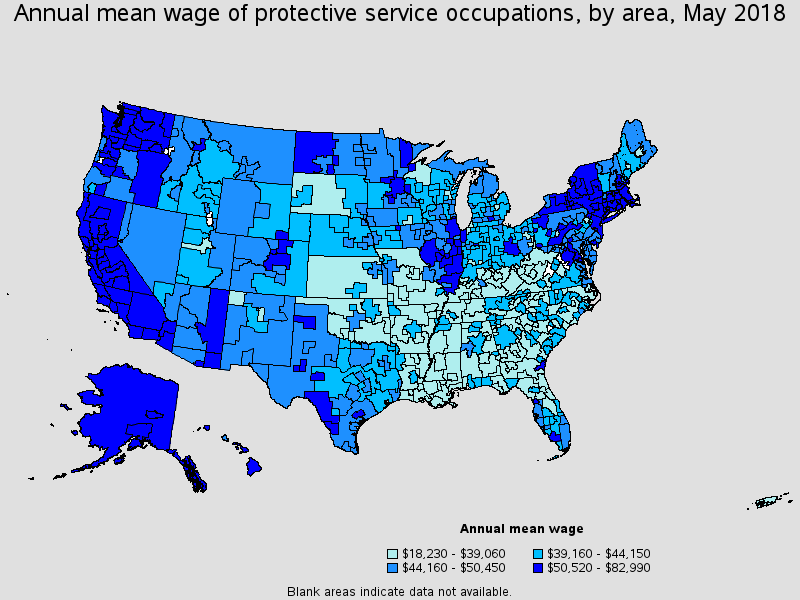
States and areas with the highest published employment, location quotients, and wages for this occupation are provided. For a list of all areas with employment in this occupation, see the Create Customized Tables function.
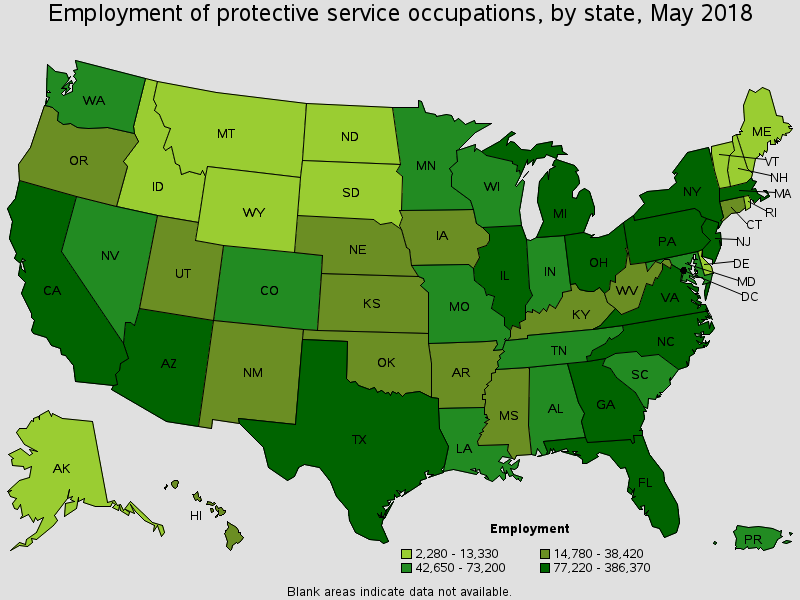
States with the highest employment level in this occupation:
| State | Employment (1) | Employment per thousand jobs | Location quotient (9) | Hourly mean wage | Annual mean wage (2) |
|---|---|---|---|---|---|
| California | 386,370 | 22.72 | 0.96 | $29.40 | $61,150 |
| New York | 313,240 | 33.37 | 1.41 | $26.38 | $54,870 |
| Texas | 291,740 | 24.08 | 1.01 | $22.04 | $45,840 |
| Florida | 235,400 | 27.34 | 1.15 | $20.82 | $43,310 |
| Illinois | 151,070 | 25.21 | 1.06 | $25.84 | $53,750 |
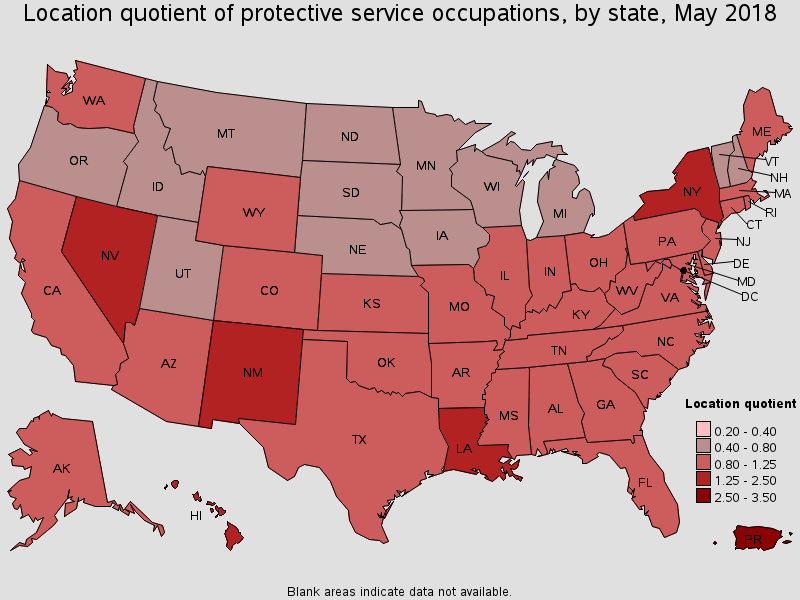
States with the highest concentration of jobs and location quotients in this occupation:
| State | Employment (1) | Employment per thousand jobs | Location quotient (9) | Hourly mean wage | Annual mean wage (2) |
|---|---|---|---|---|---|
| District of Columbia | 27,440 | 38.53 | 1.62 | $31.28 | $65,060 |
| New York | 313,240 | 33.37 | 1.41 | $26.38 | $54,870 |
| Hawaii | 20,380 | 31.75 | 1.34 | $23.96 | $49,850 |
| Nevada | 42,650 | 31.66 | 1.33 | $21.42 | $44,550 |
| New Mexico | 25,660 | 31.62 | 1.33 | $20.28 | $42,190 |
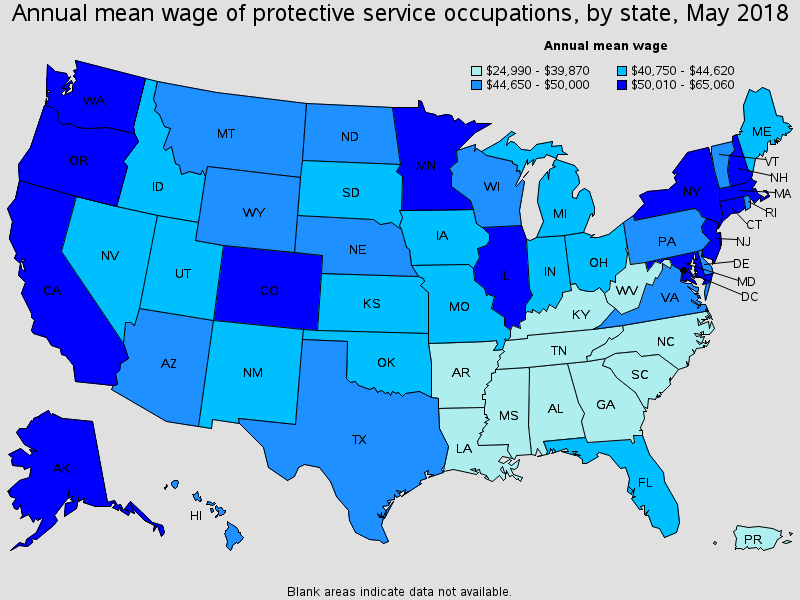
Top paying States for this occupation:
| State | Employment (1) | Employment per thousand jobs | Location quotient (9) | Hourly mean wage | Annual mean wage (2) |
|---|---|---|---|---|---|
| District of Columbia | 27,440 | 38.53 | 1.62 | $31.28 | $65,060 |
| Alaska | 7,900 | 25.07 | 1.06 | $29.63 | $61,630 |
| California | 386,370 | 22.72 | 0.96 | $29.40 | $61,150 |
| Washington | 66,080 | 20.27 | 0.85 | $28.53 | $59,340 |
| New Jersey | 109,980 | 27.15 | 1.14 | $27.68 | $57,570 |
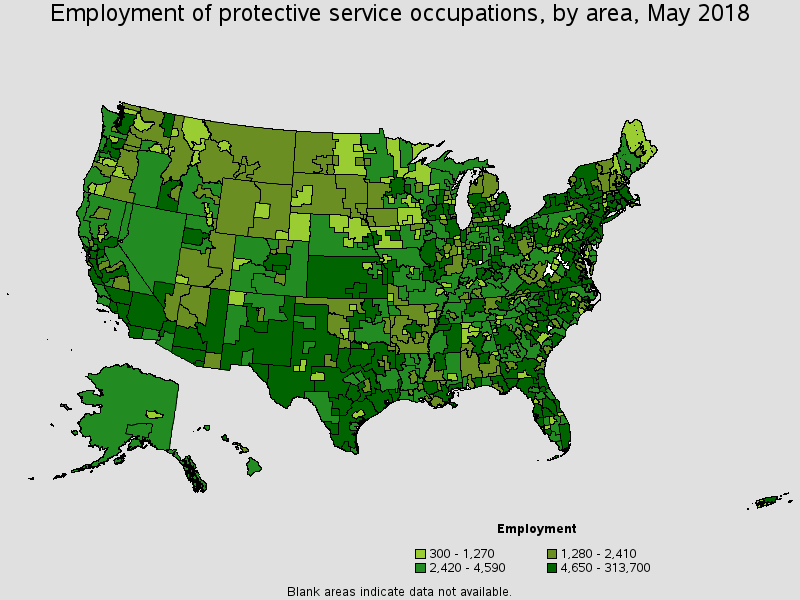
Metropolitan areas with the highest employment level in this occupation:
| Metropolitan area | Employment (1) | Employment per thousand jobs | Location quotient (9) | Hourly mean wage | Annual mean wage (2) |
|---|---|---|---|---|---|
| New York-Newark-Jersey City, NY-NJ-PA | 313,700 | 33.03 | 1.39 | $26.84 | $55,830 |
| Los Angeles-Long Beach-Anaheim, CA | 142,470 | 23.28 | 0.98 | $28.69 | $59,680 |
| Chicago-Naperville-Elgin, IL-IN-WI | 120,770 | 26.02 | 1.10 | $25.81 | $53,680 |
| Washington-Arlington-Alexandria, DC-VA-MD-WV | 88,360 | 28.18 | 1.19 | $28.47 | $59,210 |
| Miami-Fort Lauderdale-West Palm Beach, FL | 84,070 | 32.46 | 1.37 | $22.55 | $46,900 |
| Dallas-Fort Worth-Arlington, TX | 72,150 | 20.22 | 0.85 | $22.30 | $46,390 |
| Philadelphia-Camden-Wilmington, PA-NJ-DE-MD | 71,910 | 25.24 | 1.06 | $22.77 | $47,350 |
| Houston-The Woodlands-Sugar Land, TX | 70,320 | 23.58 | 0.99 | $21.13 | $43,950 |
| Boston-Cambridge-Nashua, MA-NH | 59,750 | 21.66 | 0.91 | $27.61 | $57,420 |
| Atlanta-Sandy Springs-Roswell, GA | 58,990 | 21.99 | 0.93 | $19.81 | $41,210 |
Metropolitan areas with the highest concentration of jobs and location quotients in this occupation:
| Metropolitan area | Employment (1) | Employment per thousand jobs | Location quotient (9) | Hourly mean wage | Annual mean wage (2) |
|---|---|---|---|---|---|
| Hanford-Corcoran, CA | 3,600 | 83.94 | 3.53 | $37.90 | $78,840 |
| Sierra Vista-Douglas, AZ | 2,310 | 71.60 | 3.01 | $27.63 | $57,480 |
| Pine Bluff, AR | 2,140 | 70.42 | 2.96 | $18.22 | $37,890 |
| The Villages, FL | 1,880 | 68.89 | 2.90 | $22.68 | $47,170 |
| El Centro, CA | 3,560 | 60.83 | 2.56 | $32.21 | $66,990 |
| Yuma, AZ | 3,250 | 53.11 | 2.24 | $24.29 | $50,520 |
| Vineland-Bridgeton, NJ | 3,010 | 50.06 | 2.11 | $31.49 | $65,490 |
| Laredo, TX | 4,780 | 47.80 | 2.01 | $26.38 | $54,860 |
| Michigan City-La Porte, IN | 1,880 | 47.31 | 1.99 | $18.46 | $38,390 |
| Kingston, NY | 2,610 | 43.04 | 1.81 | $27.11 | $56,380 |
Top paying metropolitan areas for this occupation:
| Metropolitan area | Employment (1) | Employment per thousand jobs | Location quotient (9) | Hourly mean wage | Annual mean wage (2) |
|---|---|---|---|---|---|
| Vallejo-Fairfield, CA | 4,160 | 30.12 | 1.27 | $39.90 | $82,990 |
| Madera, CA | 1,740 | 38.75 | 1.63 | $38.18 | $79,410 |
| Hanford-Corcoran, CA | 3,600 | 83.94 | 3.53 | $37.90 | $78,840 |
| Bakersfield, CA | 9,580 | 31.17 | 1.31 | $34.80 | $72,380 |
| San Luis Obispo-Paso Robles-Arroyo Grande, CA | 3,470 | 29.58 | 1.25 | $33.98 | $70,670 |
| Bremerton-Silverdale, WA | 1,770 | 19.95 | 0.84 | $33.96 | $70,630 |
| Salinas, CA | 5,450 | 30.33 | 1.28 | $32.68 | $67,980 |
| El Centro, CA | 3,560 | 60.83 | 2.56 | $32.21 | $66,990 |
| San Francisco-Oakland-Hayward, CA | 45,260 | 18.71 | 0.79 | $31.80 | $66,130 |
| Vineland-Bridgeton, NJ | 3,010 | 50.06 | 2.11 | $31.49 | $65,490 |
Nonmetropolitan areas with the highest employment in this occupation:
| Nonmetropolitan area | Employment (1) | Employment per thousand jobs | Location quotient (9) | Hourly mean wage | Annual mean wage (2) |
|---|---|---|---|---|---|
| North Florida nonmetropolitan area | 9,390 | 79.00 | 3.33 | $17.72 | $36,860 |
| Hill Country Region of Texas nonmetropolitan area | 9,040 | 47.22 | 1.99 | $20.36 | $42,340 |
| Kansas nonmetropolitan area | 8,530 | 21.75 | 0.92 | $17.83 | $37,080 |
| North Texas Region of Texas nonmetropolitan area | 7,760 | 28.54 | 1.20 | $20.20 | $42,010 |
| Southwest New York nonmetropolitan area | 7,110 | 38.49 | 1.62 | $24.93 | $51,860 |
Nonmetropolitan areas with the highest concentration of jobs and location quotients in this occupation:
| Nonmetropolitan area | Employment (1) | Employment per thousand jobs | Location quotient (9) | Hourly mean wage | Annual mean wage (2) |
|---|---|---|---|---|---|
| North Florida nonmetropolitan area | 9,390 | 79.00 | 3.33 | $17.72 | $36,860 |
| Eastern Sierra-Mother Lode Region of California nonmetropolitan area | 3,630 | 61.47 | 2.59 | $31.58 | $65,690 |
| Border Region of Texas nonmetropolitan area | 3,340 | 57.70 | 2.43 | $27.51 | $57,210 |
| Arizona nonmetropolitan area | 5,120 | 55.89 | 2.35 | $25.37 | $52,760 |
| Hill Country Region of Texas nonmetropolitan area | 9,040 | 47.22 | 1.99 | $20.36 | $42,340 |
Top paying nonmetropolitan areas for this occupation:
| Nonmetropolitan area | Employment (1) | Employment per thousand jobs | Location quotient (9) | Hourly mean wage | Annual mean wage (2) |
|---|---|---|---|---|---|
| North Valley-Northern Mountains Region of California nonmetropolitan area | 4,070 | 41.03 | 1.73 | $32.23 | $67,040 |
| Eastern Sierra-Mother Lode Region of California nonmetropolitan area | 3,630 | 61.47 | 2.59 | $31.58 | $65,690 |
| North Coast Region of California nonmetropolitan area | 3,180 | 30.09 | 1.27 | $29.89 | $62,180 |
| Connecticut nonmetropolitan area | 490 | 14.81 | 0.62 | $29.73 | $61,840 |
| Alaska nonmetropolitan area | 2,970 | 27.95 | 1.18 | $29.48 | $61,320 |
These estimates are calculated with data collected from employers in all industry sectors, all metropolitan and nonmetropolitan areas, and all states and the District of Columbia.
The percentile wage estimate is the value of a wage below which a certain percent of workers fall. The median wage is the 50th percentile wage estimate--50 percent of workers earn less than the median and 50 percent of workers earn more than the median. More about percentile wages.
(1) Estimates for detailed occupations do not sum to the totals because the totals include occupations not shown separately. Estimates do not include self-employed workers.
(2) Annual wages have been calculated by multiplying the hourly mean wage by a "year-round, full-time" hours figure of 2,080 hours; for those occupations where there is not an hourly wage published, the annual wage has been directly calculated from the reported survey data.
(3) The relative standard error (RSE) is a measure of the reliability of a survey statistic. The smaller the relative standard error, the more precise the estimate.
(9) The location quotient is the ratio of the area concentration of occupational employment to the national average concentration. A location quotient greater than one indicates the occupation has a higher share of employment than average, and a location quotient less than one indicates the occupation is less prevalent in the area than average.
Other OES estimates and related information:
May 2018 National Occupational Employment and Wage Estimates
May 2018 State Occupational Employment and Wage Estimates
May 2018 Metropolitan and Nonmetropolitan Area Occupational Employment and Wage Estimates
May 2018 National Industry-Specific Occupational Employment and Wage Estimates
Last Modified Date: March 29, 2019