
An official website of the United States government
An official website of the United States government
The .gov means it's official.
Federal government websites often end in .gov or .mil. Before sharing sensitive information,
make sure you're on a federal government site.
The site is secure.
The
https:// ensures that you are connecting to the official website and that any
information you provide is encrypted and transmitted securely.
Life, Physical, and Social Science Occupations comprises the following occupations: Animal Scientists; Food Scientists and Technologists; Soil and Plant Scientists; Biological Scientists, All Other; Zoologists and Wildlife Biologists; Microbiologists; Biochemists and Biophysicists; Foresters; Conservation Scientists; Epidemiologists; Medical Scientists, Except Epidemiologists; Life Scientists, All Other; Astronomers; Physicists; Atmospheric and Space Scientists; Materials Scientists; Chemists; Hydrologists; Geoscientists, Except Hydrologists and Geographers; Environmental Scientists and Specialists, Including Health; Physical Scientists, All Other; Economists; Survey Researchers; Psychologists, All Other; Industrial-Organizational Psychologists; School Psychologists; Clinical and Counseling Psychologists; Sociologists; Urban and Regional Planners; Social Scientists and Related Workers, All Other; Geographers; Historians; Political Scientists; Anthropologists and Archeologists; Food Science Technicians; Agricultural Technicians; Biological Technicians; Chemical Technicians; Hydrologic Technicians; Geological Technicians, Except Hydrologic Technicians; Environmental Science and Protection Technicians, Including Health; Nuclear Technicians; Social Science Research Assistants; Forest and Conservation Technicians; Life, Physical, and Social Science Technicians, All Other; Forensic Science Technicians; Occupational Health and Safety Technicians; Occupational Health and Safety Specialists
Employment estimate and mean wage estimates for Life, Physical, and Social Science Occupations:
| Employment (1) | Employment RSE (3) |
Mean hourly wage |
Mean annual wage (2) |
Wage RSE (3) |
|---|---|---|---|---|
| 1,273,640 | 0.5 % | $ 38.81 | $ 80,730 | 0.5 % |
Percentile wage estimates for Life, Physical, and Social Science Occupations:
| Percentile | 10% | 25% | 50% (Median) |
75% | 90% |
|---|---|---|---|---|---|
| Hourly Wage | $ 18.19 | $ 23.78 | $ 34.97 | $ 48.19 | $ 63.09 |
| Annual Wage (2) | $ 37,830 | $ 49,460 | $ 72,740 | $ 100,230 | $ 131,230 |
Industries with the highest published employment and wages for Life, Physical, and Social Science Occupations are provided. For a list of all industries with employment in Life, Physical, and Social Science Occupations, see the Create Customized Tables function.
Industries with the highest levels of employment in Life, Physical, and Social Science Occupations:
| Industry | Employment (1) | Percent of industry employment | Hourly mean wage | Annual mean wage (2) |
|---|---|---|---|---|
| Scientific Research and Development Services | 194,180 | 24.40 | $ 47.11 | $ 98,000 |
| Federal Executive Branch (OEWS Designation) | 147,950 | 7.02 | $ 42.34 | $ 88,060 |
| Colleges, Universities, and Professional Schools | 111,680 | 3.75 | $ 30.49 | $ 63,420 |
| Local Government, excluding schools and hospitals (OEWS Designation) | 94,410 | 1.76 | $ 34.82 | $ 72,420 |
| State Government, excluding schools and hospitals (OEWS Designation) | 91,500 | 4.17 | $ 32.49 | $ 67,570 |
Industries with the highest concentration of employment in Life, Physical, and Social Science Occupations:
| Industry | Employment (1) | Percent of industry employment | Hourly mean wage | Annual mean wage (2) |
|---|---|---|---|---|
| Scientific Research and Development Services | 194,180 | 24.40 | $ 47.11 | $ 98,000 |
| Pharmaceutical and Medicine Manufacturing | 43,790 | 13.94 | $ 37.96 | $ 78,970 |
| Federal Executive Branch (OEWS Designation) | 147,950 | 7.02 | $ 42.34 | $ 88,060 |
| Chemical Manufacturing (3251, 3252, 3253, and 3259 only) | 22,350 | 6.36 | $ 37.44 | $ 77,880 |
| Architectural, Engineering, and Related Services | 71,790 | 4.75 | $ 32.00 | $ 66,560 |
Top paying industries for Life, Physical, and Social Science Occupations:
| Industry | Employment (1) | Percent of industry employment | Hourly mean wage | Annual mean wage (2) |
|---|---|---|---|---|
| Monetary Authorities-Central Bank | 330 | 1.57 | $ 75.28 | $ 156,580 |
| Credit Intermediation and Related Activities (5221 and 5223 only) | 70 | (7) | $ 69.03 | $ 143,580 |
| Securities, Commodity Contracts, and Other Financial Investments and Related Activities | 710 | 0.07 | $ 67.75 | $ 140,920 |
| Legal Services | 310 | 0.03 | $ 65.80 | $ 136,870 |
| Wholesale Electronic Markets and Agents and Brokers | 1,830 | 0.39 | $ 61.47 | $ 127,850 |
States and areas with the highest published employment, location quotients, and wages for Life, Physical, and Social Science Occupations are provided. For a list of all areas with employment in Life, Physical, and Social Science Occupations, see the Create Customized Tables function.
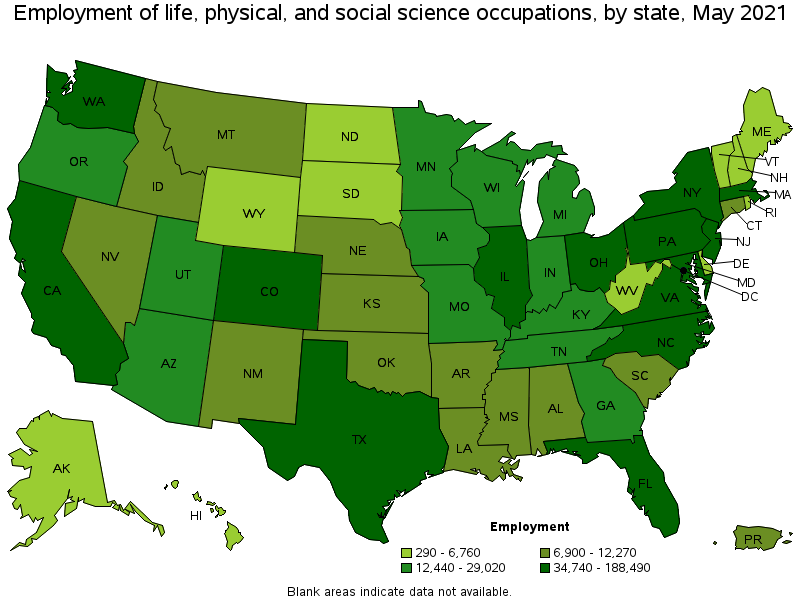
States with the highest employment level in Life, Physical, and Social Science Occupations:
| State | Employment (1) | Employment per thousand jobs | Location quotient (9) | Hourly mean wage | Annual mean wage (2) |
|---|---|---|---|---|---|
| California | 188,490 | 11.40 | 1.26 | $ 43.38 | $ 90,230 |
| Texas | 93,980 | 7.69 | 0.85 | $ 35.84 | $ 74,540 |
| New York | 65,670 | 7.57 | 0.84 | $ 42.12 | $ 87,600 |
| Massachusetts | 55,470 | 16.34 | 1.81 | $ 48.49 | $ 100,870 |
| Pennsylvania | 54,700 | 9.80 | 1.08 | $ 36.02 | $ 74,920 |
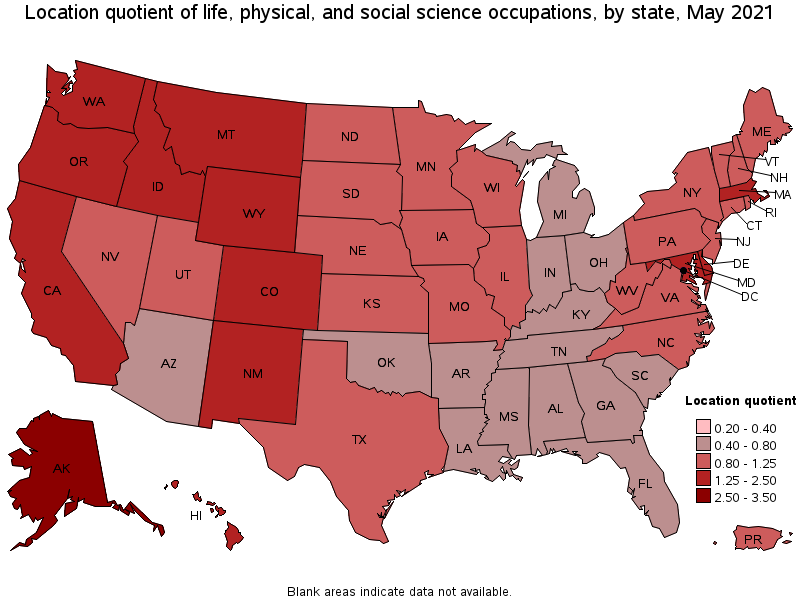
States with the highest concentration of jobs and location quotients in Life, Physical, and Social Science Occupations:
| State | Employment (1) | Employment per thousand jobs | Location quotient (9) | Hourly mean wage | Annual mean wage (2) |
|---|---|---|---|---|---|
| District of Columbia | 20,770 | 31.38 | 3.47 | $ 54.04 | $ 112,400 |
| Alaska | 6,700 | 22.63 | 2.50 | $ 37.71 | $ 78,430 |
| Montana | 8,610 | 18.31 | 2.03 | $ 28.60 | $ 59,500 |
| Maryland | 43,260 | 16.99 | 1.88 | $ 45.71 | $ 95,090 |
| Massachusetts | 55,470 | 16.34 | 1.81 | $ 48.49 | $ 100,870 |
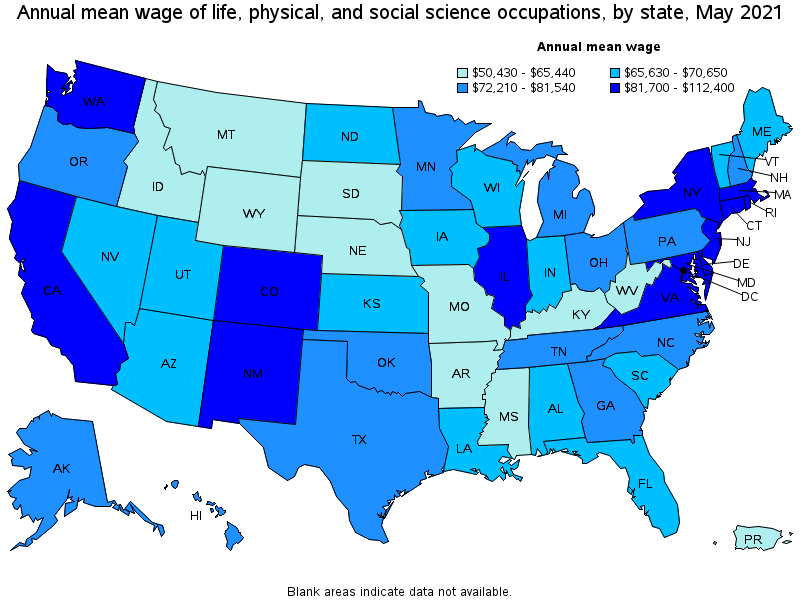
Top paying states for Life, Physical, and Social Science Occupations:
| State | Employment (1) | Employment per thousand jobs | Location quotient (9) | Hourly mean wage | Annual mean wage (2) |
|---|---|---|---|---|---|
| District of Columbia | 20,770 | 31.38 | 3.47 | $ 54.04 | $ 112,400 |
| Massachusetts | 55,470 | 16.34 | 1.81 | $ 48.49 | $ 100,870 |
| Maryland | 43,260 | 16.99 | 1.88 | $ 45.71 | $ 95,090 |
| New Jersey | 43,330 | 11.25 | 1.24 | $ 44.56 | $ 92,680 |
| Virginia | 37,310 | 9.94 | 1.10 | $ 44.46 | $ 92,480 |
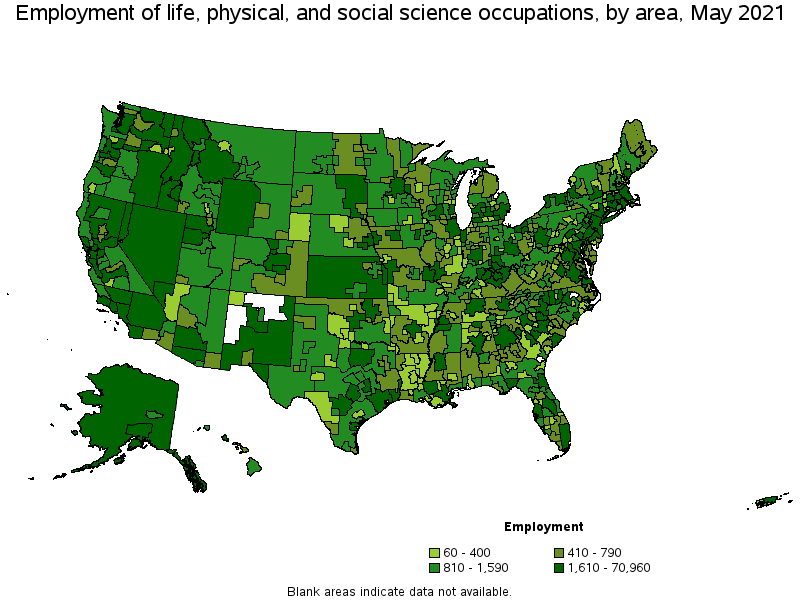
Metropolitan areas with the highest employment level in Life, Physical, and Social Science Occupations:
| Metropolitan area | Employment (1) | Employment per thousand jobs | Location quotient (9) | Hourly mean wage | Annual mean wage (2) |
|---|---|---|---|---|---|
| New York-Newark-Jersey City, NY-NJ-PA | 70,960 | 8.18 | 0.90 | $ 45.34 | $ 94,300 |
| Washington-Arlington-Alexandria, DC-VA-MD-WV | 60,300 | 20.56 | 2.27 | $ 53.41 | $ 111,100 |
| Boston-Cambridge-Nashua, MA-NH | 47,810 | 18.49 | 2.05 | $ 49.76 | $ 103,500 |
| Los Angeles-Long Beach-Anaheim, CA | 47,350 | 8.28 | 0.92 | $ 40.34 | $ 83,900 |
| San Francisco-Oakland-Hayward, CA | 40,340 | 17.99 | 1.99 | $ 53.24 | $ 110,750 |
| Philadelphia-Camden-Wilmington, PA-NJ-DE-MD | 32,640 | 12.30 | 1.36 | $ 40.57 | $ 84,390 |
| Chicago-Naperville-Elgin, IL-IN-WI | 32,130 | 7.59 | 0.84 | $ 40.55 | $ 84,350 |
| Houston-The Woodlands-Sugar Land, TX | 28,950 | 9.99 | 1.11 | $ 40.06 | $ 83,330 |
| San Diego-Carlsbad, CA | 25,900 | 18.62 | 2.06 | $ 42.49 | $ 88,370 |
| Seattle-Tacoma-Bellevue, WA | 22,500 | 11.73 | 1.30 | $ 43.32 | $ 90,110 |
Metropolitan areas with the highest concentration of jobs and location quotients in Life, Physical, and Social Science Occupations:
| Metropolitan area | Employment (1) | Employment per thousand jobs | Location quotient (9) | Hourly mean wage | Annual mean wage (2) |
|---|---|---|---|---|---|
| Corvallis, OR | 1,270 | 36.10 | 3.99 | $ 34.15 | $ 71,040 |
| Boulder, CO | 6,170 | 33.90 | 3.75 | $ 50.69 | $ 105,430 |
| Fairbanks, AK | 1,100 | 31.98 | 3.54 | $ 35.60 | $ 74,040 |
| Ames, IA | 1,410 | 31.51 | 3.49 | $ 31.24 | $ 64,980 |
| Ithaca, NY | 1,450 | 31.18 | 3.45 | $ 33.75 | $ 70,190 |
| Durham-Chapel Hill, NC | 9,730 | 31.17 | 3.45 | $ 40.74 | $ 84,740 |
| Athens-Clarke County, GA | 2,650 | 31.06 | 3.44 | $ 30.00 | $ 62,400 |
| Midland, MI | 1,070 | 30.90 | 3.42 | $ 45.21 | $ 94,040 |
| Trenton, NJ | 6,910 | 30.41 | 3.36 | $ 47.87 | $ 99,580 |
| Kennewick-Richland, WA | 3,150 | 26.90 | 2.98 | $ 45.42 | $ 94,470 |
Top paying metropolitan areas for Life, Physical, and Social Science Occupations:
| Metropolitan area | Employment (1) | Employment per thousand jobs | Location quotient (9) | Hourly mean wage | Annual mean wage (2) |
|---|---|---|---|---|---|
| Washington-Arlington-Alexandria, DC-VA-MD-WV | 60,300 | 20.56 | 2.27 | $ 53.41 | $ 111,100 |
| San Francisco-Oakland-Hayward, CA | 40,340 | 17.99 | 1.99 | $ 53.24 | $ 110,750 |
| San Jose-Sunnyvale-Santa Clara, CA | 10,540 | 9.87 | 1.09 | $ 51.81 | $ 107,760 |
| Boulder, CO | 6,170 | 33.90 | 3.75 | $ 50.69 | $ 105,430 |
| Boston-Cambridge-Nashua, MA-NH | 47,810 | 18.49 | 2.05 | $ 49.76 | $ 103,500 |
| Bridgeport-Stamford-Norwalk, CT | 2,680 | 7.14 | 0.79 | $ 48.97 | $ 101,850 |
| Trenton, NJ | 6,910 | 30.41 | 3.36 | $ 47.87 | $ 99,580 |
| Kennewick-Richland, WA | 3,150 | 26.90 | 2.98 | $ 45.42 | $ 94,470 |
| New York-Newark-Jersey City, NY-NJ-PA | 70,960 | 8.18 | 0.90 | $ 45.34 | $ 94,300 |
| Midland, MI | 1,070 | 30.90 | 3.42 | $ 45.21 | $ 94,040 |
Nonmetropolitan areas with the highest employment in Life, Physical, and Social Science Occupations:
| Nonmetropolitan area | Employment (1) | Employment per thousand jobs | Location quotient (9) | Hourly mean wage | Annual mean wage (2) |
|---|---|---|---|---|---|
| Kansas nonmetropolitan area | 3,070 | 8.18 | 0.91 | $ 29.39 | $ 61,130 |
| Southwest Montana nonmetropolitan area | 3,050 | 22.03 | 2.44 | $ 28.51 | $ 59,300 |
| Alaska nonmetropolitan area | 2,620 | 26.88 | 2.97 | $ 36.12 | $ 75,120 |
| North Valley-Northern Mountains Region of California nonmetropolitan area | 2,470 | 25.19 | 2.79 | $ 27.83 | $ 57,880 |
| Eastern Washington nonmetropolitan area | 2,170 | 23.10 | 2.56 | $ 28.18 | $ 58,600 |
Nonmetropolitan areas with the highest concentration of jobs and location quotients in Life, Physical, and Social Science Occupations:
| Nonmetropolitan area | Employment (1) | Employment per thousand jobs | Location quotient (9) | Hourly mean wage | Annual mean wage (2) |
|---|---|---|---|---|---|
| Northwestern Idaho nonmetropolitan area | 2,090 | 29.84 | 3.30 | $ 24.16 | $ 50,260 |
| Alaska nonmetropolitan area | 2,620 | 26.88 | 2.97 | $ 36.12 | $ 75,120 |
| North Valley-Northern Mountains Region of California nonmetropolitan area | 2,470 | 25.19 | 2.79 | $ 27.83 | $ 57,880 |
| Eastern Oregon nonmetropolitan area | 1,640 | 23.49 | 2.60 | $ 26.59 | $ 55,310 |
| Eastern Washington nonmetropolitan area | 2,170 | 23.10 | 2.56 | $ 28.18 | $ 58,600 |
Top paying nonmetropolitan areas for Life, Physical, and Social Science Occupations:
| Nonmetropolitan area | Employment (1) | Employment per thousand jobs | Location quotient (9) | Hourly mean wage | Annual mean wage (2) |
|---|---|---|---|---|---|
| Northeast Virginia nonmetropolitan area | 710 | 14.79 | 1.64 | $ 48.95 | $ 101,810 |
| Southwest Mississippi nonmetropolitan area | 610 | 8.78 | 0.97 | $ 38.96 | $ 81,030 |
| Connecticut nonmetropolitan area | 150 | 4.74 | 0.52 | $ 38.52 | $ 80,130 |
| Northwest Illinois nonmetropolitan area | 690 | 5.45 | 0.60 | $ 38.24 | $ 79,540 |
| Massachusetts nonmetropolitan area | 410 | 7.04 | 0.78 | $ 37.45 | $ 77,900 |
These estimates are calculated with data collected from employers in all industry sectors, all metropolitan and nonmetropolitan areas, and all states and the District of Columbia.
The percentile wage estimate is the value of a wage below which a certain percent of workers fall. The median wage is the 50th percentile wage estimate—50 percent of workers earn less than the median and 50 percent of workers earn more than the median. More about percentile wages.
(1) Estimates for detailed occupations do not sum to the totals because the totals include occupations not shown separately. Estimates do not include self-employed workers.
(2) Annual wages have been calculated by multiplying the hourly mean wage by a "year-round, full-time" hours figure of 2,080 hours; for those occupations where there is not an hourly wage published, the annual wage has been directly calculated from the reported survey data.
(3) The relative standard error (RSE) is a measure of the reliability of a survey statistic. The smaller the relative standard error, the more precise the estimate.
(7) The value is less than .005 percent of industry employment.
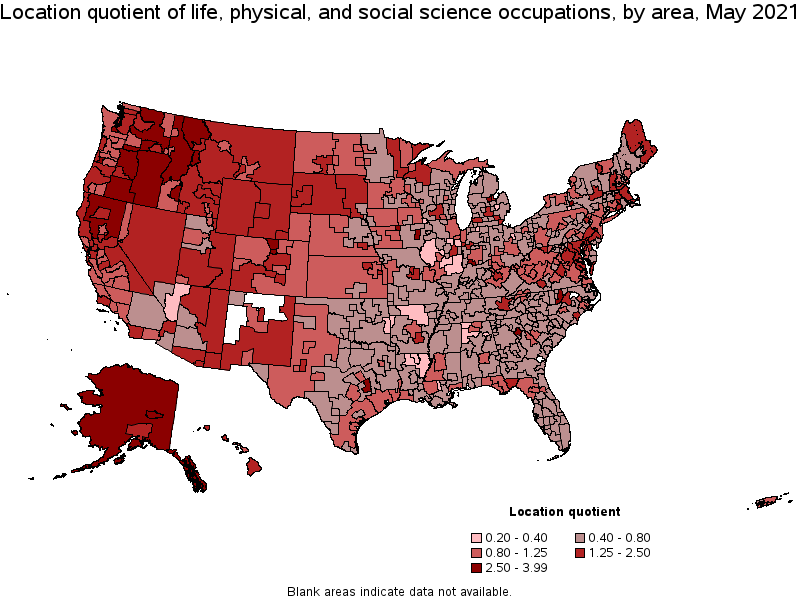
(9) The location quotient is the ratio of the area concentration of occupational employment to the national average concentration. A location quotient greater than one indicates the occupation has a higher share of employment than average, and a location quotient less than one indicates the occupation is less prevalent in the area than average.
Other OEWS estimates and related information:
May 2021 National Occupational Employment and Wage Estimates
May 2021 State Occupational Employment and Wage Estimates
May 2021 Metropolitan and Nonmetropolitan Area Occupational Employment and Wage Estimates
May 2021 National Industry-Specific Occupational Employment and Wage Estimates
Last Modified Date: March 31, 2022