
An official website of the United States government
An official website of the United States government
The .gov means it's official.
Federal government websites often end in .gov or .mil. Before sharing sensitive information,
make sure you're on a federal government site.
The site is secure.
The
https:// ensures that you are connecting to the official website and that any
information you provide is encrypted and transmitted securely.
December 2010
Most U.S. employment is found in urban settings: in 2009, approximately 86 percent of U.S. nonfarm wage and salary jobs were located in one of nearly 370 metropolitan areas, ranging in size from the New York City metropolitan area, with total employment of over 8 million, to Palm Coast, Fla., with total employment of about 16,000.
Click here to see these data in table format.
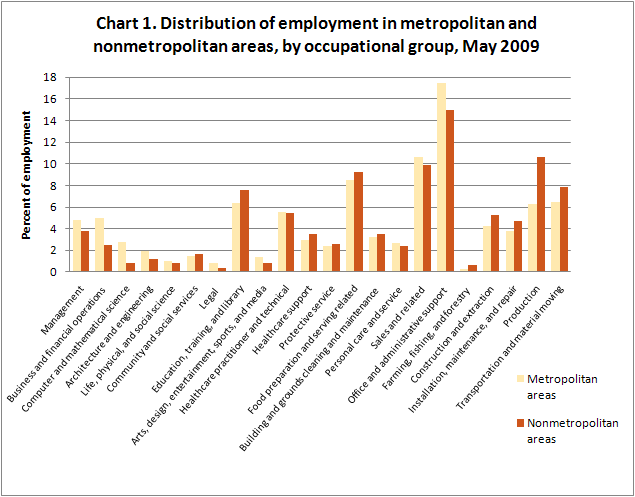
Metropolitan and nonmetropolitan areas differed not only in their shares of total employment, but also in the types of occupations they contained. Employment breakdowns by occupational group for metropolitan and nonmetropolitan areas are shown in chart 1. Compared to nonmetropolitan areas, metropolitan areas had higher employment concentrations in nearly all of the higher-paying occupational groups. For example, as a share of total employment, metropolitan areas had about twice as many legal and business and financial operations jobs, and more than three times as many computer and mathematical science jobs. Metropolitan areas also had higher employment shares of management; architecture and engineering; life, physical, and social science; and arts, design, entertainment, sports, and media occupations. Only one occupational group with above-average wages—education, training, and library occupations—had a higher employment share in nonmetropolitan areas than in metropolitan areas.
Production occupations made up about 10.6 percent of nonmetropolitan area employment, compared with 6.3 percent of employment in metropolitan areas. Nonmetropolitan areas also had higher employment shares of most of the other lower-paying occupational groups, including healthcare support; food preparation and serving related; farming, fishing, and forestry; and transportation and material moving occupations, although in many cases the differences were relatively small1. Personal care and service, sales and related, and office and administrative support occupations were the only lower-paying occupational groups with higher employment shares in metropolitan areas.
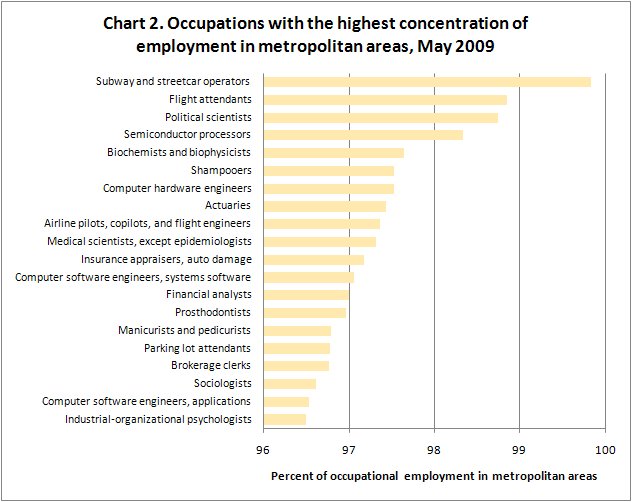
Some occupations were found almost exclusively in metropolitan areas. For example, nearly all subway and streetcar operators—99.8 percent—were located in metropolitan areas, and over 86 percent of employment in this occupation was found in metropolitan areas with employment of 1 million or more. Similarly, 98.7 percent of political scientists were employed in metropolitan areas, with approximately two-thirds located in a single metropolitan area, Washington, D.C.
Click here to see these data in table format.
Other occupations that were highly concentrated in metropolitan areas are shown in chart 2. Aside from political scientists, these included other social science occupations, such as sociologists and industrial-organizational psychologists. Four occupations related to insurance and finance had 96 percent or more of their employment in metropolitan areas: actuaries; insurance appraisers, auto damage; financial analysts; and brokerage clerks. Other occupations found almost entirely in metropolitan areas included computer hardware and software engineers, several transportation-related occupations, and two personal care and service occupations—shampooers, and manicurists and pedicurists. Like subway and streetcar operators and political scientists, several of these occupations were especially concentrated in the largest metropolitan areas: 70 percent or more of flight attendants; airline pilots, copilots, and flight engineers; and shampooers were reported in metropolitan areas with employment of 1 million or more.
Click here to see these data in table format.
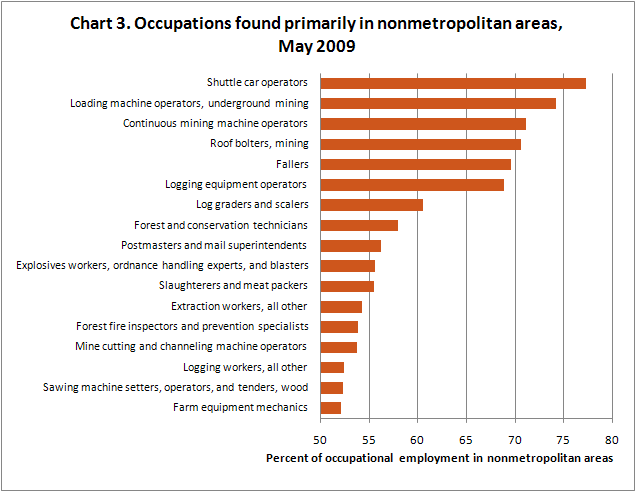
Although nonmetropolitan areas made up only about 14 percent of total U.S. employment, they contained the majority of employment in some occupations, shown in chart 3. Of the 17 occupations in the chart, 7 are related to mining and natural resource extraction, including shuttle car operators; underground mining loading machine operators; continuous mining machine operators; and mining roof bolters, each of which had over 70 percent of employment in nonmetropolitan areas. Most of the remaining occupations shown in the chart are related to logging or forestry, including fallers, logging equipment operators, and forest and conservation technicians. Nonmetropolitan areas also contained the majority of postmasters and mail superintendents, farm equipment mechanics, and two production occupations related to animal production and logging: slaughterers and meat packers and wood sawing machine setters, operators, and tenders.
Click here to see these data in table format.
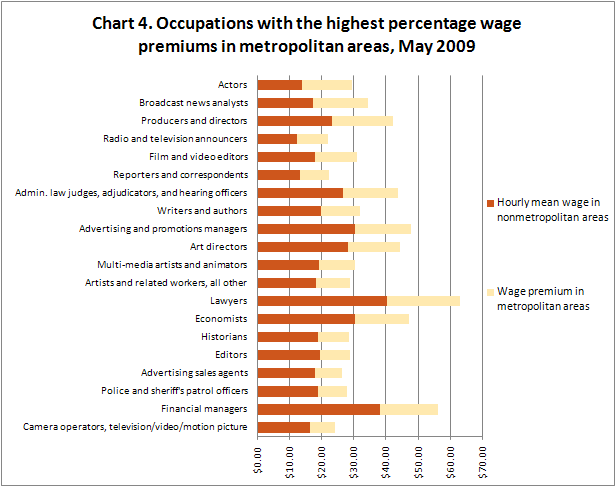
Metropolitan areas had higher wages than nonmetropolitan areas for all occupational groups except farming, fishing, and forestry, as well as for most detailed occupations. However, some occupations had especially high wages in metropolitan areas relative to nonmetropolitan areas, including those shown in chart 4.
For example, the hourly mean wage for actors was $13.81 in nonmetropolitan areas and $29.52 in metropolitan areas, a difference of 114 percent. Arts, design, entertainment, sports, and media occupations made up 11 of the 20 occupations in the chart. In addition to actors, these occupations included broadcast news analysts, producers and directors, and radio and television announcers. Other occupations with high wage premiums in metropolitan areas included three occupations related to law and law enforcement (lawyers; administrative law judges, adjudicators, and hearing officers; and police and sheriff’s patrol officers) and two related to advertising (advertising and promotions managers and advertising sales agents).
Click here to see these data in table format.
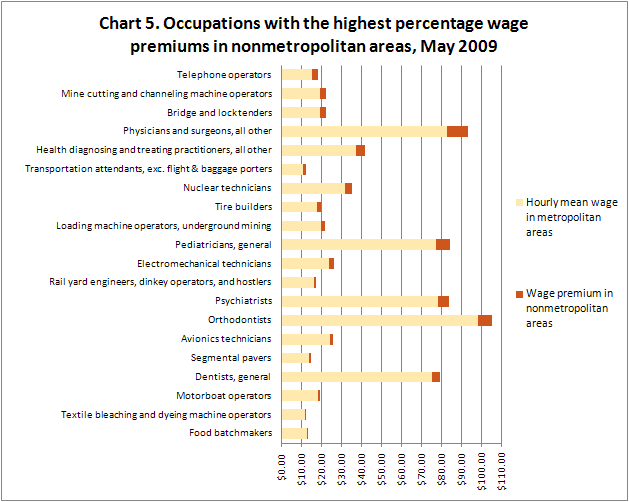
Occupations with the highest percentage wage premiums in nonmetropolitan areas are shown in chart 5. Compared with those shown in chart 4, the metropolitan/nonmetropolitan wage differences for these occupations were relatively small, ranging from nearly 18 percent for telephone operators to less than 5 percent for food batchmakers, and in some cases were not statistically significant.
Several healthcare practitioner occupations had higher wages in nonmetropolitan areas than in metropolitan areas, including general pediatricians, psychiatrists, and general dentists. Because these occupational categories include healthcare practitioners in training, such as medical residents, these data are consistent with a greater likelihood for teaching hospitals and dental schools to be located in metropolitan areas. Other occupations with higher wages in nonmetropolitan areas included three production occupations (tire builders, textile bleaching and dyeing machine operators, and food batchmakers) and two mining occupations (mine cutting and channeling machine operators and underground mining loading machine operators).
OES metropolitan area data are based on the Metropolitan Statistical Area definitions issued by the Office of Management and Budget; OES-defined nonmetropolitan areas contain the remainder of each state outside of the Metropolitan Statistical Areas. The aggregate metropolitan and nonmetropolitan area data presented here are based on a special tabulation performed for the purpose of this highlight. May 2009 OES data for individual metropolitan and nonmetropolitan areas, as well as national industry-specific estimates and national and state cross-industry estimates, are available from the OES home page. This highlight was prepared by Audrey Watson. For more information, please contact the OES program.
1 Because OES does not cover the majority of the agricultural sector, with the exception of logging and support activities for crop and animal production, OES data may tend to understate metropolitan/nonmetropolitan differences in employment of farming, fishing, and forestry occupations.
Last Modified Date: December 14, 2010