
An official website of the United States government
An official website of the United States government
The .gov means it's official.
Federal government websites often end in .gov or .mil. Before sharing sensitive information,
make sure you're on a federal government site.
The site is secure.
The
https:// ensures that you are connecting to the official website and that any
information you provide is encrypted and transmitted securely.
Employee Benefits provides comprehensive data collected as part of the National Compensation Survey. Data include estimates on the percentage of workers with access to and participating in employer provided benefit plans, as well as details of what those plans provide.
Percentage of civilian workers with access to paid leave benefits by establishment size, March 2025
Size of establishment
Personal leave
Sick leave
Vacations
Holidays
1 to 49 workers
36%
73%
71%
73%
50 to 99 workers
49%
77%
73%
72%
100 to 499 workers
61%
88%
83%
87%
500 workers or more
67%
91%
83%
86%
Access to defined contribution retirement plans
65% in 2025
![]()
Access to defined benefit retirement plans
24% in 2025
![]()
Access to paid holiday
80% in 2025
![]()
Access to paid vacation
77% in 2025
![]()
Access to paid sick leave
82% in 2025
![]()
Participating in medical care plans
48% in 2025
![]()
Access to wellness programs
48% in 2025
![]()
Access to defined contribution retirement plans
70% in 2025
![]()
Access to defined benefit retirement plans
14% in 2025
![]()
Access to paid holiday
81% in 2025
![]()
Access to paid vacation
80% in 2025
![]()
Access to paid sick leave
80% in 2025
![]()
Participating in medical care plans
45% in 2025
![]()
Access to wellness programs
46% in 2025
![]()
Access to defined contribution retirement plans
38% in 2025
![]()
Access to defined benefit retirement plans
86% in 2025
![]()
Access to paid holiday
68% in 2025
![]()
Access to paid vacation
61% in 2025
![]()
Access to paid sick leave
93% in 2025
![]()
Participating in medical care plans
67% in 2025
![]()
Access to wellness programs
64% in 2025
![]()
09/25/2025
Retirement benefits were available to 59 percent of private industry workers in establishments with less than 100 workers and 90 percent in establishments with 500 or more workers in March 2025.
HTML
|
PDF
|
RSS
|
Charts
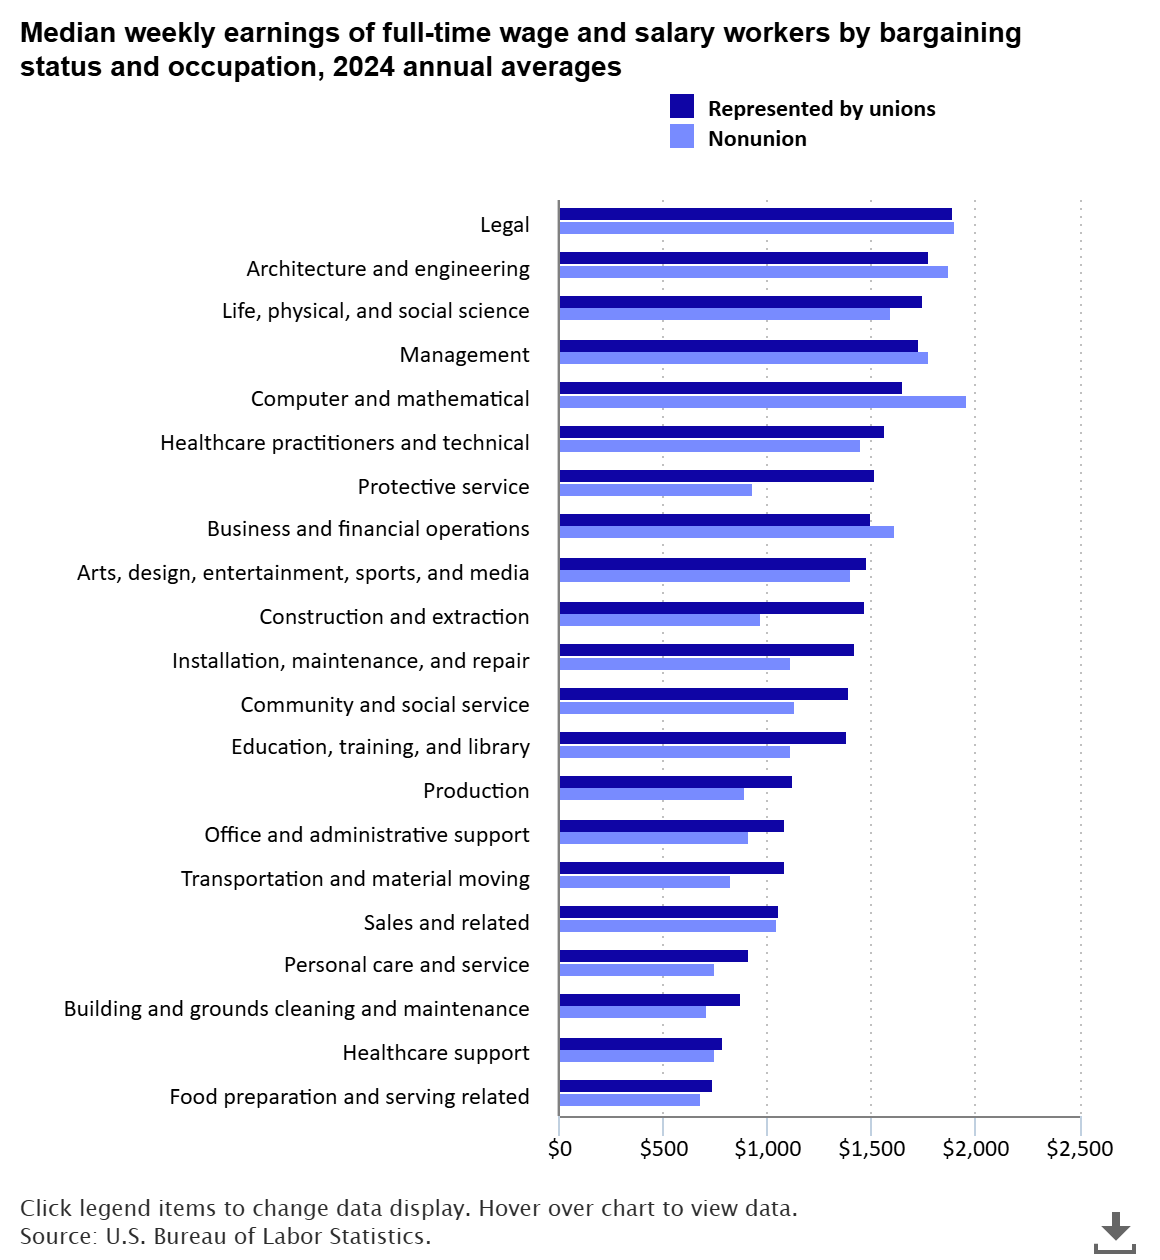
Labor unions celebrated the first Labor Day with a parade in 1882, and Congress declared it a federal holiday 12 years later. In recognition of labor unions and the federal holiday, let’s look at some wage and benefit data by bargaining status (that is, whether workers are represented by unions). read more »

This article follows the many changes to Bureau of Labor Statistics retirement income studies and shows the challenges of providing statistics on such a varied and frequently evolving topic. read more »

National Transportation Week, created in 1962 and celebrated from May 12–18 this year, recognizes those who build and operate our Nation’s transportation systems. Observance of the week sprung from National Defense Transportation Day which dates to 1957, a year after President Dwight D. Eisenhower signed the Federal-Aid Highway Act leading to the creation of the interstate highway system. read more »

The National Compensation Survey (NCS) produces two annual publications that provide a rich amount of information on retirement plans. How retirement plans differ between private industry workers and state and local government workers is a major point of interest. What type of plans are offered to workers? Are plan characteristics different or basically the same? read more »