
An official website of the United States government
An official website of the United States government
The .gov means it's official.
Federal government websites often end in .gov or .mil. Before sharing sensitive information,
make sure you're on a federal government site.
The site is secure.
The
https:// ensures that you are connecting to the official website and that any
information you provide is encrypted and transmitted securely.
This major group comprises the following occupations: Home Health Aides ; Psychiatric Aides ; Nursing Assistants ; Orderlies ; Occupational Therapy Assistants ; Occupational Therapy Aides ; Physical Therapist Assistants ; Physical Therapist Aides ; Massage Therapists ; Dental Assistants ; Medical Assistants ; Medical Equipment Preparers ; Medical Transcriptionists ; Pharmacy Aides ; Veterinary Assistants and Laboratory Animal Caretakers ; Phlebotomists ; Healthcare Support Workers, All Other
Employment estimate and mean wage estimates for this major group:
| Employment (1) | Employment RSE (3) |
Mean hourly wage |
Mean annual wage (2) |
Wage RSE (3) |
|---|---|---|---|---|
| 4,043,480 | 0.4 % | $14.65 | $30,470 | 0.2 % |
Percentile wage estimates for this major group:
| Percentile | 10% | 25% | 50% (Median) |
75% | 90% |
|---|---|---|---|---|---|
| Hourly Wage | $9.51 | $10.91 | $13.42 | $17.11 | $21.93 |
| Annual Wage (2) | $19,780 | $22,690 | $27,910 | $35,580 | $45,620 |
Industries with the highest published employment and wages for this occupation are provided. For a list of all industries with employment in this occupation, see the Create Customized Tables function.
Industries with the highest levels of employment in this occupation:
| Industry | Employment (1) | Percent of industry employment | Hourly mean wage | Annual mean wage (2) |
|---|---|---|---|---|
| Nursing Care Facilities (Skilled Nursing Facilities) | 662,630 | 40.38 | $13.26 | $27,590 |
| General Medical and Surgical Hospitals | 655,900 | 12.12 | $15.52 | $32,280 |
| Home Health Care Services | 502,010 | 37.06 | $11.90 | $24,760 |
| Offices of Physicians | 436,080 | 17.33 | $15.95 | $33,180 |
| Offices of Dentists | 305,310 | 33.29 | $18.15 | $37,750 |
Industries with the highest concentration of employment in this occupation:
| Industry | Employment (1) | Percent of industry employment | Hourly mean wage | Annual mean wage (2) |
|---|---|---|---|---|
| Nursing Care Facilities (Skilled Nursing Facilities) | 662,630 | 40.38 | $13.26 | $27,590 |
| Home Health Care Services | 502,010 | 37.06 | $11.90 | $24,760 |
| Offices of Dentists | 305,310 | 33.29 | $18.15 | $37,750 |
| Continuing Care Retirement Communities and Assisted Living Facilities for the Elderly | 263,540 | 29.66 | $12.16 | $25,300 |
| Offices of Other Health Practitioners | 188,230 | 22.47 | $19.32 | $40,190 |
Top paying industries for this occupation:
| Industry | Employment (1) | Percent of industry employment | Hourly mean wage | Annual mean wage (2) |
|---|---|---|---|---|
| Other Schools and Instruction | 250 | 0.06 | $26.13 | $54,350 |
| Civic and Social Organizations | 220 | 0.06 | $23.44 | $48,760 |
| Machinery, Equipment, and Supplies Merchant Wholesalers | (8) | (8) | $22.86 | $47,550 |
| Other Financial Investment Activities | (8) | (8) | $21.99 | $45,740 |
| Educational Support Services | 480 | 0.28 | $21.42 | $44,540 |
States and areas with the highest published employment, location quotients, and wages for this occupation are provided. For a list of all areas with employment in this occupation, see the Create Customized Tables function.
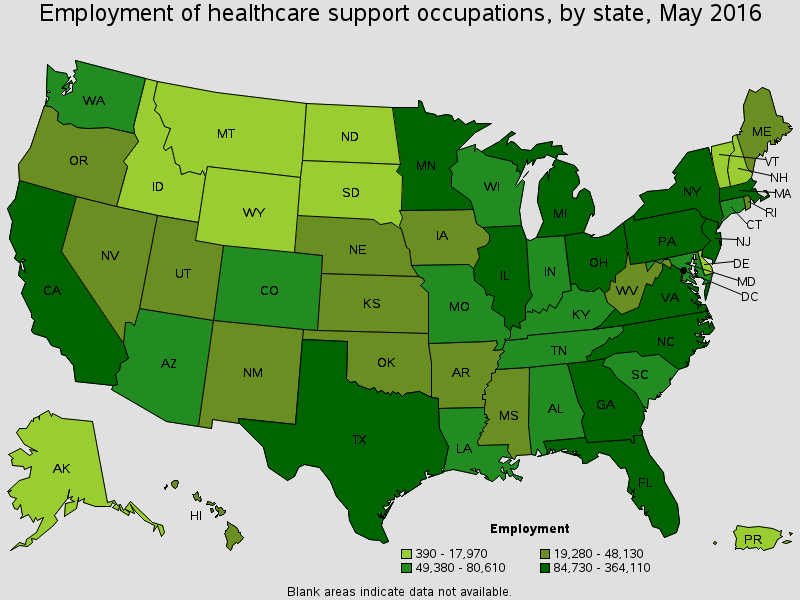
States with the highest employment level in this occupation:
| State | Employment (1) | Employment per thousand jobs | Location quotient (9) | Hourly mean wage | Annual mean wage (2) |
|---|---|---|---|---|---|
| New York | 364,110 | 40.02 | 1.39 | $14.68 | $30,540 |
| California | 351,250 | 22.00 | 0.76 | $17.51 | $36,410 |
| Texas | 312,950 | 26.64 | 0.93 | $13.93 | $28,980 |
| Florida | 235,950 | 28.70 | 1.00 | $14.25 | $29,630 |
| Ohio | 199,500 | 37.37 | 1.30 | $13.34 | $27,740 |
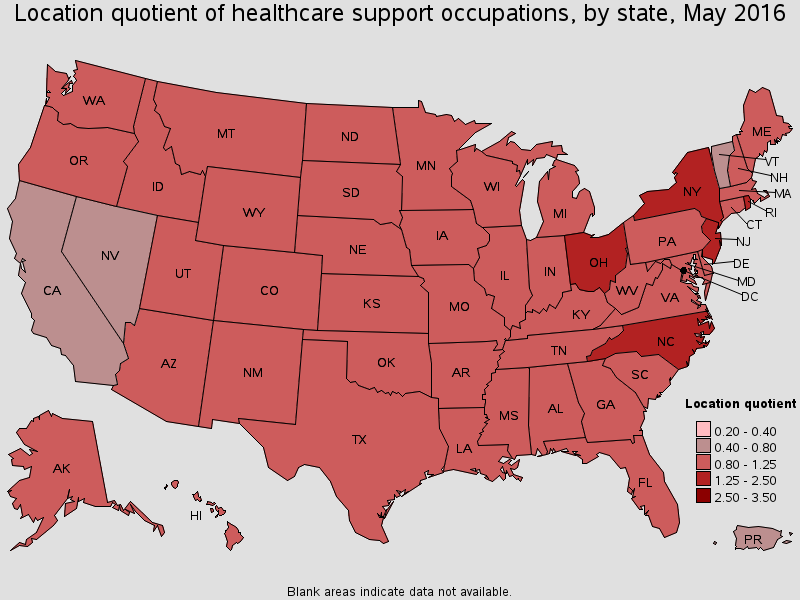
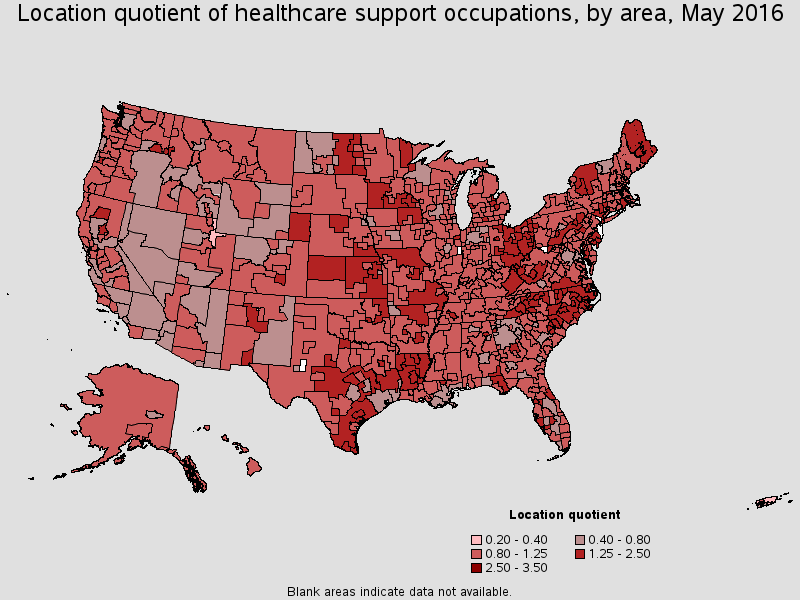
States with the highest concentration of jobs and location quotients in this occupation:
| State | Employment (1) | Employment per thousand jobs | Location quotient (9) | Hourly mean wage | Annual mean wage (2) |
|---|---|---|---|---|---|
| Rhode Island | 20,660 | 43.47 | 1.51 | $15.39 | $32,010 |
| New York | 364,110 | 40.02 | 1.39 | $14.68 | $30,540 |
| New Jersey | 150,560 | 38.07 | 1.32 | $14.84 | $30,870 |
| Ohio | 199,500 | 37.37 | 1.30 | $13.34 | $27,740 |
| North Carolina | 153,090 | 36.18 | 1.26 | $12.80 | $26,610 |
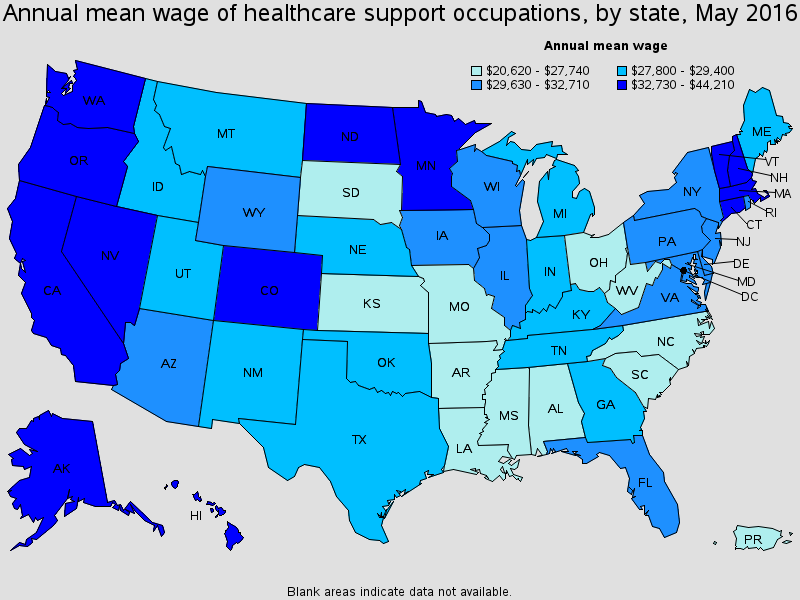
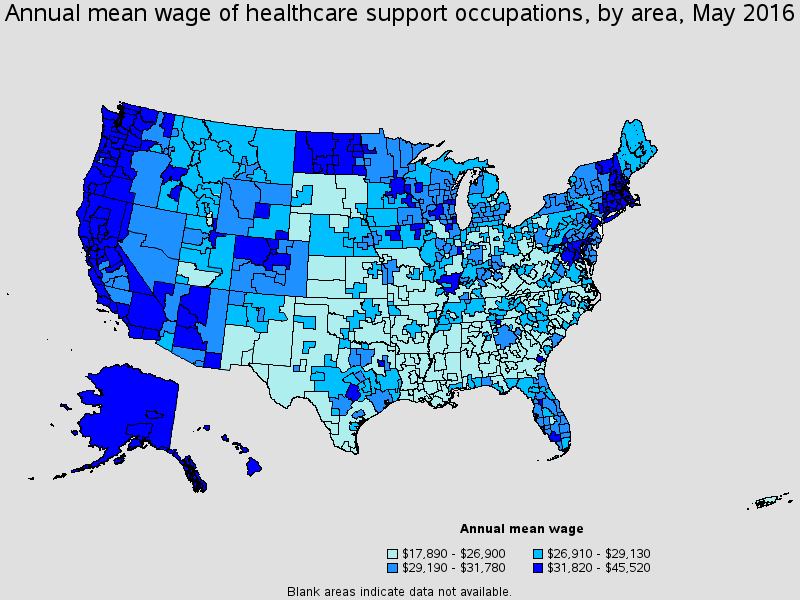
Top paying States for this occupation:
| State | Employment (1) | Employment per thousand jobs | Location quotient (9) | Hourly mean wage | Annual mean wage (2) |
|---|---|---|---|---|---|
| Alaska | 8,120 | 25.10 | 0.87 | $21.26 | $44,210 |
| California | 351,250 | 22.00 | 0.76 | $17.51 | $36,410 |
| Washington | 77,260 | 25.19 | 0.87 | $17.08 | $35,530 |
| Oregon | 48,130 | 26.88 | 0.93 | $16.88 | $35,110 |
| Connecticut | 49,380 | 29.63 | 1.03 | $16.73 | $34,800 |
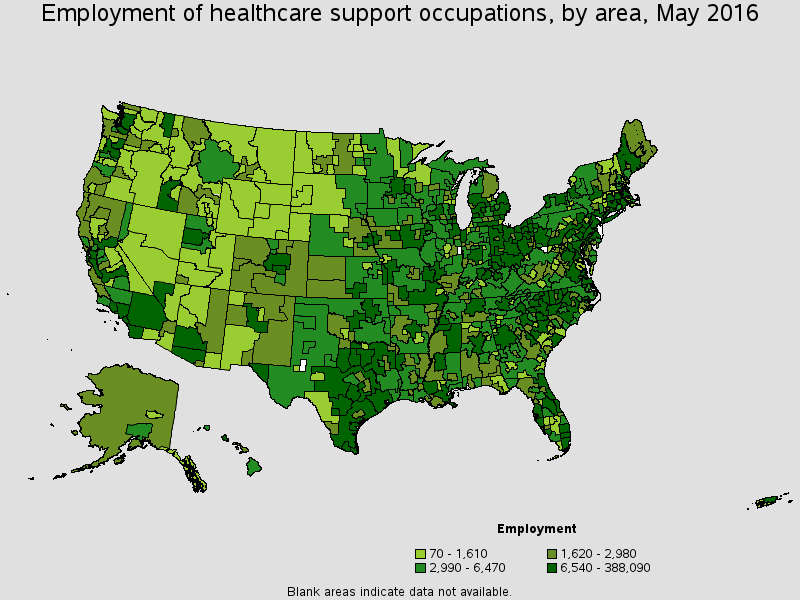
Metropolitan areas with the highest employment level in this occupation:
| Metropolitan area | Employment (1) | Employment per thousand jobs | Location quotient (9) | Hourly mean wage | Annual mean wage (2) |
|---|---|---|---|---|---|
| New York-Jersey City-White Plains, NY-NJ Metropolitan Division | 300,060 | 45.56 | 1.58 | $14.33 | $29,810 |
| Chicago-Naperville-Arlington Heights, IL Metropolitan Division | 103,170 | 28.35 | 0.98 | $14.85 | $30,880 |
| Los Angeles-Long Beach-Glendale, CA Metropolitan Division | 96,130 | 22.78 | 0.79 | $17.09 | $35,540 |
| Houston-The Woodlands-Sugar Land, TX | 64,190 | 21.87 | 0.76 | $14.18 | $29,500 |
| Dallas-Plano-Irving, TX Metropolitan Division | 59,520 | 24.49 | 0.85 | $15.27 | $31,760 |
| Atlanta-Sandy Springs-Roswell, GA | 54,340 | 21.28 | 0.74 | $14.47 | $30,090 |
| Minneapolis-St. Paul-Bloomington, MN-WI | 50,460 | 26.42 | 0.92 | $16.53 | $34,390 |
| Boston-Cambridge-Newton, MA NECTA Division | 50,110 | 27.79 | 0.97 | $17.34 | $36,070 |
| Phoenix-Mesa-Scottsdale, AZ | 46,620 | 24.09 | 0.84 | $15.39 | $32,020 |
| Washington-Arlington-Alexandria, DC-VA-MD-WV Metropolitan Division | 46,000 | 18.47 | 0.64 | $16.18 | $33,660 |
Metropolitan areas with the highest concentration of jobs and location quotients in this occupation:
| Metropolitan area | Employment (1) | Employment per thousand jobs | Location quotient (9) | Hourly mean wage | Annual mean wage (2) |
|---|---|---|---|---|---|
| Brownsville-Harlingen, TX | 9,400 | 68.29 | 2.37 | $10.15 | $21,110 |
| McAllen-Edinburg-Mission, TX | 15,330 | 61.40 | 2.13 | $10.44 | $21,720 |
| Goldsboro, NC | 2,390 | 58.81 | 2.04 | $13.13 | $27,320 |
| Greenville, NC | 4,290 | 57.97 | 2.01 | $12.68 | $26,370 |
| Bloomsburg-Berwick, PA | 2,320 | 55.02 | 1.91 | $15.08 | $31,370 |
| Peabody-Salem-Beverly, MA NECTA Division | 5,220 | 54.98 | 1.91 | $15.90 | $33,070 |
| Pueblo, CO | 3,160 | 54.97 | 1.91 | $14.50 | $30,160 |
| Bay City, MI | 1,860 | 53.42 | 1.85 | $13.17 | $27,400 |
| Sebring, FL | 1,310 | 52.29 | 1.82 | $12.83 | $26,700 |
| Hickory-Lenoir-Morganton, NC | 7,710 | 51.88 | 1.80 | $12.59 | $26,190 |
Top paying metropolitan areas for this occupation:
| Metropolitan area | Employment (1) | Employment per thousand jobs | Location quotient (9) | Hourly mean wage | Annual mean wage (2) |
|---|---|---|---|---|---|
| Anchorage, AK | 4,710 | 26.74 | 0.93 | $21.89 | $45,520 |
| Fairbanks, AK | 700 | 18.75 | 0.65 | $20.95 | $43,570 |
| San Francisco-Redwood City-South San Francisco, CA Metropolitan Division | 15,950 | 14.95 | 0.52 | $20.70 | $43,060 |
| San Jose-Sunnyvale-Santa Clara, CA | 17,440 | 16.68 | 0.58 | $20.33 | $42,290 |
| Santa Rosa, CA | 4,600 | 23.73 | 0.82 | $20.05 | $41,700 |
| San Rafael, CA Metropolitan Division | 2,390 | 21.43 | 0.74 | $19.95 | $41,500 |
| Oakland-Hayward-Berkeley, CA Metropolitan Division | 25,230 | 23.27 | 0.81 | $19.23 | $40,000 |
| Vallejo-Fairfield, CA | 3,260 | 25.35 | 0.88 | $18.63 | $38,750 |
| Sacramento--Roseville--Arden-Arcade, CA | 19,700 | 21.58 | 0.75 | $18.54 | $38,570 |
| Napa, CA | 1,860 | 26.35 | 0.92 | $18.34 | $38,140 |
Nonmetropolitan areas with the highest employment in this occupation:
| Nonmetropolitan area | Employment (1) | Employment per thousand jobs | Location quotient (9) | Hourly mean wage | Annual mean wage (2) |
|---|---|---|---|---|---|
| North Northeastern Ohio non-metropolitan area (non-contiguous) | 12,770 | 38.67 | 1.34 | $13.17 | $27,400 |
| Southeast Coastal North Carolina nonmetropolitan area | 12,630 | 50.92 | 1.77 | $11.33 | $23,560 |
| Piedmont North Carolina nonmetropolitan area | 12,100 | 47.45 | 1.65 | $11.98 | $24,910 |
| North Texas nonmetropolitan area | 7,940 | 29.80 | 1.03 | $12.57 | $26,140 |
| Southern Ohio non-metropolitan area | 7,680 | 49.17 | 1.71 | $12.65 | $26,310 |
Nonmetropolitan areas with the highest concentration of jobs and location quotients in this occupation:
| Nonmetropolitan area | Employment (1) | Employment per thousand jobs | Location quotient (9) | Hourly mean wage | Annual mean wage (2) |
|---|---|---|---|---|---|
| Far East North Dakota nonmetropolitan area | 1,340 | 53.47 | 1.86 | $15.99 | $33,260 |
| Southeast Coastal North Carolina nonmetropolitan area | 12,630 | 50.92 | 1.77 | $11.33 | $23,560 |
| Eastern Ohio nonmetropolitan area | 6,760 | 49.87 | 1.73 | $12.00 | $24,960 |
| Southern Ohio non-metropolitan area | 7,680 | 49.17 | 1.71 | $12.65 | $26,310 |
| Piedmont North Carolina nonmetropolitan area | 12,100 | 47.45 | 1.65 | $11.98 | $24,910 |
Top paying nonmetropolitan areas for this occupation:
| Nonmetropolitan area | Employment (1) | Employment per thousand jobs | Location quotient (9) | Hourly mean wage | Annual mean wage (2) |
|---|---|---|---|---|---|
| Nantucket Island and Martha's Vineyard nonmetropolitan area | 230 | 13.43 | 0.47 | $21.27 | $44,240 |
| Balance of Alaska nonmetropolitan area | 1,800 | 24.37 | 0.85 | $20.70 | $43,050 |
| Southeast Alaska nonmetropolitan area | 890 | 25.43 | 0.88 | $19.15 | $39,830 |
| Southwest Massachusetts nonmetropolitan area | 210 | 23.49 | 0.82 | $19.14 | $39,820 |
| Northwest Colorado nonmetropolitan area | 1,660 | 14.45 | 0.50 | $18.42 | $38,320 |
These estimates are calculated with data collected from employers in all industry sectors, all metropolitan and nonmetropolitan areas, and all states and the District of Columbia.
The percentile wage estimate is the value of a wage below which a certain percent of workers fall. The median wage is the 50th percentile wage estimate--50 percent of workers earn less than the median and 50 percent of workers earn more than the median. More about percentile wages.
(1) Estimates for detailed occupations do not sum to the totals because the totals include occupations not shown separately. Estimates do not include self-employed workers.
(2) Annual wages have been calculated by multiplying the hourly mean wage by a "year-round, full-time" hours figure of 2,080 hours; for those occupations where there is not an hourly wage published, the annual wage has been directly calculated from the reported survey data.
(3) The relative standard error (RSE) is a measure of the reliability of a survey statistic. The smaller the relative standard error, the more precise the estimate.
(8) Estimate not released.
(9) The location quotient is the ratio of the area concentration of occupational employment to the national average concentration. A location quotient greater than one indicates the occupation has a higher share of employment than average, and a location quotient less than one indicates the occupation is less prevalent in the area than average.
Other OES estimates and related information:
May 2016 National Occupational Employment and Wage Estimates
May 2016 State Occupational Employment and Wage Estimates
May 2016 Metropolitan and Nonmetropolitan Area Occupational Employment and Wage Estimates
May 2016 National Industry-Specific Occupational Employment and Wage Estimates
Last Modified Date: March 31, 2017