
An official website of the United States government
An official website of the United States government
The .gov means it's official.
Federal government websites often end in .gov or .mil. Before sharing sensitive information,
make sure you're on a federal government site.
The site is secure.
The
https:// ensures that you are connecting to the official website and that any
information you provide is encrypted and transmitted securely.
The annual bulletin Employment and Wages contains employment and wage data from the Quarterly Census of Employment and Wages (QCEW) program aggregated by industry at the national, state, and county levels.
This web-only publication, Employment and Wages Online, is the successor to the annual print bulletin, Employment and Wages. The 2008 issue of the Employment and Wages bulletin was the final edition to be issued on paper in March 2010.
The graphs that appeared in the print publication are no longer produced for the web-only publication. The newest improvement to the E&W comes in the form of interactive tables. The replacement tables include monthly employment and quarterly establishment and wage data for more series. The new tables include wage information for size data tables, which had not been available in the old tables. Questions regarding these data can be addressed to the Quarterly Census of Employment and Wages (QCEW) program by calling (202) 691-6567 or by using any of the channels provided on the QCEW contact page.
The quarterly County Employment and Wages news releases produced by the QCEW program as well as PDFs of all 2019 QCEW news releases can be found at the QCEW news release archive. County Employment and Wages news releases present employment and wages by county and are released within 5 months after the end of each referenced quarter. With continuous process improvements, the QCEW is now on an accelerated schedule to release data earlier than in previous years. All data, at each level of geography, can be found at QCEW databases. All tables in this publication are available as PDFs on the above Web site. Questions regarding these data can be addressed to the QCEW program by calling (202) 691-6567 or by e-mail.
Business Employment Dynamics (BED) news releases present gross job gains and losses and are released approximately 7 months after the reference quarter. Questions about BED data can be directed to the information line at (202) 691-6467 or by e-mail.
Material in this publication is in the public domain and, with appropriate credit, may be reproduced without permission. This information is available to sensory-impaired individuals on request. Voice phone: (202) 691-5200; Federal Relay Service: 1 (800) 877-8339.
The following members of the U.S. Bureau of Labor Statistics Office of Employment and Unemployment Statistics prepared this publication under the Division of Administrative Statistics and Labor Turnover, David M. Talan, Chief; Jennifer Cruz, Imani Drayton-Hill, Kathryn Evans, Karina Galindo, Drake Gibson, David A. Ivory, Spencer A. Jobe, Keith G. Keel, Jay Miller, Masa Shirako, Trent Thompson, and Ric Wise of the Current Data Analysis Branch; David R. H. Hiles, Chief; Monique Ortiz, Akbar Sadeghi, and Eric Simants of the State Operations and Frame Research Branch; Kevin Cooksey, Chief.
Data were prepared and processed by the following members of the Division of Business Establishment Systems (DBES), Shirley Tsai (Acting) and Michael Dorsey (Acting), Mangala Kuppa (Prior), Chief; Raymond Brown, Noel Cox, Ali Latif, Reuel Paredes, William Plaskie, Carl Smahaj, Natasha Tsyryulnikova, Pat Walker, and Shane Warren of the DBES Procedures Branch, Usha Gundlapudi, Chief; Omar Bonilla, Margarita Gershkovich, Andrea Jones, David Lambe, Hyunjoo Reed, and Davis Truong of the Database Systems Branch, Mike Dorsey, Chief; Vladimir Kogan, and Henggao Cai of the ES-202 Systems Branch, Michael Dorsey (Acting), Chief.
The Bureau of Labor Statistics (BLS) wishes to express its appreciation to U.S. employers for their continued cooperation in providing establishment-level data on the Multiple Worksite Report (MWR) form. This information for each business location is critical to the accurate distribution of employment and wage data to the appropriate geographical area and specific industry. If businesses did not provide this level of detail, the quality of the data would be adversely affected.
State workforce agencies that collect data from employers also play a primary role in this ongoing program. The efforts of staff at these agencies in verifying, editing, and supplying high-quality data to BLS are essential to the accuracy of this bulletin and are appreciated. We also would like to express our gratitude for the dedicated work of the BLS staff in the Electronic Data Interchange Center and in the regional offices for their ongoing efforts to improve the quality of data provided in this bulletin.
Data contained in this publication represent the complete and final count of employment and wages for workers covered by State Unemployment Insurance (UI) laws and the Unemployment Compensation for Federal Employees (UCFE) program during 2019 for the 50 States, the District of Columbia, Puerto Rico, and the U.S. Virgin Islands. Data are aggregated by geography at the county, metropolitan statistical area, combined statistical area, State, and national levels; by ownership under private industry or Federal, State, or Local government; and by industry as defined under the 2017 North American Industry Classification System (NAICS). County, State, and National level aggregates appear in the tables in this publication. These data are the product of a Federal-State cooperative program, the Quarterly Census of Employment and Wages (QCEW), also referenced as ES-202. State workforce agencies compile the data for both private- and public-sector workers from reports filed by employers each quarter and report it to the BLS.
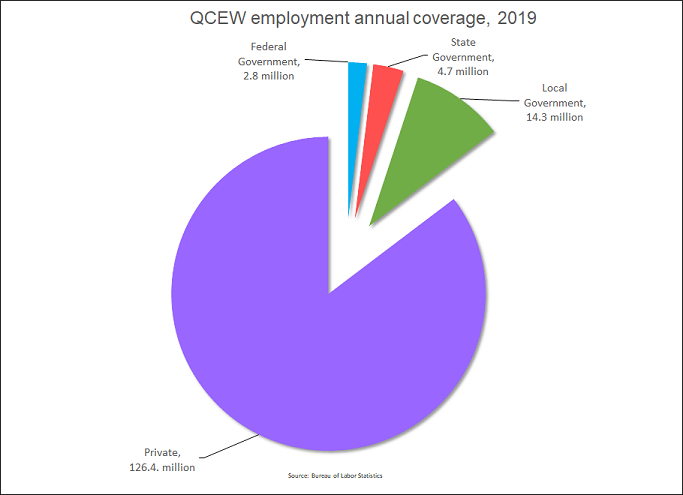
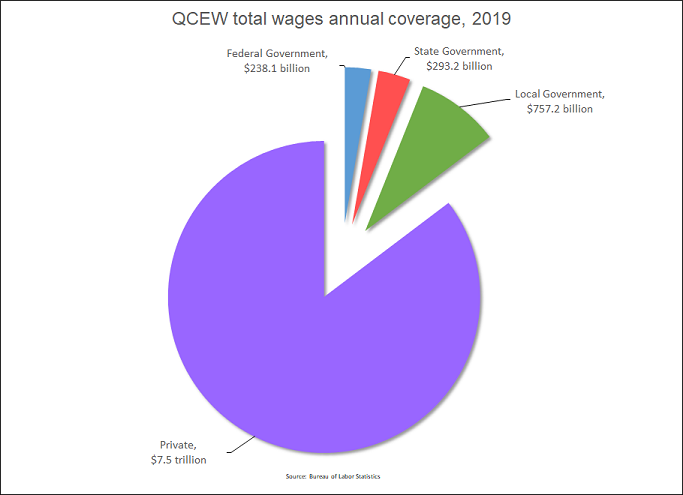
In 2019, BLS derived totals of 10.2 million establishments, 148.1 million employed, and $8.8 trillion in wages, from reports submitted to State workforce agencies by every employer covered by UI or by UCFE. Of these employers, those in private industry provided State workforce agencies with quarterly tax reports on monthly employment, quarterly total and taxable wages, and contributions for an average of 126.4 million wage and salary employees in approximately 9.9 million business establishments. Similar reports of monthly employment and quarterly wages were submitted by the Federal Government for 2.8 million civilian employees, by State governments for 4.7 million employees, and by Local governments for 14.3 million employees. UI-covered employment reported by these sources constituted a virtual census (97.1 percent) of employees on nonfarm payrolls. The principal exclusions from UI and UCFE coverage are cited in Characteristics and Uses of the Data, which follows this introduction. BLS presents data by ownership, industry, and State. These data include the average number of establishments, average annual employment, total wages, and annual and average weekly wages per employee. Additionally, the Bureau publishes national employment and wage totals for 11 supersectors, 20 sectors, and all 1,057 six-digit NAICS industries. County-level data include number of establishments, employment, and average weekly wage. Private-sector data are presented by State, from the total private ownership level to the 6-digit NAICS industries. Private-sector data also are presented by national gross job gains and losses. State, local, and Federal Government data are detailed for selected industries.
QCEW data for 2017 forward are classified according to the NAICS 2017. For more information on the classification systems used by the QCEW program, please refer to the QCEW Industry Classification page.
The U.S. Bureau of Labor Statistics compiled the data in this publication as part of the operations of its Quarterly Census of Employment and Wages (QCEW) program. Data are derived from the quarterly tax reports submitted to State workforce agencies by employers, subject to State UI laws and from Federal agencies subject to the Unemployment Compensation for Federal Employees (UCFE) program. Each quarter, State agencies edit and process the data and send the information to the Bureau's national office in Washington, DC. The QCEW program provides the most complete set of monthly employment and quarterly wage data by 6-digit industry at the national, State, combined metropolitan statistical area, metropolitan statistical area, and county levels. Data have broad economic significance for the evaluation of labor market trends and major industry developments, for data comparisons over time, and for interindustry comparability.
The employer reports that form the input to the QCEW are required by the Federal Unemployment Insurance Tax Act and its extensions. Initially, the Federal Unemployment Insurance Tax Act (1938) applied only to firms employing at least 8 persons for a minimum of 20 weeks in a calendar year and excluded certain categories of workers. Amendments to Title XV of the Social Security Act established the UCFE program, which extended coverage to Federal civilian employees effective January 1, 1955, and to workers in firms employing from four to seven workers effective January 1, 1956.
Federal legislation, effective January 1, 1972, extended coverage of State UI systems to firms employing one worker or more in 28 States and expanded some of the statutory coverage provisions. (The remaining States previously had extended coverage to these small employers.) The 1972 legislation also brought coverage to employees of State hospitals, colleges, and universities.
The Federal Unemployment Compensation Amendments of 1976 incorporated major changes in State UI laws effective January 1, 1978. Under the Federal Unemployment Tax Act (FUTA), States expanded coverage to include nearly all remaining State and local government employees, employees of nonprofit elementary and secondary schools, and certain domestic workers. Some States began implementing the amendments as early as 1976. The law also brought the U.S. Virgin Islands under the UI system.
The 1976 amendments covered agricultural labor if performed for an employer who, in any calendar quarter in the current or preceding calendar year, paid cash remuneration of $20,000 or more to individuals employed in agricultural labor. The 1976 amendments also apply to employers who, on each of some 20 days in 20 different weeks during the current or preceding calendar year, employed at least 10 individuals in agricultural labor.
Under a 1981 Supreme Court ruling, schools affiliated with religious organizations are not required to be covered under the UI system. Many of these schools, however, continue to cover their employees on a voluntary basis. Special provisions for railroad workers are made through the Railroad Unemployment Insurance Act. Data for workers covered under the Railroad Retirement Board and for those covered under the Unemployment Compensation for Ex-Servicemen (UCX) program are excluded from the tables in this publication.
In a number of States, certain types of nonprofit employers, such as religious organizations, are given a choice of coverage or exclusion. Under FUTA, all States must cover nonprofits that employ four or more workers. Some States have extended coverage to nonprofits employing one or more workers. Details on coverage laws are provided in Comparison of State Unemployment Insurance Laws, available on request from the Employment and Training Administration of the U.S. Department of Labor, www.doleta.gov.
While coverage is largely consistent, comparisons of data from one State to another should take into consideration the differences in UI laws among States. In addition, when UI-covered private-industry employment data are compared directly with other employment series, the coverage exclusions should be taken into account. See Table A under Employment (Coverage Exclusions) for details.
For more detailed information about UI history in QCEW, please see the Federal Unemployment Insurance Employment Coverage page.
Employment and wage data developed in the QCEW program have been classified by industry since 1938. Data presented in this publication are classified in accordance with the 2017 North American Industry Classification System (NAICS). It is the product of a cooperative effort on the part of the statistical agencies of the United States, Canada, and Mexico.
An industrial code, based on a description provided by the employer on a questionnaire, is assigned to each establishment by the State workforce agency. If a private or government employer conducts different activities at various establishments or installations, separate industrial codes are assigned, to the extent possible, to each establishment.
To ensure the highest possible quality of data, State workforce agencies verify and update, if necessary, the NAICS, location, and ownership classifications of virtually all establishments on a 3-year cycle. Information for government units in the public administration sector, however, is verified less frequently. Each year, changes in establishment classification codes resulting from the verification process are introduced with the data reported for the first quarter.
Beginning in 2017, QCEW data are classified under the NAICS 2017 system. For more information about the industrial classification system for a given reference period in QCEW, see the QCEW Industry page.
In general, QCEW monthly employment data represent the number of covered workers who worked during, or received pay for, the pay period that included the 12th day of the month. Virtually all workers are reported in the State in which their jobs are located.
Covered private-industry employment includes most corporate officials, executives, supervisory personnel, professionals, clerical workers, wage earners, piece-workers, and part-time workers. Persons on paid sick leave, paid holiday, paid vacation, and the like are also included. Persons on the payroll of more than one firm during the period are counted by each UI-subject employer, if they meet the employment definition noted previously. Workers are counted even though, in the latter months of the year, their wages may not be subject to UI tax.
It excludes proprietors, the unincorporated self-employed, unpaid family members, and certain farm and domestic workers. The employment count also excludes workers who earned no wages during the entire applicable pay period because of work stoppages, temporary layoffs, illness, or unpaid vacations.
Employment at all Federal agencies for any given month is based on the number of persons who worked during, or received pay for, the pay period that included the 12th of the month. Employment data reported for Federal civilian employees are a byproduct of the operations of State workforce agencies in administering the provisions of Title XV of the Social Security Act, the UCFE program. Federal employment data are based on reports of monthly employment and quarterly wages submitted each quarter to State agencies for all Federal installations with employees covered by the Act, except for certain national security agencies, which are omitted for security reasons.
| Group | Number Excluded (in millions) | Number Included (in millions) |
|---|---|---|
Wage and salary agricultural workers |
0.4
|
1.3
|
Self-employed agricultural workers1 |
0.7
|
Not covered
|
Self-employed nonagricultural workers1 |
8.8
|
Not covered
|
Domestic workers |
0.5
|
0.3
|
Unpaid family workers1 |
0.1
|
Not covered
|
State and local government workers |
0.8
|
18.9
|
Railroad workers |
0.2
|
<0.001
|
1These are out-of-scope groups, according to QCEW criteria.
Covered employers in most States report total compensation paid during the calendar quarter, regardless of when the services were performed. A few State laws, however, specify that wages be reported for, or be based on, the period during which services are performed, rather than for the period during which compensation is paid. Under most State laws or regulations, wages include bonuses, stock options, severance pay, the cash value of meals and lodging, tips and other gratuities, and, in some States' employer contributions to certain deferred compensation plans, such as 401(k) plans.
Covered employer contributions for old-age, survivors, and disability insurance; health insurance; UI; workers' compensation; and private pension and welfare funds are not reported as wages. Employee contributions for the same purposes, however, as well as money withheld for income taxes, union dues, and so forth are reported, even though they are deducted from the worker's gross pay.
Average annual wages per employee for any given industry are computed by dividing total annual wages by annual average employment. A further division by 52 yields average weekly wages per employee. Annual pay data only approximate annual earnings, because an individual may not be employed by the same employer all year or may work for more than one employer at a time.
Average weekly or annual pay is affected by the ratio of full-time to part-time workers, as well as by the numbers of individuals in high- and low-paying occupations. When comparing average pay levels among States and industries, data users should take these factors into consideration. For example, industries characterized by high proportions of part-time workers will show average weekly wage levels appreciably less than the weekly pay levels of regular full-time employees in these industries. The opposite is true of industries with low proportions of part-time workers and of industries that typically schedule heavy weekend and overtime work. Average wage data also may be influenced by work stoppages, labor turnover, retroactive payments, seasonal factors, and bonus payments.
Taxable wages and contributions data in QCEW are related to each state’s management of all employers’ activity within the state’s Unemployment Insurance (UI) system. A portion of each employee’s total wages are subject to unemployment taxation each quarter. A tax rate is applied to that portion of wages, resulting in contributions due from the employer to the state’s UI trust fund. Each quarter, employers report the aggregate of their taxable wages and contributions to the state UI agency. This information is passed on to QCEW. However, QCEW is not involved in the collection, calculation, or enforcement of the direct taxable wages or contributions for each specific employer. QCEW aggregates the received taxable wages and contributions microdata by area, industry, ownership, and size (size data for 1st quarter only) for macrodata outputs each quarter. Taxable wages and contributions data are available via QCEW downloadable data files.
More information about taxable wages and contributions can be found by using Unemployment Insurance Tax Topic resources from the US Department of Labor Employment and Training Administration (US DOL-ETA), or by contacting the US DOL-ETA Unemployment Insurance office directly. Additionally, for state information related to these topics, please contact each state’s employment security agency, starting with information available at https://www.dol.gov/agencies/eta/regions.
An establishment is an economic unit, such as a farm, mine, factory, or store that produces goods or provides services. It is typically at a single physical location and engaged in one, or predominantly one, type of economic activity for which a single industrial classification may be applied. Occasionally, a single physical location encompasses two or more distinct and significant activities. Each activity is reported as a separate establishment, if separate records are kept, and the various activities are classified under different NAICS industries.
Most employers have only one establishment; thus, the establishment is the predominant reporting unit or statistical entity for reporting employment and wage data. Most employers who operate more than one establishment in a State file a Multiple Worksite Report (MWR) each quarter, in addition to their quarterly UI report. The MWR form is used to collect separate employment and wage data for each of the employer's establishments. Such data are not detailed on the UI report. Some employers with two or more very small establishments do not file an MWR. If the total employment in an employer's secondary establishments (all establishments other than the largest) is 10 or less, the employer generally files a consolidated report for all establishments. Also, some employers either cannot, or will not, report at the establishment level and, thus, aggregate establishments into one consolidated unit, or possibly several units, though not at the establishment level.
Before 1991, employers provided covered employment and wage data on a reporting unit basis. Reporting unit data typically furnished detail only for different county locations or industrial operations within a State. A nonstandard form, similar in concept to the MWR and called the Statistical Supplement, was used by States to collect these county industry data. Although reporting units were, for the most part, individual establishments, employers could provide a summary of their employment and wage data for multiple establishments within a county that were conducting the same type of industrial activity. For example, a fast-food business might have submitted a single report that covered all of its operations within a county prior to 1991; on the MWR, the employer reports employment and wage data for each location. The MWR substantially enhanced the accuracy of the QCEW data after 1991 and allowed the QCEW data to be a better sample frame for other programs.
For government, the reporting unit is the installation: a single location at which a department, agency, or other government body has civilian employees. Federal agencies follow slightly different criteria than do private employers, when breaking down their reports by installation. They are permitted to combine as a single statewide unit all installations with 10 or fewer workers, if those installations belong to the same sub-departmental unit. Reports from Cabinet-level departments are not aggregated to a department-wide level. Departments submit separate reports for each bureau or agency (terminology for sub-departmental units may differ) within a given department. Independent agencies report on an agency-wide basis. As a result of these reporting rules, the number of reporting units is always larger than the number of employers (or government agencies), but smaller than the number of actual establishments (or installations).
Data reported for the first quarter of the year were tabulated into size categories in Tables 3 and 4, ranging from worksites with few employees to those with 1,000 or more employees. The size category is determined by the establishment's March employment level. It is important to note that data for each establishment of a multi-establishment firm are tabulated separately into the appropriate size category. The total employment level of the reporting multi-establishment firm is not used in the size tabulation. For more information about size data available from QCEW, please see the QCEW size page.
In accordance with BLS Confidentiality policy, data reported under a promise of confidentiality are not published in an identifiable way and are used only for specified statistical purposes. BLS withholds the publication of UI-covered employment and wage data for any industry level when necessary to protect the identity of cooperating employers. Totals at the industry level for the States and the Nation include the undisclosed data suppressed within the detailed tables. However, these totals do not reveal the suppressed data.
For more information about Confidentiality concepts, as it relates to QCEW data disclosure, please see this document about Confidentiality and Data Disclosure.
To reduce the effect of the exclusion of data because of late reporting by covered private and government employers, State agencies impute employment and wages for such employers and include them in each quarterly report. Corrections to data that may be entered after a report is filed include replacement of imputations with reported data to the extent possible. Imputations are calculated at the individual establishment level, normally from historical data reported by the employer. Sometimes trends reported by employers in the same industry and information obtained from other sources also are used. If a report remains delinquent for more than one quarter and research shows that it is still active, the data for the establishment will again be imputed.
See our QCEW imputation methodology page for more information about these concepts.
For information about QCEW response rates, go to https://www.bls.gov/cew/response-rates/.
The BLS publishes three different establishment-based employment measures for any given quarter. Each of these measures-the QCEW, BED, and CES-makes use of the quarterly UI employment reports in producing data. Each measure, however, has a somewhat different universe of coverage and estimation procedure, and each produces a different publication. For a complete comparison of QCEW data with other related data series, please see the QCEW Handbook of Methods.
QCEW can be compared with other data programs at BLS, as well as other outside agencies. Like the related-data series, each program has a somewhat different universe of coverage and methodology, and each produces a different publication and sets of data. For a complete comparison of QCEW data with other data programs, please see the QCEW Handbook of Methods.
QCEW data are widely used by federal statistical agencies, BLS surveys, and other public and private establishments as a basis for their statistics and research publications. For a complete list of users and uses of QCEW data, please see the QCEW Handbook of Methods.
Recent and historical data may be obtained from the QCEW program. Previous editions of Employment and Wages Annual Averages are out of print, but file copies may be examined at the BLS Washington office and at Federal Depository Libraries. For assistance in obtaining QCEW data, a QCEW analyst can be reached by telephone at (202) 691-6567, or by e-mail. Requests also may be sent by mail to the Office of Employment and Unemployment Statistics, Division of Administrative Statistics and Labor Turnover, Room 4860, U.S. Bureau of Labor Statistics, U.S. Department of Labor, Washington, DC 20212. The request should include the name and telephone number of an individual whom BLS staff may contact, if necessary.
Most State workforce agencies have QCEW employment and wage data for both the private and government sectors by county and for major labor market areas. If data provided by the BLS Web site are insufficient, requests for these detailed data should be made directly to State agencies. Data for Puerto Rico and the U.S. Virgin Islands are also available and may be obtained from the State workforce agencies in those jurisdictions.
The Business Employment Dynamics (BED) data are a product of the QCEW program. BED data are compiled by BLS from existing quarterly State UI records for non-household private employers and are supplemented with MWR records. In the BED program, UI records are linked across quarters to provide a longitudinal history for each privately owned establishment. The linkage process allows the tracking of net employment changes at the establishment level, which in turn allows the estimation of jobs gained at opening and expanding establishments and jobs lost at closing and contracting establishments.
The linkage process initially matches establishments' unique UI identification numbers assigned by the State workforce agencies. Between 95 and 97 percent of establishments identified as continuous from quarter to quarter are matched by UI numbers. The rest are linked in one of three ways. The first method uses predecessor and successor information, identified by the State workforce agencies, to relate records with different UI numbers across quarters. Predecessor and successor relationships can come about for a variety of reasons, including a change in ownership, a firm's restructuring, or a UI account's restructuring. If a match cannot be attained in this manner, a probability-based match is used. This match attempts to identify two establishments with different UI numbers as continuous. The match is based upon establishments having the same business name, address, and phone number. Third, an analyst examines unmatched records individually and attempts to make a possible match.
The change in employment at the establishment level results from one of four types of events. An increase in employment can come from either opening establishments or expanding establishments. A decrease in employment can come from either closing establishments or contracting establishments. Gross job gains include the sum of all jobs added at either opening or expanding establishments. Gross job losses include the sum of all jobs lost in either closing or contracting establishments. The net change in employment is the difference between gross job gains and gross job losses.
The formal definitions of establishment-level employment changes are as follows:
All establishment-level employment changes are measured from the third month of each quarter. Not all establishments change their employment levels; these establishments count towards estimates of total employment, but not for levels of gross job gains and gross job losses.
With the publication of its first quarter data for 2007, the BED program announced a one-time revision to its historical data series. According to this announcement, all historical BED series back to third quarter 1992 have been revised for both seasonally adjusted and not seasonally adjusted series to incorporate updated and improved input data. In the future, annual revisions to BED series will be published each year with the release of first quarter data. Those revisions will cover the last four quarters of not seasonally adjusted data and 5 years of seasonally adjusted data.
Searchable databases for the Business Employment Dynamics program are available from BDM Databases, while BED data files and charts are available from https://www.bls.gov/bdm/charts.htm.
Established in 1915, the Monthly Labor Review is the principal journal of fact, analysis, and research of the Bureau of Labor Statistics. Other BLS publications, including Beyond the Numbers and TED: The Economics Daily, focus on short form analysis along with graphics and maps. In 2019 and 2020, these publications released several articles (listed below) at least partly based on QCEW, Business Employment Dynamics (BED), or Unemployment Insurance (UI) data.
TED: Looking to buy a book on National Book Lovers Day?
TED: Net employment gain of 792,000 private-sector jobs during the fourth quarter of 2019
TED: Gross job gains and losses were both 7.3 million from July to September 2019
TED: Employment trends in electronic shopping
TED: Gross job gains exceeded gross job losses in 26 states and D.C. for quarter ended June 2019
TED: Gross job gains exceeded gross job losses in 10 industries over the quarter ending March 2019
TED: Employment in 2019 up 5.8 percent in Cleveland County, Oklahoma
TED: 2.7 million grocery store workers in September 2019
TED: Number of hospitals and hospital employment in each state in 2019
TED: Counties with highest concentration of jobs in scientific research and development, September 2019
TED: Employment up more than 5.0 percent over the year in New Hanover County, NC, and Adams County, CO
TED: Jobs in environment and conservation nearly triple from January 2001 to June 2019
MLR: Occupational employment and wage differences across cohorts of establishments
TED: Trends in Casino employment from 2001 to 2018
TED: Adams County, Colorado, has largest 12-month employment increase, June 2019
TED: Finding a place to eat on National Taco Day
TED: Tennessee and Hawaii have highest job concentration of musical groups and artists
TED: Midland, Texas, has largest job gain, San Francisco largest wage gain, among largest U.S. counties
Last Modified Date: February 26, 2026