
An official website of the United States government
An official website of the United States government
The .gov means it's official.
Federal government websites often end in .gov or .mil. Before sharing sensitive information,
make sure you're on a federal government site.
The site is secure.
The
https:// ensures that you are connecting to the official website and that any
information you provide is encrypted and transmitted securely.
BLS estimated models for roughly 200 detailed industries that were then summed to sectors and major sectors1. Detailed industry projections were constrained to sum to the total nonfarm wage and salary employment provided by the macroeconomic model.
Changes to the industry classification system presented a challenge in evaluating these sets of projections. Therefore, BLS analyzed only the 16 aggregate industry major sectors rather than the detailed industries published within the projections publications. For more information, refer to our evaluation methodology.
How often did BLS correctly project growth and decline for industries?
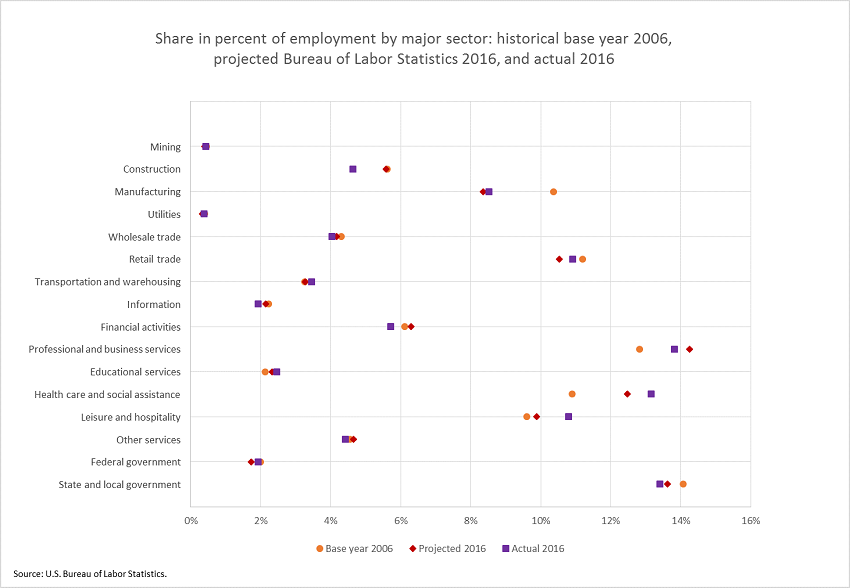
BLS correctly projected which major industry would grow and which would decline 63 percent of the time.
The service–producing sector, representing over 80 percent of U.S. employment, was correctly projected to experience continued growth over the 2006–16 decade. However, within the service sectors, Information, Financial Activities, and Wholesale Trade were all expected to increase, but instead had slight declines and Federal Government, and Utilities were expected to decrease, but instead had slight gains. BLS correctly expected that the goods–producing sector would decline, however, BLS expected construction to grow, which instead declined.
What did BLS project as the nonagriculture wage and salary compound annual rate of growth from 2006 to 2016?
The projected compound annual growth rate from 2006 to 2016 was 1.0 percent.
What was the actual nonagriculture wage and salary compound annual rate of growth from 2006 to 2016?
The actual compound annual growth rate from 2006 to 2016 was 0.6 percent.
What contributed to the difference?
Since the macroeconomic model overprojected U.S. employment, industry sectors also tended to be projected higher than what was realized.
For each of the following measures the BLS projection was compared against this naïve model.
|
Sector |
Actual 2016 employment |
Employment Projections |
Absolute Percent Error |
Best Performer |
||
|---|---|---|---|---|---|---|
|
BLS |
Naïve |
BLS |
Naïve |
|||
|
Nonfarm W&S |
145,028 |
151,962 |
149,658 |
5% |
3% |
Naïve |
The naïve model outperformed the BLS model for total nonagriculture wage and salary employment. However, the BLS model outperformed the naïve model in the majority of the major sectors in the absolute percent error measurement. The major sectors where the BLS model did not outperform the naïve model are Wholesale Trade, Information, Financial Activities, Professional and Business Services, and Leisure and Hospitality.
|
Sector |
Actual 2016 employment |
Employment Projections |
Absolute Percent Error |
Best Performer |
||
|---|---|---|---|---|---|---|
|
BLS |
Naïve |
BLS |
Naïve |
|||
|
Mining |
617 |
609 |
559 |
1% |
9% |
BLS |
|
Construction |
6,728 |
8,470 |
9,326 |
26% |
39% |
BLS |
|
Manufacturing |
12,354 |
12,695 |
9,797 |
3% |
21% |
BLS |
|
Utilities |
556 |
518 |
465 |
7% |
16% |
BLS |
|
Wholesale trade |
5,861 |
6,326 |
5,883 |
8% |
0% |
Naïve |
|
Retail trade |
15,826 |
16,006 |
16,353 |
1% |
3% |
BLS |
|
Transportation and warehousing |
5,015 |
4,962 |
4,765 |
1% |
5% |
BLS |
|
Information |
2,794 |
3,267 |
3,179 |
17% |
14% |
Naïve |
|
Financial activities |
8,287 |
9,570 |
9,565 |
15% |
15% |
Naïve |
|
Professional and business services |
20,052 |
21,644 |
20,542 |
8% |
2% |
Naïve |
|
Educational services |
3,570 |
3,527 |
3,802 |
1% |
7% |
BLS |
|
Health care and social assistance |
19,069 |
18,954 |
18,187 |
1% |
5% |
BLS |
|
Leisure and hospitality |
15,660 |
15,017 |
15,215 |
4% |
3% |
Naïve |
|
Other services |
6,415 |
7,077 |
7,141 |
10% |
11% |
BLS |
|
Federal government |
2,795 |
2,626 |
2,605 |
6% |
7% |
BLS |
|
State and local government |
19,429 |
20,696 |
22,276 |
7% |
15% |
BLS |
Since aggregate employment was overprojected, detailed industries also tended to be overprojected. Comparing the projected share of the labor market with the actual share helps to address whether BLS correctly advised career-seeking customers which industry to pursue. BLS was more accurate than the naïve model in only eight of the sixteen major sectors.
1Sectors and major sectors are aggregations of NAICS industries.
Return to Projections Evaluation Homepage
Last Modified Date: August 1, 2018