
An official website of the United States government
An official website of the United States government
The .gov means it's official.
Federal government websites often end in .gov or .mil. Before sharing sensitive information,
make sure you're on a federal government site.
The site is secure.
The
https:// ensures that you are connecting to the official website and that any
information you provide is encrypted and transmitted securely.
BLS estimated models for about 300 detailed industries that were then summed to sectors and major sectors.1 Detailed industry projections were constrained to sum to the total nonfarm wage and salary employment provided by the macroeconomic model.
How often did BLS correctly project growth and decline for industries?
BLS correctly projected which major industry sectors would grow and which would decline 69 percent of the time.
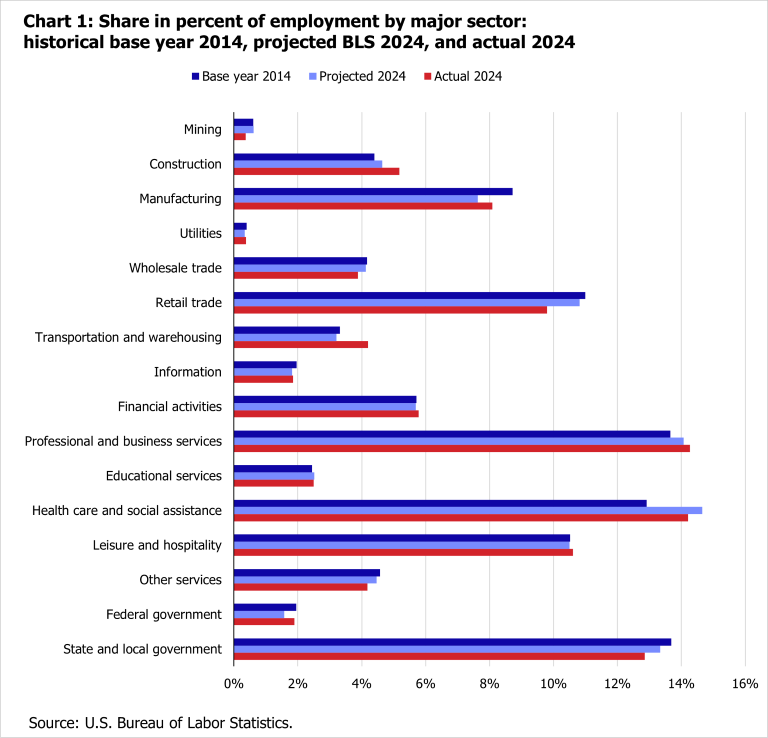
The service-providing sector, representing about 86 percent of U.S. employment, was correctly projected to experience continued growth over the 2014–24 decade. However, within the service sectors, utilities, information, and federal government were all expected to decrease, but instead experienced growth. While BLS correctly predicted that the goods-producing sector as a whole would increase, BLS incorrectly predicted that mining would slightly increase and manufacturing would slightly decrease. Instead, mining saw an employment decline, and manufacturing saw employment growth.
What did BLS project as the nonagricultural wage and salary compound annual rate of growth from 2014 to 2024?
The projected compound annual growth rate from 2014 to 2024 was 0.6 percent.
What was the actual nonagricultural wage and salary compound annual rate of growth from 2014 to 2024?
The actual compound annual growth rate from 2014 to 2024 was 1.3 percent.
For each of the following measures the BLS projection was compared against this naïve model.
| Sector | Employment, 2024 | Projected Employment, BLS, 2024 | Projected Employment, Naïve, 2024 | Absolute percent error, BLS | Absolute percent error, Naïve | Best performer |
|---|---|---|---|---|---|---|
|
Nonagricultural wage and salary |
158,569 | 149,132 | 137,946 | 6.0 | 13.0 | BLS |
|
Source: U.S. Bureau of Labor Statistics. |
||||||
The BLS model was much closer to the actual 2024 employment than the Naïve model for total nonagricultural wage and salary employment. (See Table 1.) The BLS model also outperformed the Naïve model in most of the major sectors in the absolute percent error measurement. (See Table 2.) The major sectors where the BLS model did not outperform the Naïve model are utilities, educational services, leisure and hospitality, and federal government.
| Sector | Employment, 2024 | Projected Employment, BLS, 2024 | Projected Employment, Naïve, 2024 | Absolute percent error, BLS | Absolute percent error, Naïve | Best performer |
|---|---|---|---|---|---|---|
|
Mining |
586 | 924 | 1,128 | 57.7 | 92.5 | BLS |
|
Construction |
8,212 | 6,929 | 3,489 | 15.6 | 57.5 | BLS |
|
Manufacturing |
12,817 | 11,374 | 8,430 | 11.3 | 34.2 | BLS |
|
Utilities |
591 | 505 | 547 | 14.6 | 7.5 | Naïve |
|
Wholesale trade |
6,145 | 6,151 | 5,537 | 0.1 | 9.9 | BLS |
|
Retail trade |
15,532 | 16,129 | 14,579 | 3.8 | 6.1 | BLS |
|
Transportation and warehousing |
6,655 | 4,777 | 4,613 | 28.2 | 30.7 | BLS |
|
Information |
2,943 | 2,713 | 2,132 | 7.8 | 27.6 | BLS |
|
Financial activities |
9,169 | 8,487 | 7,268 | 7.4 | 20.7 | BLS |
|
Professional and business services |
22,621 | 20,986 | 20,064 | 7.2 | 11.3 | BLS |
|
Educational services |
3,963 | 3,756 | 4,108 | 5.2 | 3.7 | Naïve |
|
Health care and social assistance |
22,527 | 21,852 | 21,727 | 3.0 | 3.6 | BLS |
|
Leisure and hospitality |
16,818 | 15,651 | 15,901 | 6.9 | 5.5 | Naïve |
|
Other services |
6,616 | 6,662 | 6,211 | 0.7 | 6.1 | BLS |
|
Federal government |
3,000 | 2,346 | 2,908 | 21.8 | 3.1 | Naïve |
|
State and local government |
20,375 | 19,890 | 19,304 | 2.4 | 5.3 | BLS |
|
Source: U.S. Bureau of Labor Statistics. |
||||||
Comparing the projected share of the labor market with the actual share helps to address whether BLS correctly predicted which industries were growing or declining. (See Chart 1.)
1Sectors and major sectors are aggregations of NAICS industries.
Return to Projections Evaluation Homepage
Last modified date: April 10, 2026