
An official website of the United States government
 United States Department of Labor
An official website of the United States government
United States Department of Labor

The .gov means it's official.
Federal government websites often end in .gov or .mil. Before sharing sensitive information,
make sure you're on a federal government site.

The site is secure.
The
https:// ensures that you are connecting to the official website and that any
information you provide is encrypted and transmitted securely.


The U.S. Bureau of Labor Statistics (BLS) employment projections can be viewed by the projected change in number of jobs, projected percent change, and projected occupational openings. Each offers a different way to look at the job outlook for an occupation. This factsheet provides a deeper dive into these concepts used by the Employment Projections (EP) program.
The projected change in number of jobs (numeric change) is the difference between the base-year employment level and the projected employment level for the target year. It represents the number of jobs an occupation is projected to gain or lose over the projections decade. For occupations with higher employment levels, many new jobs projected may not always translate to fast growth in terms of percent change.
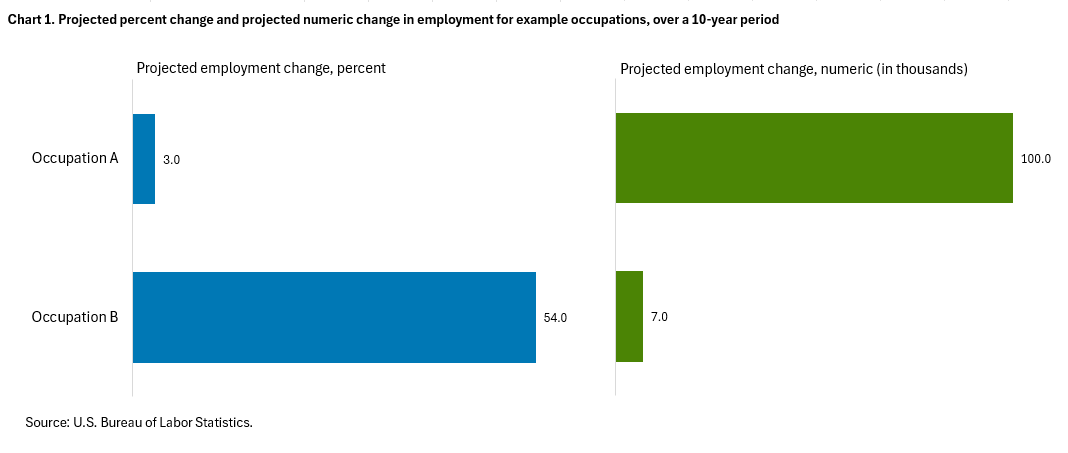
For example, if Occupation A has 3.5 million jobs in the base year, and BLS projects there will be 3.6 million jobs for the same occupation in the target year, this represents an increase of 100,000 jobs over the decade—but only about a 3-percent increase in employment.
The percent change in employment is calculated by taking the projected change in number of jobs and dividing it by the base-year employment level. Percent change can be used to view the fastest growing occupations for which the BLS prepares employment projections, and it can provide context as it allows for comparisons of growth rates across occupations, regardless of the size of employment. However, a fast percent change in employment may not always translate into many new jobs.
For example, if there are 13,000 jobs in Occupation B in the base year, and BLS projects there will be 20,000 jobs in the same occupation in the target year, this represents a 54-percent increase in employment over the decade, but an increase of only 7,000 jobs. Chart 1 shows the projected percent change in employment and the projected change in the number of jobs (numeric change) for Occupation A and Occupation B, illustrating that the faster growth does not always translate to a greater number of new jobs.
Occupational openings are calculated by adding the projected net change in number of jobs (demand from new jobs) and the projected number of occupational separations (demand from workers permanently leaving an occupation who need to be replaced) over the decade, and dividing by 10 to get an annual average. Occupational separations include both labor force exits, such as retirements, and occupational transfers, which is when workers leave one occupation for a different one.
Projections of openings reflect opportunities for new workers to enter an occupation. Even if employment of an occupation is projected to decline, there may still be occupational openings over the projections period as a result of economic churn.
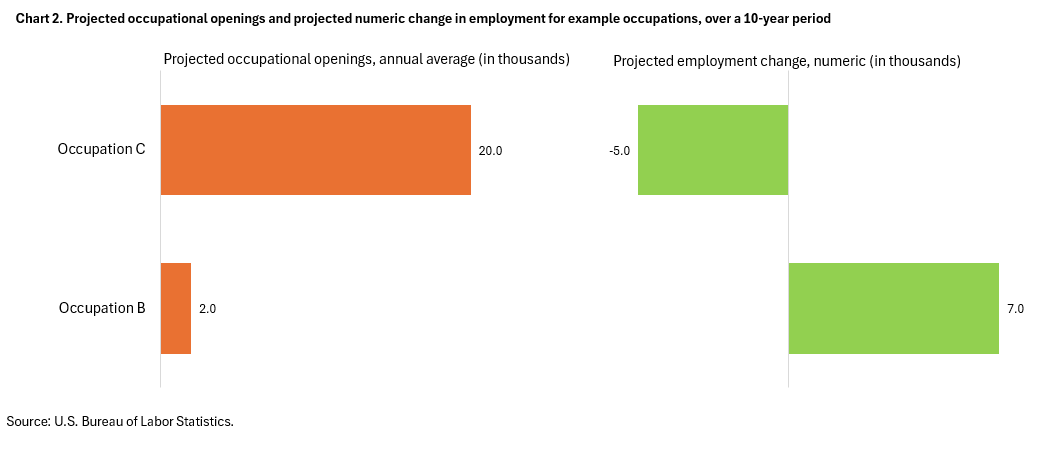
For example, even though employment of Occupation C is projected to decline by 5,000 jobs over the projections decade, there may still be 20,000 projected openings, each year, on average, due to the large number of workers who are expected to leave the occupation permanently. Compare this with Occupation B, whose employment is projected to increase by 7,000 jobs, but for which there are projected to be only about 2,000 openings each year, on average, over the decade. Despite the projected growth for Occupation B, the number of occupational separations projected is less than those projected for Occupation C. Chart 2 shows the projected occupational openings and the projected change in the number of jobs (numeric change) for Occupation C and Occupation B, highlighting an example where an occupation may have projected openings despite a projected decline in employment.
There are several concepts that can be used to view, interpret, and analyze the employment projections data, including change in number of jobs, percent change, and occupational openings. Each concept gives us different information about the expected increases or decreases in employment over the projections decade. The intended use of the analysis and the level of detail needed may drive which concept, or a combination of concepts, would be most appropriate to use.
The Understanding BLS Employment Projections video provides an explanation of EP concepts. The EP program has more details on its methodology and concepts throughout the BLS Handbook of Methods. For additional information on occupational openings, visit the occupational separations page and the Frequently Asked Questions on how projections of occupational openings differ from job openings measured by the Job Openings and Labor Turnover Survey (JOLTS). For additional information about the EP program, please contact us at (202) 691-5700 or ep-info@bls.gov.
Last modified date: August 27, 2026