
An official website of the United States government
An official website of the United States government
The .gov means it's official.
Federal government websites often end in .gov or .mil. Before sharing sensitive information,
make sure you're on a federal government site.
The site is secure.
The
https:// ensures that you are connecting to the official website and that any
information you provide is encrypted and transmitted securely.
Healthcare Practitioners and Technical Occupations comprises the following occupations: Chiropractors; Dentists, All Other Specialists; Prosthodontists; Orthodontists; Oral and Maxillofacial Surgeons; Dentists, General; Dietitians and Nutritionists; Optometrists; Pharmacists; Physician Assistants; Podiatrists; Therapists, All Other; Exercise Physiologists; Radiation Therapists; Recreational Therapists; Occupational Therapists; Respiratory Therapists; Speech-Language Pathologists; Physical Therapists; Veterinarians; Registered Nurses; Nurse Anesthetists; Nurse Midwives; Nurse Practitioners; Audiologists; Physicians, All Other; Neurologists; Dermatologists; Physicians, Pathologists; Cardiologists; Obstetricians and Gynecologists; Psychiatrists; Radiologists; Anesthesiologists; Pediatricians, General; Emergency Medicine Physicians; General Internal Medicine Physicians; Family Medicine Physicians; Surgeons, All Other; Pediatric Surgeons; Ophthalmologists, Except Pediatric; Orthopedic Surgeons, Except Pediatric; Healthcare Diagnosing or Treating Practitioners, All Other; Acupuncturists; Dental Hygienists; Clinical Laboratory Technologists and Technicians; Medical Dosimetrists; Nuclear Medicine Technologists; Magnetic Resonance Imaging Technologists; Cardiovascular Technologists and Technicians; Diagnostic Medical Sonographers; Radiologic Technologists and Technicians; Paramedics; Emergency Medical Technicians; Dietetic Technicians; Ophthalmic Medical Technicians; Psychiatric Technicians; Surgical Technologists; Veterinary Technologists and Technicians; Pharmacy Technicians; Licensed Practical and Licensed Vocational Nurses; Medical Records Specialists; Opticians, Dispensing; Health Technologists and Technicians, All Other; Orthotists and Prosthetists; Hearing Aid Specialists; Health Information Technologists and Medical Registrars; Healthcare Practitioners and Technical Workers, All Other; Genetic Counselors; Surgical Assistants; Athletic Trainers
Employment estimate and mean wage estimates for Healthcare Practitioners and Technical Occupations:
| Employment (1) | Employment RSE (3) |
Mean hourly wage |
Mean annual wage (2) |
Wage RSE (3) |
|---|---|---|---|---|
| 8,787,730 | 0.2 % | $ 43.80 | $ 91,100 | 0.3 % |
Percentile wage estimates for Healthcare Practitioners and Technical Occupations:
| Percentile | 10% | 25% | 50% (Median) |
75% | 90% |
|---|---|---|---|---|---|
| Hourly Wage | $ 17.76 | $ 23.41 | $ 36.08 | $ 48.00 | $ 74.43 |
| Annual Wage (2) | $ 36,930 | $ 48,700 | $ 75,040 | $ 99,840 | $ 154,810 |
Industries with the highest published employment and wages for Healthcare Practitioners and Technical Occupations are provided. For a list of all industries with employment in Healthcare Practitioners and Technical Occupations, see the Create Customized Tables function.
Industries with the highest levels of employment in Healthcare Practitioners and Technical Occupations:
| Industry | Employment (1) | Percent of industry employment | Hourly mean wage | Annual mean wage (2) |
|---|---|---|---|---|
| General Medical and Surgical Hospitals | 3,205,390 | 57.29 | $ 41.64 | $ 86,610 |
| Offices of Physicians | 1,188,560 | 44.08 | $ 71.71 | $ 149,150 |
| Outpatient Care Centers | 408,420 | 41.38 | $ 46.22 | $ 96,140 |
| Health and Personal Care Stores | 380,930 | 37.76 | $ 31.45 | $ 65,420 |
| Nursing Care Facilities (Skilled Nursing Facilities) | 365,870 | 25.99 | $ 30.42 | $ 63,270 |
Industries with the highest concentration of employment in Healthcare Practitioners and Technical Occupations:
| Industry | Employment (1) | Percent of industry employment | Hourly mean wage | Annual mean wage (2) |
|---|---|---|---|---|
| General Medical and Surgical Hospitals | 3,205,390 | 57.29 | $ 41.64 | $ 86,610 |
| Other Ambulatory Health Care Services | 165,160 | 52.98 | $ 22.41 | $ 46,600 |
| Specialty (except Psychiatric and Substance Abuse) Hospitals | 138,540 | 51.29 | $ 43.14 | $ 89,740 |
| Offices of Physicians | 1,188,560 | 44.08 | $ 71.71 | $ 149,150 |
| Medical and Diagnostic Laboratories | 123,000 | 41.79 | $ 37.56 | $ 78,130 |
Top paying industries for Healthcare Practitioners and Technical Occupations:
| Industry | Employment (1) | Percent of industry employment | Hourly mean wage | Annual mean wage (2) |
|---|---|---|---|---|
| Other Information Services | 460 | 0.13 | $ 82.48 | $ 171,560 |
| Offices of Physicians | 1,188,560 | 44.08 | $ 71.71 | $ 149,150 |
| Aerospace Product and Parts Manufacturing | 170 | 0.04 | $ 69.14 | $ 143,800 |
| Newspaper, Periodical, Book, and Directory Publishers | 70 | 0.03 | $ 68.02 | $ 141,470 |
| Animal Food Manufacturing | 30 | 0.05 | $ 57.11 | $ 118,790 |
States and areas with the highest published employment, location quotients, and wages for Healthcare Practitioners and Technical Occupations are provided. For a list of all areas with employment in Healthcare Practitioners and Technical Occupations, see the Create Customized Tables function.
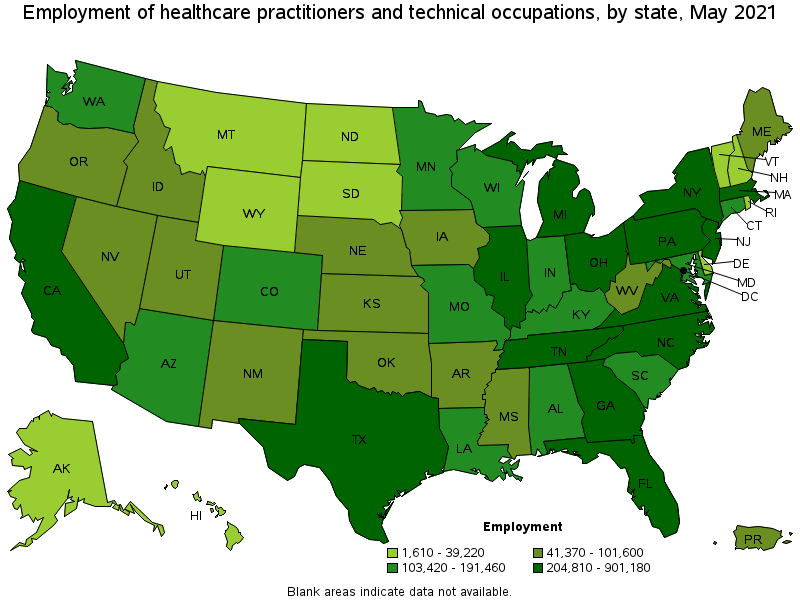
States with the highest employment level in Healthcare Practitioners and Technical Occupations:
| State | Employment (1) | Employment per thousand jobs | Location quotient (9) | Hourly mean wage | Annual mean wage (2) |
|---|---|---|---|---|---|
| California | 901,180 | 54.52 | 0.87 | $ 55.40 | $ 115,220 |
| Texas | 667,240 | 54.57 | 0.87 | $ 40.53 | $ 84,310 |
| Florida | 563,590 | 65.49 | 1.05 | $ 39.85 | $ 82,890 |
| New York | 541,830 | 62.50 | 1.00 | $ 49.29 | $ 102,510 |
| Pennsylvania | 411,660 | 73.73 | 1.18 | $ 40.77 | $ 84,800 |
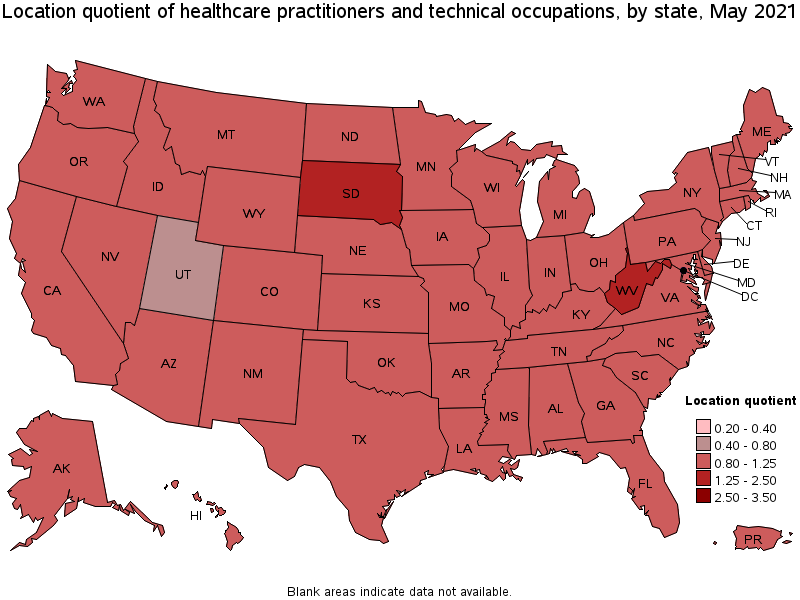
States with the highest concentration of jobs and location quotients in Healthcare Practitioners and Technical Occupations:
| State | Employment (1) | Employment per thousand jobs | Location quotient (9) | Hourly mean wage | Annual mean wage (2) |
|---|---|---|---|---|---|
| West Virginia | 57,790 | 87.87 | 1.41 | $ 36.38 | $ 75,670 |
| South Dakota | 33,470 | 79.45 | 1.27 | $ 36.12 | $ 75,120 |
| North Dakota | 29,690 | 75.17 | 1.21 | $ 37.39 | $ 77,770 |
| Louisiana | 133,150 | 74.23 | 1.19 | $ 35.73 | $ 74,320 |
| Mississippi | 81,620 | 74.09 | 1.19 | $ 33.49 | $ 69,660 |
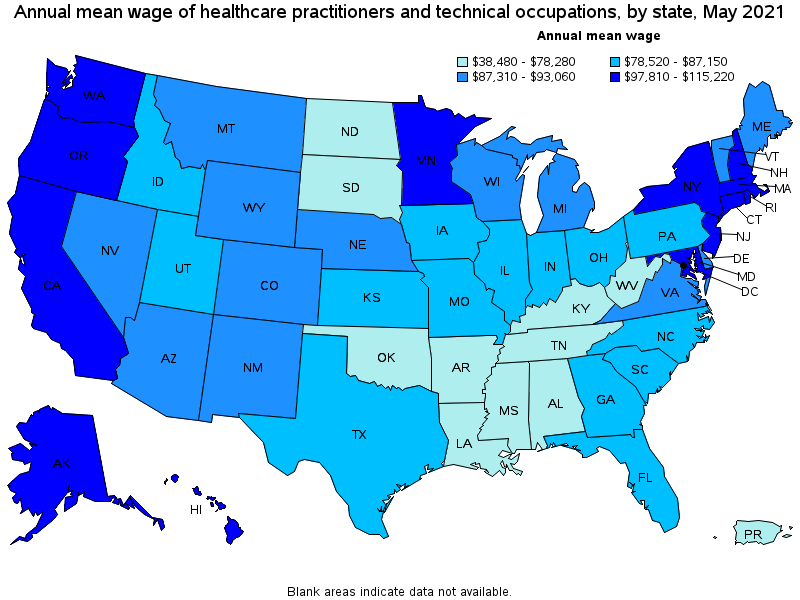
Top paying states for Healthcare Practitioners and Technical Occupations:
| State | Employment (1) | Employment per thousand jobs | Location quotient (9) | Hourly mean wage | Annual mean wage (2) |
|---|---|---|---|---|---|
| California | 901,180 | 54.52 | 0.87 | $ 55.40 | $ 115,220 |
| Hawaii | 31,300 | 57.08 | 0.92 | $ 54.51 | $ 113,370 |
| New Jersey | 234,920 | 61.01 | 0.98 | $ 54.26 | $ 112,860 |
| District of Columbia | 28,580 | 43.17 | 0.69 | $ 51.13 | $ 106,340 |
| Alaska | 19,460 | 65.75 | 1.05 | $ 50.80 | $ 105,660 |
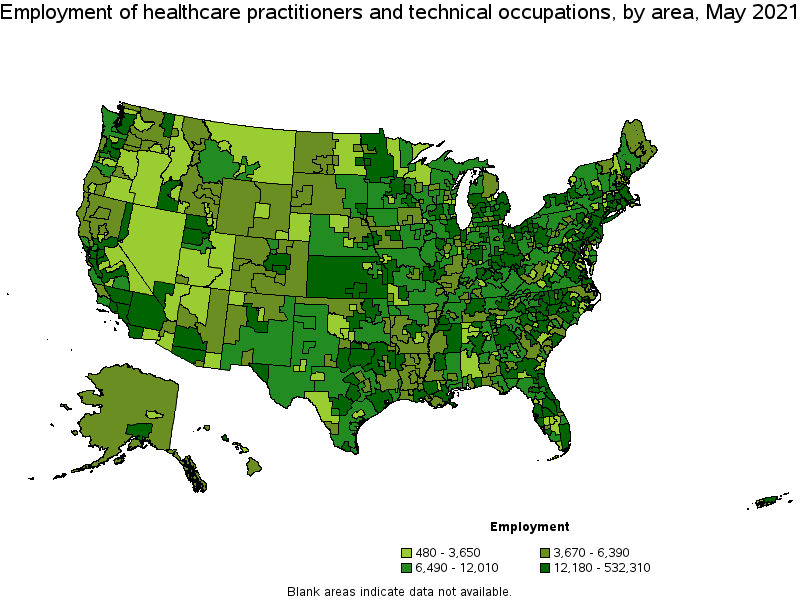
Metropolitan areas with the highest employment level in Healthcare Practitioners and Technical Occupations:
| Metropolitan area | Employment (1) | Employment per thousand jobs | Location quotient (9) | Hourly mean wage | Annual mean wage (2) |
|---|---|---|---|---|---|
| New York-Newark-Jersey City, NY-NJ-PA | 532,310 | 61.34 | 0.98 | $ 54.08 | $ 112,490 |
| Los Angeles-Long Beach-Anaheim, CA | 323,700 | 56.60 | 0.91 | $ 52.07 | $ 108,300 |
| Chicago-Naperville-Elgin, IL-IN-WI | 259,620 | 61.34 | 0.98 | $ 42.98 | $ 89,400 |
| Philadelphia-Camden-Wilmington, PA-NJ-DE-MD | 196,020 | 73.84 | 1.18 | $ 44.90 | $ 93,390 |
| Dallas-Fort Worth-Arlington, TX | 188,810 | 52.61 | 0.84 | $ 42.27 | $ 87,920 |
| Boston-Cambridge-Nashua, MA-NH | 180,210 | 69.71 | 1.12 | $ 51.66 | $ 107,450 |
| Houston-The Woodlands-Sugar Land, TX | 161,800 | 55.85 | 0.90 | $ 42.92 | $ 89,270 |
| Miami-Fort Lauderdale-West Palm Beach, FL | 161,780 | 65.97 | 1.06 | $ 41.13 | $ 85,550 |
| Washington-Arlington-Alexandria, DC-VA-MD-WV | 148,120 | 50.51 | 0.81 | $ 52.13 | $ 108,430 |
| Atlanta-Sandy Springs-Roswell, GA | 136,980 | 52.93 | 0.85 | $ 43.19 | $ 89,840 |
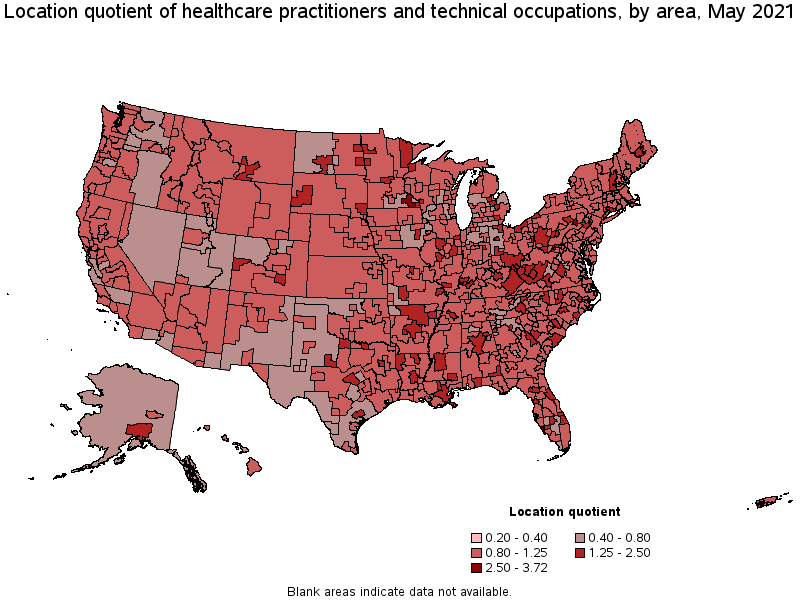
Metropolitan areas with the highest concentration of jobs and location quotients in Healthcare Practitioners and Technical Occupations:
| Metropolitan area | Employment (1) | Employment per thousand jobs | Location quotient (9) | Hourly mean wage | Annual mean wage (2) |
|---|---|---|---|---|---|
| Rochester, MN | 26,890 | 232.03 | 3.72 | $ 61.65 | $ 128,230 |
| Bloomsburg-Berwick, PA | 7,020 | 177.87 | 2.85 | $ 49.57 | $ 103,100 |
| Morgantown, WV | 8,570 | 137.40 | 2.20 | $ 35.63 | $ 74,110 |
| Ann Arbor, MI | 24,050 | 119.32 | 1.91 | $ 44.45 | $ 92,450 |
| Durham-Chapel Hill, NC | 36,440 | 116.72 | 1.87 | $ 38.90 | $ 80,900 |
| Greenville, NC | 8,130 | 107.85 | 1.73 | $ 35.66 | $ 74,170 |
| Gainesville, FL | 14,340 | 107.76 | 1.73 | $ 38.02 | $ 79,080 |
| Iowa City, IA | 9,210 | 105.30 | 1.69 | $ 39.39 | $ 81,920 |
| Sioux Falls, SD | 16,030 | 103.04 | 1.65 | $ 35.11 | $ 73,030 |
| Alexandria, LA | 6,000 | 102.84 | 1.65 | $ 35.05 | $ 72,910 |
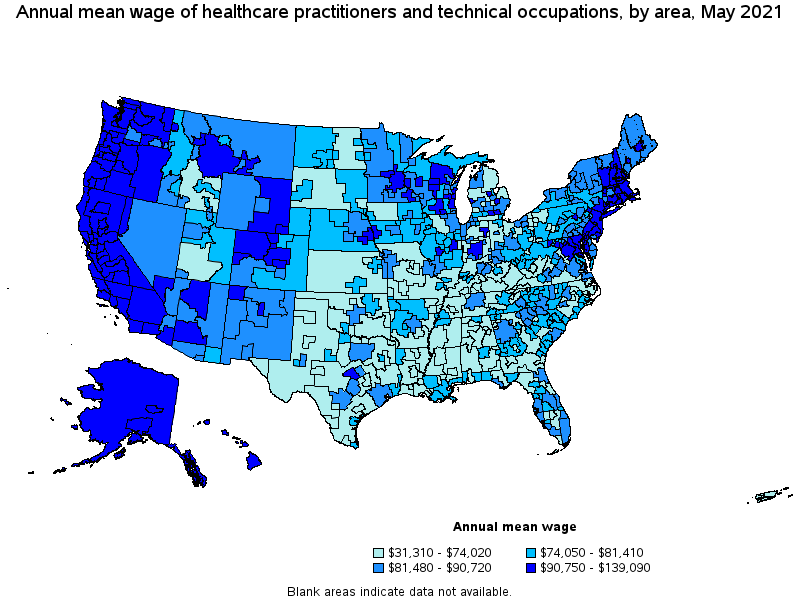
Top paying metropolitan areas for Healthcare Practitioners and Technical Occupations:
| Metropolitan area | Employment (1) | Employment per thousand jobs | Location quotient (9) | Hourly mean wage | Annual mean wage (2) |
|---|---|---|---|---|---|
| San Jose-Sunnyvale-Santa Clara, CA | 51,160 | 47.88 | 0.77 | $ 66.87 | $ 139,090 |
| San Francisco-Oakland-Hayward, CA | 114,160 | 50.91 | 0.82 | $ 64.85 | $ 134,890 |
| Rochester, MN | 26,890 | 232.03 | 3.72 | $ 61.65 | $ 128,230 |
| Salinas, CA | 8,330 | 49.29 | 0.79 | $ 59.63 | $ 124,020 |
| Napa, CA | 4,100 | 59.54 | 0.95 | $ 59.46 | $ 123,670 |
| Vallejo-Fairfield, CA | 9,360 | 72.24 | 1.16 | $ 58.71 | $ 122,120 |
| Santa Cruz-Watsonville, CA | 5,190 | 55.58 | 0.89 | $ 58.09 | $ 120,820 |
| Sacramento--Roseville--Arden-Arcade, CA | 56,650 | 57.66 | 0.92 | $ 57.79 | $ 120,200 |
| Santa Rosa, CA | 10,640 | 55.44 | 0.89 | $ 57.29 | $ 119,160 |
| San Diego-Carlsbad, CA | 78,970 | 56.79 | 0.91 | $ 56.32 | $ 117,150 |
Nonmetropolitan areas with the highest employment in Healthcare Practitioners and Technical Occupations:
| Nonmetropolitan area | Employment (1) | Employment per thousand jobs | Location quotient (9) | Hourly mean wage | Annual mean wage (2) |
|---|---|---|---|---|---|
| Kansas nonmetropolitan area | 23,710 | 63.11 | 1.01 | $ 33.69 | $ 70,080 |
| North Northeastern Ohio nonmetropolitan area (noncontiguous) | 17,640 | 56.13 | 0.90 | $ 34.76 | $ 72,300 |
| Northeast Mississippi nonmetropolitan area | 16,550 | 74.65 | 1.20 | $ 32.86 | $ 68,340 |
| Piedmont North Carolina nonmetropolitan area | 15,480 | 63.38 | 1.02 | $ 35.98 | $ 74,830 |
| Southeast Coastal North Carolina nonmetropolitan area | 13,860 | 57.69 | 0.92 | $ 34.18 | $ 71,080 |
Nonmetropolitan areas with the highest concentration of jobs and location quotients in Healthcare Practitioners and Technical Occupations:
| Nonmetropolitan area | Employment (1) | Employment per thousand jobs | Location quotient (9) | Hourly mean wage | Annual mean wage (2) |
|---|---|---|---|---|---|
| East Kentucky nonmetropolitan area | 9,790 | 102.48 | 1.64 | $ 35.30 | $ 73,420 |
| West Central-Southwest New Hampshire nonmetropolitan area | 8,370 | 86.19 | 1.38 | $ 52.10 | $ 108,370 |
| Southern Ohio nonmetropolitan area | 13,160 | 85.94 | 1.38 | $ 38.55 | $ 80,190 |
| Southern West Virginia nonmetropolitan area | 5,590 | 83.82 | 1.34 | $ 31.87 | $ 66,290 |
| North Arkansas nonmetropolitan area | 8,850 | 78.29 | 1.26 | $ 37.17 | $ 77,320 |
Top paying nonmetropolitan areas for Healthcare Practitioners and Technical Occupations:
| Nonmetropolitan area | Employment (1) | Employment per thousand jobs | Location quotient (9) | Hourly mean wage | Annual mean wage (2) |
|---|---|---|---|---|---|
| Eastern Sierra-Mother Lode Region of California nonmetropolitan area | 3,180 | 55.54 | 0.89 | $ 54.67 | $ 113,710 |
| West Central-Southwest New Hampshire nonmetropolitan area | 8,370 | 86.19 | 1.38 | $ 52.10 | $ 108,370 |
| North Valley-Northern Mountains Region of California nonmetropolitan area | 4,970 | 50.76 | 0.81 | $ 51.91 | $ 107,970 |
| Alaska nonmetropolitan area | 4,590 | 47.12 | 0.76 | $ 51.17 | $ 106,430 |
| North Coast Region of California nonmetropolitan area | 5,280 | 52.86 | 0.85 | $ 50.22 | $ 104,460 |
These estimates are calculated with data collected from employers in all industry sectors, all metropolitan and nonmetropolitan areas, and all states and the District of Columbia.
The percentile wage estimate is the value of a wage below which a certain percent of workers fall. The median wage is the 50th percentile wage estimate—50 percent of workers earn less than the median and 50 percent of workers earn more than the median. More about percentile wages.
(1) Estimates for detailed occupations do not sum to the totals because the totals include occupations not shown separately. Estimates do not include self-employed workers.
(2) Annual wages have been calculated by multiplying the hourly mean wage by a "year-round, full-time" hours figure of 2,080 hours; for those occupations where there is not an hourly wage published, the annual wage has been directly calculated from the reported survey data.
(3) The relative standard error (RSE) is a measure of the reliability of a survey statistic. The smaller the relative standard error, the more precise the estimate.
(9) The location quotient is the ratio of the area concentration of occupational employment to the national average concentration. A location quotient greater than one indicates the occupation has a higher share of employment than average, and a location quotient less than one indicates the occupation is less prevalent in the area than average.
Other OEWS estimates and related information:
May 2021 National Occupational Employment and Wage Estimates
May 2021 State Occupational Employment and Wage Estimates
May 2021 Metropolitan and Nonmetropolitan Area Occupational Employment and Wage Estimates
May 2021 National Industry-Specific Occupational Employment and Wage Estimates
Last Modified Date: March 31, 2022