
An official website of the United States government
An official website of the United States government
The .gov means it's official.
Federal government websites often end in .gov or .mil. Before sharing sensitive information,
make sure you're on a federal government site.
The site is secure.
The
https:// ensures that you are connecting to the official website and that any
information you provide is encrypted and transmitted securely.
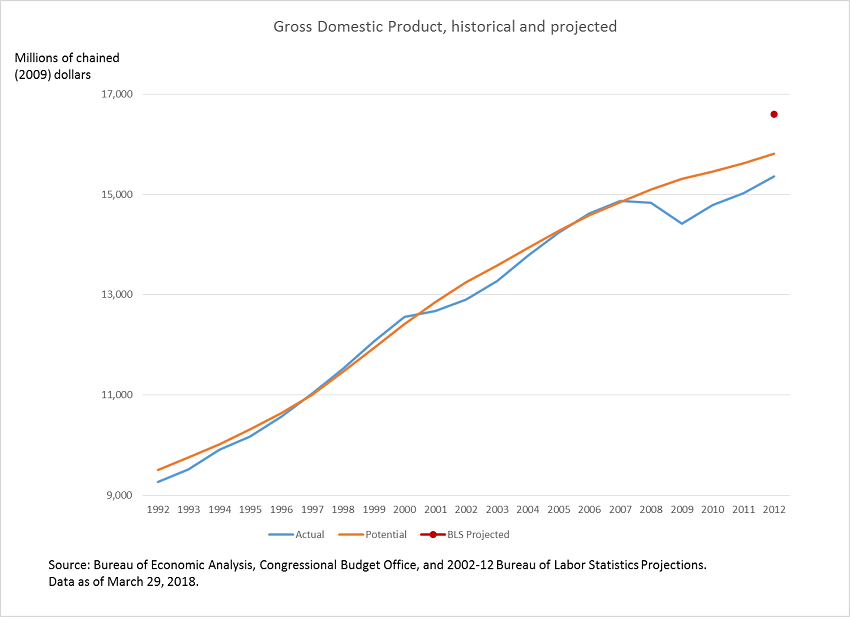
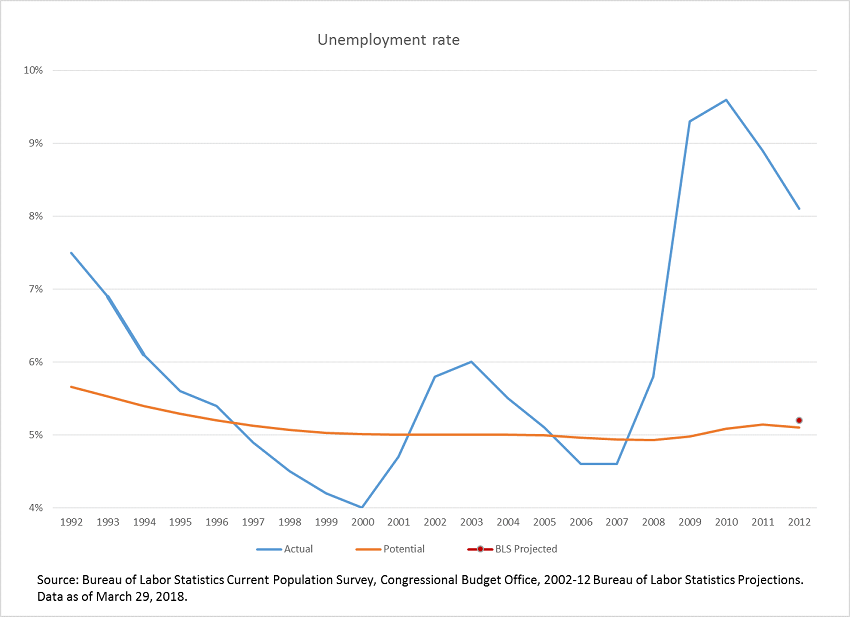
BLS projects an economy at full employment. Therefore it is most informative to assess the accuracy of projections through comparisons to an economy at full employment, also known as potential values1. Potential values are available for gross domestic product (GDP) and the unemployment rate for which comparisons are made below. Actual values are also included for these variables for reference. For more information, refer to our evaluation methodology.
|
Levels |
CBO Potential Estimate |
||
|---|---|---|---|
|
Difference |
in Percent |
||
|
BLS 2002 projection |
16,597 |
781 |
4.9 |
|
Naïve projection |
16,382 |
566 |
3.6 |
|
Actual (BEA) |
15,355 |
-461 |
-2.9 |
|
Potential (CBO) |
15,815 |
. |
. |
| Note: Data as of March 29, 2018. |
|||
|
Rate |
CBO Potential Estimate |
||
|---|---|---|---|
|
Difference |
in Percent |
||
|
BLS 2002 projection |
5.2 |
0.1 |
1.9 |
|
Actual |
8.1 |
3.0 |
58.7 |
|
CBO Potential |
5.1 |
. |
. |
| Note: Data as of March 29, 2018. |
|||
1 Potential values are estimated by the Congressional Budget Office (CBO). For more information on the potential output assumption and how it relates to BLS projections see https://www.bls.gov/opub/mlr/2017/article/full-employment-an-assumption-within-bls-projections.htm
2 Projections in 2002 were done in 1996 dollars. CBO estimates are in 2009 dollars. The 2002 projections are reweighted to 2009 dollars in order to compare the two series.
3 For the naïve model, the average growth rate for CBO's potential GDP (at the base year) is calculated for the past 10 years, and projected forward 10 years from 2002.
Return to Projections Evaluation Homepage
Last Modified Date: August 1, 2018