
An official website of the United States government
An official website of the United States government
The .gov means it's official.
Federal government websites often end in .gov or .mil. Before sharing sensitive information,
make sure you're on a federal government site.
The site is secure.
The
https:// ensures that you are connecting to the official website and that any
information you provide is encrypted and transmitted securely.
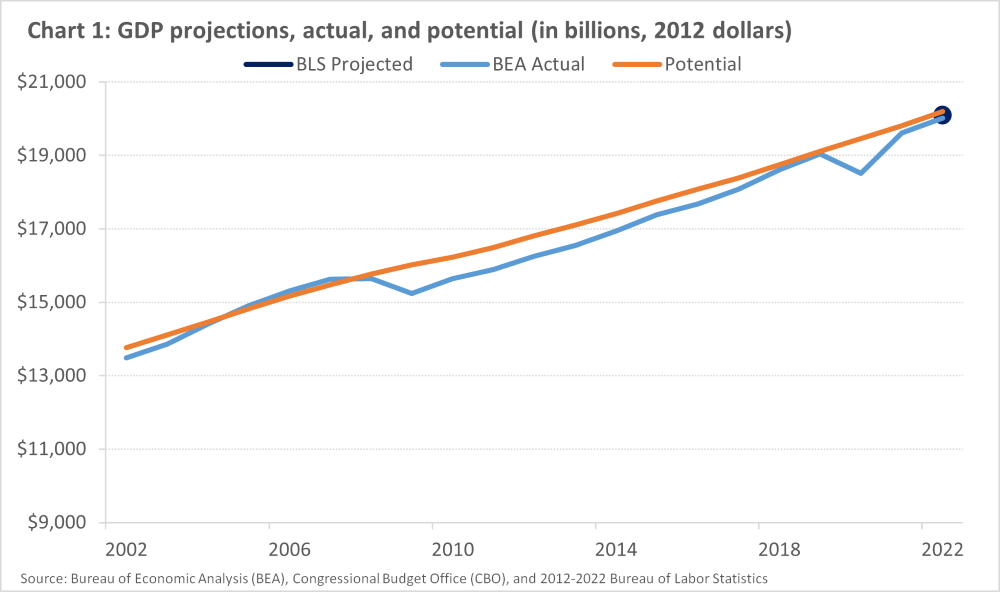
BLS projects an economy at full employment. Therefore, it is most informative to assess the accuracy of projections through comparisons to an economy at full employment, also known as potential values.1 Potential values are available for GDP and the unemployment rate. Actual values, although affected by cyclicality and not directly comparable, are also included for reference. For more information, refer to the evaluation methodology.
The BLS 2012–22 projection of GDP was 0.5 percent lower, than potential GDP.2 When the projection was made in 2012, the COVID-19 recession was not foreseen. The BLS projection outperformed the naïve projection.3(See Table 1.)
| Level | CBO Potential Estimate | ||
|---|---|---|---|
| Difference | in Percent | ||
|
BLS 2022 projection |
20,094 | -104 | -0.5 |
|
Naïve |
20,794 | 596 | 2.9 |
|
Actual |
20,014 | -184 | -0.9 |
|
CBO Potential |
20,198 | - | - |
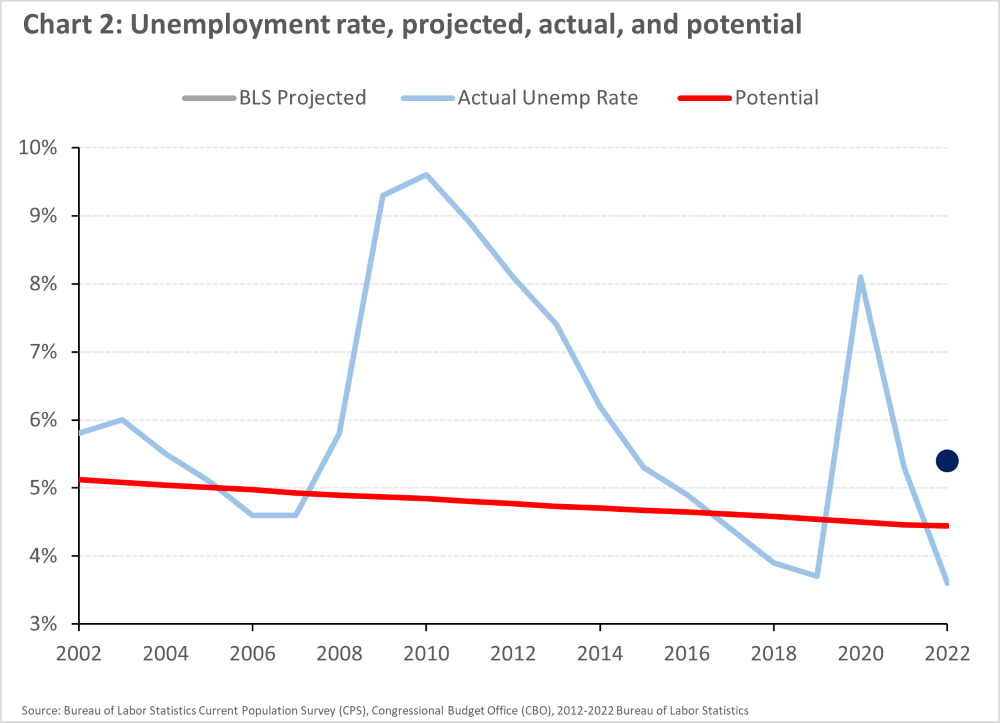
BLS projected an unemployment rate that ended up being higher than potential, 5.4 percent compared to 4.4.
| Fill | Rate | CBO Potential Estimate | |
|---|---|---|---|
| Difference | in Percent | ||
|
BLS 2012 projection |
5.4 | 1.0 | 21.7 |
|
Actual |
3.6 | -0.8 | -18.9 |
|
CBO Potential |
4.4 | - | - |
1 Potential values are estimated by the Congressional Budget Office (CBO). For more information on the potential output assumption and how it relates to BLS projections see https://www.bls.gov/opub/mlr/2017/article/full-employment-an-assumption-within-bls-projections.htm
2 CBO estimates are in 2012 dollars. The 2022 projections are reweighted to 2012 dollars in order to compare the two series.
3 For the naïve model, the average growth rate for CBO's potential GDP (at the base year 2012) was calculated backward 10 years to 2002 and projected forward 10 years to 2022.
Return to Projections Evaluation Homepage
Last Modified Date: January 19, 2024